Hindawi Publishing Corporation The Scientific World Journal Volume 2013, Article ID 969734, 12 pages http://dx.doi.org/10.1155/2013/969734
Research Article An Adaptive Cauchy Differential Evolution Algorithm for Global Numerical Optimization Tae Jong Choi,1 Chang Wook Ahn,1 and Jinung An2 1 2
Department of Computer Engineering, Sungkyunkwan University (SKKU), 2066 Seobu-ro, Suwon 440-746, Republic of Korea Robot Research Division, Daegu Gyeongbuk Institute of Science and Technology (DGIST), 50-1 Sang-ri, Hyeonpung-meyeon, Daegu 711-873, Republic of Korea
Correspondence should be addressed to Chang Wook Ahn;
[email protected] Received 3 May 2013; Accepted 6 June 2013 Academic Editors: P. Agarwal, S. Balochian, V. Bhatnagar, J. Yan, and Y. Zhang Copyright © 2013 Tae Jong Choi et al. This is an open access article distributed under the Creative Commons Attribution License, which permits unrestricted use, distribution, and reproduction in any medium, provided the original work is properly cited. Adaptation of control parameters, such as scaling factor (𝐹), crossover rate (CR), and population size (NP), appropriately is one of the major problems of Differential Evolution (DE) literature. Well-designed adaptive or self-adaptive parameter control method can highly improve the performance of DE. Although there are many suggestions for adapting the control parameters, it is still a challenging task to properly adapt the control parameters for problem. In this paper, we present an adaptive parameter control DE algorithm. In the proposed algorithm, each individual has its own control parameters. The control parameters of each individual are adapted based on the average parameter value of successfully evolved individuals’ parameter values by using the Cauchy distribution. Through this, the control parameters of each individual are assigned either near the average parameter value or far from that of the average parameter value which might be better parameter value for next generation. The experimental results show that the proposed algorithm is more robust than the standard DE algorithm and several state-of-the-art adaptive DE algorithms in solving various unimodal and multimodal problems.
1. Introduction Differential Evolution (DE) is a powerful population based search technique for optimizing problems. Many researchers have used the DE in practical fields because this technique has good convergence properties and is easy to apply [1]. The DE has three control parameters such as scaling factor (𝐹), crossover rate (CR), and population size (NP). The performance of DE is largely influenced by what parameter values are assigned to these control parameters. Therefore, in order to have a good optimization performance, finding suitable parameter values is of crucial importance [2, 3]. In the DE, the control parameters are usually adjusted by using the trialand-error search method. However, the value assigned by the trial-and-error method might be efficient for solving one type of problems and inefficient for solving other problems [4]. Moreover, it requires a lot of computational resources. As a solution of this problem, parameter adaptation has been utilized. According to Eiben et al. [5, 6], the parameter adaptation can be categorized into three classes as follows.
(1) Deterministic parameter control: the control parameters are adapted by some deterministic rule. (2) Adaptive parameter control: the control parameters are adapted by some form of feedback from evolutionary search. (3) Self-adaptive parameter control: the control parameters are adapted by the evolution-of-evolution technique. The control parameters are encapsulated in each individual as additional chromosomes and undergo evolutionary procedure. The well designed adaptive or self-adaptive parameter control method can improve the performance of DE. Therefore, the adaptive and self-adaptive parameter controls are more applicable than the trial-and-error search method. So far, many adaptive and self-adaptive DE algorithms have been proposed and they have shown that the adaptive and self-adaptive DE algorithms have more robust performance than standard DE algorithm for many benchmark functions
2 [4, 7, 8]. Although there are many suggestions for adapting control parameters, it is still a challenging task to properly adapt the control parameters for problem. Based on various experiments, we found out that the parameter adaptation should be performed in every generation and the control parameters of each individual should be adapted based on the average parameter value of successfully evolved individuals’ parameter values by using the Cauchy distribution. The Cauchy distribution is one of the long tail distributions. The Cauchy distribution generates large step from peak location with higher probability. Many evolutionary algorithms have used this long tail property as an escaping local minima method. The proposed algorithm also, but in different manner, utilizes the Cauchy distribution for the parameter adaptation. In the proposed algorithm, each individual has its own control parameters. The control parameters of each individual are adapted based on the average parameter value of successfully evolved individuals’ parameter values by using the Cauchy distribution. It is because the successfully evolved individuals are led by appropriate parameter values. That is to say, the appropriate parameter values make the individuals take the good region for solving problem. However, there is a possibility that the current appropriate parameter values might be inappropriate parameter values in next generation. Therefore, we cannot assure that the parameter adaptation based on the average parameter value is good for making well-suited parameter values for future generations. In view of the above considerations, the parameter adaptation of proposed algorithm utilizes the Cauchy distribution as a large step method. According to it, the control parameters of each individual are assigned either near the average parameter value or far from that of the average parameter value which might be better parameter value for next generation. The experimental results show that the proposed algorithm is more robust than standard DE algorithm and some adaptive and self-adaptive DE algorithms such as jDE [4], SaDE [7], and MDE [9] on solving multimodal problems as well as unimodal problems. The rest of this paper proceeds as follows. In Section 2, we introduce basic operations of standard DE algorithm and some adaptive and self-adaptive parameter control DE algorithms. In Section 3, the Cauchy distribution is described. The proposed algorithm is explained in detail in Section 4. Section 5 presents the experimental results. We conclude this paper in Section 6.
2. Related Work 2.1. DE Algorithm. In the DE, a parent vector is called “target vector,” a mutant vector is that generated by mixing donor vectors, and an offspring obtained by making crossover between target vector and mutant vector is called “trial vector.” A target vector generates a trial vector which is moved around in search space by using the mutation and the crossover operations. If the fitness value of the trial vector is better than or equal to the fitness value of the target vector, the trial vector is accepted and included in the population of next generation, otherwise it is discarded and the target vector
The Scientific World Journal remains for the next generation. This cycle of operations is repeated until some specific termination conditions are not satisfied. 2.1.1. Initialization. The population of the DE consists of NP individuals. Each individual is a 𝐷-dimensional parameter 1 𝐷 , . . . , 𝑥𝑖,𝐺 where 𝑖 = 1, . . . , NP. vectors, denoted as 𝑋𝑖,𝐺 = 𝑥𝑖,𝐺 In the initialization stage, first of all, the DE designates the search space of the test problem by prescribing the minimum 1 𝐷 , . . . , 𝑥min ) and the maximum (𝑋max = (𝑋min = 𝑥min 1 𝐷 𝑥max , . . . , 𝑥max ) parameter bounds. After that, the parameter vectors of the each individual are initialized as follows: 𝑥𝑖,𝑗,0 = 𝑥𝑗,MIN + rand [0, 1] ⋅ (𝑥𝑗,MAX − 𝑥𝑗,MIN ) ,
(1)
where rand[0, 1] is the uniform distributed random number lying between 0 and 1. By doing this, all the individuals are randomly scattered in the search space. After initialization, the DE executes a loop of the operations: mutation, crossover, and selection. 2.1.2. Mutation Operation. The mutation is the first operation to generate child individuals from their parent individuals. So far, a lot of mutation strategies have been proposed. Here, we explain an example, called DE/rand/1/bin, which was introduced by Storn and Price [1]. First of all, the mutation strategy randomly select three mutually exclusive individuals among [1, NP]. They are called the “donor vectors”, denoted as 𝑋𝑟1 ,𝐺, 𝑋𝑟2 ,𝐺, and 𝑋𝑟3 ,𝐺. A mutant vector 𝑉𝑖,𝐺 is generated by adding the scaling difference of 𝑋𝑟2 ,𝐺 and 𝑋𝑟3 ,𝐺 to 𝑋𝑟1 ,𝐺. 𝑉𝑖,𝐺 = 𝑋𝑟1 ,𝐺 + 𝐹 ⋅ (𝑋𝑟2 ,𝐺 − 𝑋𝑟3 ,𝐺) ,
(2)
where 𝐹 is a scaling factor for amplifying the difference value between 𝑋𝑟2 ,𝐺 and 𝑋𝑟3 ,𝐺. 2.1.3. Crossover Operation. The crossover generates the trial vectors by making a crossover between target vector and mutant vector. There are two crossover operations which are commonly used. They are the binomial and the exponential crossovers. Here, we describe the binomial crossover. At the beginning, a random number is selected. If the random number is less than or equal to the crossover rate CR, the first element of the trial vector is occupied by the first element of the mutant vector. Otherwise, the element is occupied by the target vector. This procedure is repeated 𝐷 times for each 1 𝐷 , . . . , 𝑢𝑖,𝐺 is generated as individual. The trial vector 𝑈𝑖,𝐺 = 𝑢𝑖,𝐺 follows: V 𝑢𝑖,𝑗,𝐺 = { 𝑖,𝑗,𝐺 𝑥𝑖,𝑗,𝐺
if (rand [0, 1) ≤ CR or 𝑗 = 𝑗rand ) otherwise.
(3)
Prior to crossover, the DE select another random number 𝑗rand lying between [1, 𝐷]. The random number is used to guarantee that at least one element of the trial vector is occupied by the mutant vector.
The Scientific World Journal
3
2.1.4. Selection Operation. The selection is the last operation of the DE iterations. It compares the fitness value of the target and the trial vectors. If the fitness value of the trial vector is better than or equal to the fitness value of the target vector, the trial vector is accepted and forms part of the population, otherwise it is discarded and the target vector remains for the next generation. these procedures are formulated as follows: 𝑈 𝑋𝑖,𝐺+1 = { 𝑖,𝐺 𝑋𝑖,𝐺
if (𝑓 (𝑈𝑖,𝐺) ≤ 𝑓 (𝑋𝑖,𝐺)) , otherwise.
(4)
2.2. jDE. Brest et al. [4] proposed a self-adaptive parameter control DE (called jDE) based on DE/rand/1/bin. In jDE, the control parameters, 𝐹 and CR, are encapsulated in each individual as additional chromosomes. Therefore, all individuals have their own control parameters, denoted as 𝐹𝑖 and CR𝑖 . jDE utilizes four additional parameters: 𝜏1 , 𝜏2 , 𝐹𝑙 , and 𝐹𝑢 . The first two parameters are used to determine whether the control parameters need to be updated or not and the last two parameters are used to designate the range of the control parameter 𝐹𝑖 . At the beginning, the values of 𝐹𝑖 and CR𝑖 are initialized by 0.5 and 0.9, respectively. Then, the control parameters 𝐹𝑖 and CR𝑖 for next generation are adapted as follows: 𝐹𝑖,𝐺+1 = {
𝐹𝑙 + rand2 [0, 1] ⋅ 𝐹𝑢 𝐹𝑖,𝐺
CR𝑖,𝐺+1 = {
rand4 [0, 1] CR𝑖,𝐺
if (rand1 [0, 1] < 𝜏1 ) , otherwise,
if (rand3 [0, 1] < 𝜏2 ) , otherwise.
(5)
The author used 𝜏1 = 0.1, 𝜏2 = 0.1, 𝐹𝑙 = 0.1, and 𝐹𝑢 = 0.9. This procedure is executed before applying the mutation operation. Therefore, newly generated control parameters affect the mutation and the crossover operations. 2.3. DESAP. Teo [10] proposed the first self-adaptive population size DE (called DESAP) based on the self-adaptive Pareto DE [11]. DESAP can self-adapt not only the scaling factor 𝐹 and the crossover rate CR but also the population size NP. This algorithm utilizes additional parameters such as 𝜂𝑖 , 𝛿𝑖 , and 𝜋𝑖 . These parameters are encapsulated in each individual as additional chromosomes and also participated in the mutation and the crossover operations for evolving itself. The newly generated control parameters are selected when the fitness value of the trial vector is lower than or equal to the fitness value of the target vector. DESAP is divided into two algorithms (i.e., DESAP-abs and DESAP-rel) according to the equation of the population size for the next generation. DESAP has shown the effectiveness of the selfadaptive population size technique. 2.4. JADE. Zhang and Sanderson [12, 13] proposed a new mutation strategy called DE/current-to-𝑝best which is lower greedy than DE/current-to-best/1. This strategy utilizes not the best individual of the population but the randomly selected one from the top 100𝑝% (𝑝 ∈ (0, 1]) individuals. In addition, an external archive scheme was proposed by storing
the set of parameter vectors of recently discarded individuals. These parameter vectors provide the additional information about promising progress direction and increase the population diversity. The following equations represent the DE/current-to-𝑝best with and without the external archive strategy: (1) DE/current-to-𝑝best with archive: 𝑝
̃𝑟2,𝐺) , 𝑉𝑖,𝐺 = 𝑋𝑖,𝐺 + 𝐹𝑖 ⋅ (𝑋best,𝐺 − 𝑋𝑖,𝐺) + 𝐹𝑖 ⋅ (𝑋𝑟1,𝐺 − 𝑋 (6) (2) DE/current-to-𝑝best without archive: 𝑝
𝑉𝑖,𝐺 = 𝑋𝑖,𝐺 + 𝐹𝑖 ⋅ (𝑋best,𝐺 − 𝑋𝑖,𝐺) + 𝐹𝑖 ⋅ (𝑋𝑟1,𝐺 − 𝑋𝑟2,𝐺) , (7) ̃𝑟2,𝐺 is an individual randomly selected from the where 𝑋 population or external archive. In terms of parameter adaptation, JADE adapts the crossover rate CR𝑖 , as follows: CR𝑖 = rnd 𝑛𝑖 (𝜇CR , 0.1) ,
(8)
where rnd 𝑛𝑖 is the Gaussian distributed random number generator. After that, the crossover rate CR𝑖 is truncated to [0, 1]. Moreover, 𝜇CR that is a mean value to generate CR𝑖 is modified as follows: 𝜇CR = (1 − 𝑐) ⋅ 𝜇CR + 𝑐 ⋅ mean𝐴 (𝑆CR ) ,
(9)
where 𝑐 is a constant value in [0, 1], mean𝐴 stands for the arithmetic mean, and 𝑆CR contains the successfully evolved crossover rates of individuals after the selection operation. Similarly, the scaling factor 𝐹𝑖 is adapted as follows: 𝐹𝑖 = rnd 𝑐𝑖 (𝜇𝐹 , 0.1) ,
(10)
where rnd 𝑐𝑖 is the Cauchy distributed random number generator. After that, the scaling factor 𝐹𝑖 is truncated to 1 if 𝐹𝑖 ≥ 1 or regenerated if 𝐹𝑖 ≤ 0. Also, 𝜇𝐹 that is a mean value to generate 𝐹𝑖 is modified as follows: 𝜇𝐹 = (1 − 𝑐) ⋅ 𝜇𝐹 + 𝑐 ⋅ mean𝐿 (𝑆𝐹 ) ,
(11)
where 𝑐 is a constant value in [0, 1], mean𝐿 stands for the Lehmer mean, and 𝑆𝐹 contains the successfully evolved scaling factors of individuals after the selection operation. 2.5. MDE. Ali and Pant [9] proposed a Modified Differential Evolution (MDE). This algorithm utilizes the Cauchy distribution as another mutation operation. In the selection operation, all individuals are monitored and the results of the selection operation are stored in the failure counter. If some individuals consequently fail to be selected as an individual for the next generation over MFC (Maximum Failure Counter), MDE assumes that these individuals were felled into some local minima. Therefore, the algorithm applies the Cauchy distributed mutation to these individuals instead of the mutation and the crossover operations to escape the local minima. After that, the failure counter is initialized by 0. MDE has shown the good performance for the higher dimensional problems, compared with DE/rand/1/bin.
4
The Scientific World Journal
3. Analysis of the Cauchy Distribution
0.7
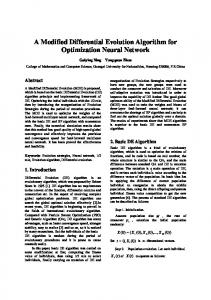
The Cauchy distribution is a continuous probability distribution and it has two parameters 𝑥0 and 𝛾. 𝑥0 is the peak location of the distribution and 𝛾 stands for the halfwidth at halfmaximum (HWHM) of the distribution. The value of 𝛾 determines the shape of the Cauchy distribution. If 𝛾 is assigned a lower value, the peak of the probability density function would be higher and its width would be narrower. On the other hand, if 𝛾 is assigned a higher value, the probability density function would have a lower peak and a wider width. The Cauchy distribution generates a large step from the peak with a higher probability. In general, many evolutionary algorithms have used this long tail property as an escaping local minima technique. The probability density function and the cumulative distribution function of the Cauchy distribution are defined by
0.6
𝑓 (𝑥; 𝑥0 , 𝛾) =
P(x)
0.4 0.3 0.2 0.1 0
−5
−4
−3
−2
−1
0
1
2
3
4
5
x L = 0, S = 0.5 L = 0, S = 1
L = 0, S = 2 L = −2, S = 2
Figure 1: The various probability density functions of the Cauchy distribution.
1 2
𝜋𝛾 [1 + ((𝑥 − 𝑥0 ) /𝛾) ]
=
𝛾 1 ], [ 𝜋 (𝑥 − 𝑥0 )2 + 𝛾2
=
1 1 arctan ((𝑥 − 𝑥0 ) /𝛾) + . 𝜋 2
𝐹 (𝑥; 𝑥0 , 𝛾)
0.5
(12)
Figure 1 illustrates the various probability density functions of the Cauchy distribution. Here, 𝐿 and 𝑆 denote the location (𝑥0 ) and the scaling factor (𝛾), respectively. In addition, 𝐿 = 0 and 𝑆 = 1 generate the standard Cauchy distribution.
4. Adaptive Cauchy DE 4.1. When Parameter Adaptation Should Be Performed? Finding appropriate moments of adapting control parameters is important problem for improving the DE performance. In this section, we explain when parameter adaptation should be performed. Looking for previous studies, jDE utilizes self-adaptive method which allows each individual to maintain suitable control parameter values by itself. However, the parameter adaptation of jDE depends on the predefined probabilities (𝜏1 and 𝜏2 ). Therefore, this method does not guarantee the adequacy of maintained control parameter values for current generation. In other words, it is possible that some individuals maintain unsuitable control parameter values. In SaDE, the scaling factor is calculated in every generation by using Gaussian distribution with the predefined mean value and all individuals utilize it. The crossover rate of SaDE, each individual has its own crossover rate and they are calculated by using Gaussian distribution with the median value of accumulated information about selection operation results during learning period as a mean value. This method is performed in every end of learning period. The parameter adaptation of SaDE has two problems. First, although each individual has different state during the DE iteration, the
scaling factor adaptation of SaDE does not consider it. Therefore, many individuals might be utilized unsuitable control parameter values. Second, the selection operation results of past generations might become unnecessary or even noisy information for adapting the crossover rate. In addition, similar to jDE, during the learning period, it is possible that some individuals maintain unsuitable control parameter values. Parameter adaptation should be performed whenever current control parameter values are not suitable for finding optimal value. We can utilize the selection operation results for distinguishing that an individual has suitable control parameters or not because the DE is based on the elitism. We find out that parameter adaptation should be performed in every generation. This means that every generation is appropriate moments of adapting control parameters. The reasons are follows. (1) If an individual has good control parameter values, the child individual can succeed in the selection operation and it can locate better region for finding optimal value than the region of its parent individual. At this moment, the characteristic of child individual region might differ from the characteristic of its parent region. It means that there is a possibility of the existing of more suitable control parameter values than the previous control parameter values for new region. Therefore, although an individual succeeds in the selection operation, we should apply parameter adaptation for finding more suitable control parameter values. (2) On the contrary, if an individual does not have good parameter values, the child individual might fail to evolve in the selection operation and then it remains the same region with its parent individual. This indicates that the individual needs more suitable control parameter values for escaping the region. Therefore, if an individual fails to evolve itself, we should also apply parameter adaptation.
The Scientific World Journal
5 Table 1: Benchmark functions used in the performance evaluation. Dim
Search space
Global min.
30
[−100, 100]𝐷
0
𝐹2 (𝑥) = ∑|𝑥𝑖 | + ∏|𝑥𝑖 |
30
[−10, 10]𝐷
0
𝐹3 (𝑥) = max𝑖 (|𝑥𝑖 |, 1 ≤ 𝑖 ≤ 𝐷)
30
[−100, 100]𝐷
0
𝐹4 (𝑥) = ∑(⌊𝑥𝑖 + 0.5⌋)
30
[−100, 100]𝐷
0
𝐹5 (𝑥) = ∑𝑖𝑥𝑖4 + random [0, 1)
30
[−1.28, 1.28]𝐷
0
𝐹6 (𝑥) = ∑ − 𝑥𝑖 sin (√𝑥𝑖 )
30
[−500, 500]𝐷
−12569.5
𝐹7 (𝑥) = ∑ (𝑥𝑖2 − 10 cos (2𝜋𝑥𝑖 ) + 10)
30
[−5.12, 5.12]𝐷
0
30
[−32, 32]𝐷
0
30
[−600, 600]𝐷
0
30
[−50, 50]𝐷
0
30
[−50, 50]𝐷
0
30
[−100, 100]𝐷
0
30
[−15, 15]𝐷
0
30
[−100, 100]𝐷
0
Benchmark function 𝐷
𝐹1 (𝑥) = ∑𝑥𝑖2 𝑖=1 𝐷
𝐷
𝑖=1
𝑖=1
𝐷
2
𝑖=1 𝐷 𝑖=1 𝐷 𝑖=1 𝐷 𝑖=1
𝐹8 (𝑥) = −20 exp (−0.2√
1 𝐷 2 1 𝐷 ∑𝑥𝑖 ) − exp ( ∑ cos 2𝜋𝑥𝑖 ) + 20 + exp (1) 𝐷 𝑖=1 𝐷 𝑖=1
𝑥 1 𝐷 2 𝐷 ∑𝑥 − ∏ cos ( 𝑖 ) + 1 √𝑖 4000 𝑖=1 𝑖 𝑖=1 𝐷−1 𝜋 2 2 𝐹10 (𝑥) = {10 sin2 (𝜋𝑦1 ) + ∑ (𝑦𝑖 − 1) [1 + 10 sin2 (𝜋𝑦𝑖+1 )] + (𝑦𝐷 − 1) } 𝐷 𝑖=1 𝐹9 (𝑥) =
𝐷
+∑𝑢 (𝑥𝑖 , 10, 100, 4) 𝑖=1
𝐷−1
2
2
𝐹11 (𝑥) = 0.1 {sin2 (3𝜋𝑥1 ) + ∑ (𝑥𝑖 − 1) [1 + sin2 (3𝜋𝑥𝑖+1 )] + (𝑥𝐷 − 1) [1 + sin2 (2𝜋𝑥𝐷 )]} 𝑖=1
𝐷
+∑𝑢 (𝑥𝑖 , 5, 100, 4) 𝑖=1
𝐷−1
𝐹12 (𝑥) = 𝑓12 (𝑥𝑛 , 𝑥1 ) + ∑ 𝑓12 (𝑥𝑖 , 𝑥𝑖+1 ) 2
𝑖=1 2 0.25
𝑓12 (𝑥, 𝑦) = (𝑥 + 𝑦 )
2
2
2 0.1
[sin (50(𝑥 + 𝑦 ) ) + 1]
𝐷−1
2 − 0.3 cos (3𝜋𝑥𝑖 ) − 0.4 cos (4𝜋𝑥𝑖+1 ) + 0.7) 𝐹13 (𝑥) = ∑ (𝑥𝑖2 + 2𝑥𝑖+1 𝑖=1 𝐷−1
0.25
2 𝐹14 (𝑥) = ∑ (𝑥𝑖2 + 𝑥𝑖+1 ) 𝑖=1
0.1
2 [sin2 (50(𝑥𝑖2 + 𝑥𝑖+1 ) ) + 1]
As a result, because the individuals of DE are evolved for exploring new regions, it is hard to assure that the previous suitable control parameter values are still suitable until satisfying some probabilities or during some periods. Therefore, parameter adaptation should be performed in every generation. 4.2. How Parameter Adaptation Should Be Performed? Finding proper method of adapting control parameters is also important problem for improving the DE performance. In this section, we explain how parameter adaptation should be performed. When performing parameter adaptation, we can utilize the successfully evolved individuals’ control parameter values for parameter adaptation. It is because the successfully evolved individuals are led by good parameter values. That is
to say, good parameter values make the individuals take the good region for solving problem. Looking for previous studies, jDE adapts control parameter values by using the uniform distribution. However, the randomly generated control parameter values might not be suitable for finding better region. In SaDE, the successfully evolved individuals’ crossover rates are stored in CR Memory. After learning period, the parameter adaptation of SaDE extracts the median value from the CR Memory as a mean value of the Gaussian distribution. In general, the median function is not largely influenced by outliers. However, the outliers give us the information about a new possibility of better control parameter values. Therefore, we should consider the outliers together. As a result, the successfully evolved individuals’ control parameter values based parameter adaptation is proper
6
The Scientific World Journal Table 2: The experiment result of comparison of adaptive Cauchy DE with other DE algorithms. GEN
𝐹1 𝐹2 𝐹3 𝐹4 𝐹5 𝐹6 𝐹7 𝐹8 𝐹9 𝐹10 𝐹11 𝐹12 𝐹13 𝐹14
1500 2000 5000 1500 3000 9000 5000 1500 2000 1500 1500 3000 1000 3000
Adaptive Cauchy DE Mean Std 5.0E − 36 9.4E − 36 2.4E − 30 1.6E − 30 2.9𝐸 − 12 1.1𝐸 − 12 0.0𝐸 + 00 0.0𝐸 + 00 3.0E − 03 6.9E − 04 −12569.5 7.3E − 12 0.0E + 00 0.0E + 00 3.3E − 15 7.0E − 16 0.0E + 00 0.0E + 00 1.6E − 32 5.5E − 48 1.3E − 32 1.1E − 47 6.1E − 22 5.0E − 22 5.0E − 20 3.4E − 20 3.5E − 22 2.5E − 22
DE/rand/1/bin Mean Std 7.9𝐸 − 14 6.8𝐸 − 14 1.2𝐸 − 09 6.7𝐸 − 10 3.3𝐸 − 02 7.2𝐸 − 02 0.0𝐸 + 00 0.0𝐸 + 00 4.6𝐸 − 03 1.0𝐸 − 03 −11095.3 5.2𝐸 + 02 7.1𝐸 + 01 2.9𝐸 + 01 9.2𝐸 − 08 4.0𝐸 − 08 3.9𝐸 − 04 2.0𝐸 − 03 6.5𝐸 − 15 5.6𝐸 − 15 5.9𝐸 − 14 4.9𝐸 − 14 2.1𝐸 − 07 1.3𝐸 − 07 7.3𝐸 − 04 6.6𝐸 − 04 2.3𝐸 − 05 1.7𝐸 − 05
jDE Mean Std 2.6𝐸 − 28 4.0𝐸 − 28 1.8𝐸 − 23 1.8𝐸 − 23 2.0E − 15 3.3E − 15 0.0𝐸 + 00 0.0𝐸 + 00 3.1𝐸 − 03 8.5𝐸 − 04 −12569.5 7.3E − 12 0.0E + 00 0.0E + 00 8.2𝐸 − 15 2.3𝐸 − 15 0.0E + 00 0.0E + 00 7.0𝐸 − 30 7.2𝐸 − 30 1.2𝐸 − 28 1.4𝐸 − 28 6.3𝐸 − 17 7.0𝐸 − 17 1.4𝐸 − 15 6.9𝐸 − 16 7.5𝐸 − 17 1.4𝐸 − 16
SaDE Mean Std 1.8𝐸 − 20 2.3𝐸 − 20 6.2𝐸 − 15 3.2𝐸 − 15 7.8𝐸 − 10 2.0𝐸 − 10 0.0𝐸 + 00 0.0𝐸 + 00 4.5𝐸 − 03 1.2𝐸 − 03 −12569.5 7.3E − 12 0.0E + 00 0.0E + 00 5.3𝐸 − 11 3.7𝐸 − 11 0.0E + 00 0.0E + 00 3.3𝐸 − 20 4.2𝐸 − 20 8.5𝐸 − 20 1.6𝐸 − 19 3.5𝐸 − 12 2.9𝐸 − 12 1.5𝐸 − 07 3.4𝐸 − 08 1.8𝐸 − 10 2.2𝐸 − 10
MDE Mean Std 7.0𝐸 − 17 2.8𝐸 − 17 4.8𝐸 − 13 1.3𝐸 − 13 2.0𝐸 − 08 8.5𝐸 − 09 0.0𝐸 + 00 0.0𝐸 + 00 8.8𝐸 − 03 1.8𝐸 − 03 −11482.1 3.0𝐸 + 02 4.0𝐸 + 01 5.6𝐸 + 00 4.0𝐸 − 09 9.2𝐸 − 10 7.4𝐸 − 03 1.1𝐸 − 02 9.9𝐸 − 18 1.5𝐸 − 17 2.6𝐸 − 17 1.6𝐸 − 17 7.4𝐸 − 11 3.9𝐸 − 11 3.4𝐸 − 05 1.3𝐸 − 05 1.2𝐸 − 08 3.7𝐸 − 09
Table 3: The success rate of comparison of adaptive Cauchy DE with other DE algorithms. Success rate Adaptive Cauchy DE DE/rand/1/bin jDE SaDE MDE
𝐹1 100% 100% 100% 100% 100%
𝐹2 100% 100% 100% 100% 100%
𝐹3 100% 38% 100% 100% 100%
𝐹4 100% 100% 100% 100% 100%
𝐹5 100% 100% 100% 100% 72%
𝐹6 100% 0% 100% 100% 0%
𝐹7 100% 0% 100% 100% 0%
𝐹8 100% 100% 100% 100% 100%
𝐹9 100% 96% 100% 100% 58%
𝐹10 100% 100% 100% 100% 100%
𝐹11 100% 100% 100% 100% 100%
𝐹12 100% 100% 100% 100% 100%
𝐹13 100% 0% 100% 100% 0%
𝐹14 100% 18% 100% 100% 100%
Table 4: The experiment result of comparison of adaptive Cauchy DE with FEP and CEP. GEN 𝐹1 𝐹2 𝐹3 𝐹4 𝐹5 𝐹6 𝐹7 𝐹8 𝐹9 𝐹10 𝐹11
1500 2000 5000 1500 3000 9000 5000 1500 2000 1500 1500
Adaptive Cauchy DE Mean Std 5.0E − 36 9.4E − 36 2.4E − 30 1.6E − 30 2.9E − 12 1.1E − 12 0.0E + 00 0.0E + 00 3.0E − 03 6.9E − 04 −12569.5 7.3E − 12 0.0E + 00 0.0E + 00 3.3E − 15 7.0E − 16 0.0E + 00 0.0E + 00 1.6E − 32 5.5E − 48 1.3E − 32 1.1E − 47
DE/rand/1/bin Mean Std 7.9𝐸 − 14 6.8𝐸 − 14 1.2𝐸 − 09 6.7𝐸 − 10 3.3𝐸 − 02 7.2𝐸 − 02 0.0E + 00 0.0E + 00 4.6𝐸 − 03 1.0𝐸 − 03 −11095.3 5.2𝐸 + 02 7.1𝐸 + 01 2.9𝐸 + 01 9.2𝐸 − 08 4.0𝐸 − 08 3.9𝐸 − 04 2.0𝐸 − 03 6.5𝐸 − 15 5.6𝐸 − 15 5.9𝐸 − 14 4.9𝐸 − 14
method to adapting control parameter values. This method should also consider the outliers. 4.3. The Proposed Algorithm. The proposed algorithm makes use of DE/rand/1/bin as a basic framework, in which the mutation is one of weaker greedy mutation strategies. In general, this mutation strategy is not so efficient in solving the unimodal problems since its lack of the fast convergence property makes the population slowly converge into the global minimum. However, if the control parameters are adapted suitably, this strategy can also demonstrate a good
FEP Mean 5.7𝐸 − 04 8.1𝐸 − 03 3.0𝐸 − 01 0.0E + 00 7.6𝐸 − 03 −12554.5 4.6𝐸 − 02 1.8𝐸 − 02 1.6𝐸 − 02 9.2𝐸 − 06 1.6𝐸 − 04
CEP Std 1.3𝐸 − 04 7.7𝐸 − 04 5.0𝐸 − 01 0.0E + 00 2.6𝐸 − 03 5.3𝐸 + 01 1.2𝐸 − 02 2.1𝐸 − 03 2.2𝐸 − 02 3.6𝐸 − 06 7.3𝐸 − 05
Mean 2.2𝐸 − 04 2.6𝐸 − 03 2.0𝐸 + 00 5.8𝐸 + 02 1.8𝐸 − 02 −7917.1 8.9𝐸 + 01 9.2𝐸 + 00 8.6𝐸 − 02 1.8𝐸 + 00 1.4𝐸 + 00
Std 5.9𝐸 − 04 1.7𝐸 − 04 1.2𝐸 + 00 1.1𝐸 + 03 6.4𝐸 − 03 6.3𝐸 + 02 2.3𝐸 + 01 2.8𝐸 + 00 1.2𝐸 − 01 2.4𝐸 + 00 3.7𝐸 + 00
performance property in the unimodal and the multimodal problems. The proposed algorithm adjusts two control parameters, 𝐹 and CR, except for NP. The control parameter NP does not seriously affect the performance of DE more than the other two control parameters. Prior to explaining the adaptation procedures, the characteristics of these parameters are described. The control parameter 𝐹 is related to the convergence speed of DE. Therefore, a higher value of 𝐹 encourages the exploration power which is generally useful in the early stage of DE. On the other hand, a lower value of
The Scientific World Journal
7
Table 5: The experiment result of comparison of adaptive Cauchy DE with adaptive LEP and best L´evy. GEN 𝐹1 𝐹6 𝐹7 𝐹8 𝐹9 𝐹10 𝐹11
1500 1500 1500 1500 1500 1500 1500
Adaptive Cauchy DE Mean Std 4.7E − 36 5.1E − 36 −12569.5 7.3E − 12 0.0E + 00 0.0E + 00 3.2E − 15 5.0E − 16 0.0E + 00 0.0E + 00 1.6E − 32 5.5E − 48 1.3E − 32 1.1E − 47
DE/rand/1/bin Mean Std 7.2𝐸 − 14 7.9𝐸 − 14 −6506.71 6.7𝐸 + 02 1.7𝐸 + 02 1.2𝐸 + 01 9.1𝐸 − 08 3.7𝐸 − 08 2.2𝐸 − 13 1.4𝐸 − 13 7.5𝐸 − 15 7.2𝐸 − 15 5.4𝐸 − 14 4.9𝐸 − 14
Adaptive LEP Mean Std 6.3𝐸 − 04 7.6𝐸 − 05 −11469.2 5.8𝐸 + 01 5.9𝐸 + 00 2.1𝐸 + 00 1.9𝐸 − 02 1.0𝐸 − 03 2.4𝐸 − 02 2.8𝐸 − 02 6.0𝐸 − 06 1.0𝐸 − 06 9.8𝐸 − 05 1.2𝐸 − 05
Best L´evy Mean Std 6.6𝐸 − 04 6.4𝐸 − 05 −11898.2 5.2𝐸 + 01 1.3𝐸 + 01 2.3𝐸 + 00 3.1𝐸 − 02 2.0𝐸 − 03 1.8𝐸 − 02 1.7𝐸 − 02 3.0𝐸 − 05 4.0𝐸 − 06 2.6𝐸 − 04 3.0𝐸 − 05
Table 6: The experiment result of comparison of various failure counters. GEN 𝐹1 1500 𝐹2 2000 𝐹3 5000 𝐹4 1500 𝐹5 3000 𝐹6 9000 𝐹7 5000 𝐹8 1500 𝐹9 2000 𝐹10 1500 𝐹11 1500 𝐹12 3000 𝐹13 1000 𝐹14 3000
FC𝐹 = 0, Mean 5.0𝐸 − 36 2.4𝐸 − 30 2.9E − 12 0.0𝐸 + 00 3.0E − 03 −12569.5 0.0𝐸 + 00 3.3E − 15 0.0𝐸 + 00 1.6E − 32 1.3E − 32 6.1𝐸 − 22 5.0𝐸 − 20 3.5𝐸 − 22
FCCR = 0 Std 9.4𝐸 − 36 1.6𝐸 − 30 1.1E − 12 0.0𝐸 + 00 6.9E − 04 7.3E − 12 0.0𝐸 + 00 7.0E − 16 0.0𝐸 + 00 5.5E − 48 1.1E − 47 5.0𝐸 − 22 3.4𝐸 − 20 2.5𝐸 − 22
FC𝐹 = 0, Mean 4.0𝐸 − 31 1.7𝐸 − 26 1.9𝐸 − 04 0.0𝐸 + 00 3.1𝐸 − 03 −12569.5 0.0𝐸 + 00 1.4𝐸 − 14 0.0𝐸 + 00 9.6𝐸 − 32 7.3𝐸 − 31 1.6𝐸 − 18 1.7𝐸 − 16 7.2𝐸 − 19
FCCR = 1 Std 5.2𝐸 − 31 1.5𝐸 − 26 3.0𝐸 − 05 0.0𝐸 + 00 8.4𝐸 − 04 7.3E − 12 0.0𝐸 + 00 4.5𝐸 − 15 0.0𝐸 + 00 6.6𝐸 − 32 1.1𝐸 − 30 1.8𝐸 − 18 1.4𝐸 − 16 7.1𝐸 − 19
FC𝐹 = 1, Mean 6.9E − 40 8.7E − 34 2.5𝐸 + 00 0.0𝐸 + 00 3.1𝐸 − 03 −12569.5 0.0𝐸 + 00 3.1𝐸 − 15 0.0𝐸 + 00 4.8𝐸 − 07 1.4𝐸 − 32 1.4E − 23 5.8E − 23 9.5E − 25
𝐹 promotes the exploitation power that is usually desirable in the later stage of DE. Moreover, the value of control parameter CR is related to the diversity of population. The parameter adaptation of proposed algorithm utilizes 𝐹 Memory and CR Memory. The successfully evolved individuals’ scaling factors and crossover rates are stored in these memories. When performing parameter adaptation, arithmetic mean function is applied to extract mean values and these are actual parameter values of the Cauchy distribution as location parameters. The Cauchy distribution is one of the long tail distributions. The Cauchy distribution generates the large step from the peak location with higher probability. There is a possibility that the current appropriate parameter values might be the inappropriate parameter values in next generation. Therefore, we cannot assure that the average parameter value is still the well-suited parameter value for the future generations. In view of the above considerations, the parameter adaptation of the proposed algorithm utilizes the Cauchy distribution as a large step method. Through this, the control parameters of each individual are assigned either near the average parameter value or far from that of the average parameter value which might be the better parameter value of the next generation.
FCCR = 0 Std 6.8E − 40 5.2E − 34 2.9𝐸 + 00 0.0𝐸 + 00 8.9𝐸 − 04 7.3E − 12 0.0𝐸 + 00 0.0𝐸 + 00 0.0𝐸 + 00 3.4𝐸 − 06 6.9𝐸 − 34 6.9E − 23 3.3E − 23 1.1E − 24
FC𝐹 = 1, Mean 2.1𝐸 − 35 3.4𝐸 − 30 4.7𝐸 − 01 0.0𝐸 + 00 3.0𝐸 − 03 −12569.5 0.0𝐸 + 00 3.0𝐸 − 07 0.0𝐸 + 00 1.6𝐸 − 32 1.3𝐸 − 32 2.0𝐸 − 21 8.6𝐸 − 20 8.0𝐸 − 22
FCCR = 1 Std 4.1𝐸 − 35 3.1𝐸 − 30 9.7𝐸 − 01 0.0𝐸 + 00 8.0𝐸 − 04 7.3E − 12 0.0𝐸 + 00 2.1𝐸 − 06 0.0𝐸 + 00 3.6𝐸 − 34 1.1𝐸 − 47 2.1𝐸 − 21 5.9𝐸 − 20 8.9𝐸 − 22
FC𝐹 = 2, Mean 1.4𝐸 − 30 2.0𝐸 − 26 1.1𝐸 + 00 0.0𝐸 + 00 3.1𝐸 − 03 −12567.1 0.0𝐸 + 00 1.5𝐸 − 14 0.0𝐸 + 00 1.7𝐸 − 31 8.5𝐸 − 31 1.4𝐸 − 18 4.7𝐸 − 17 8.3𝐸 − 19
FCCR = 2 Std 2.0𝐸 − 30 1.4𝐸 − 26 1.5𝐸 + 00 0.0𝐸 + 00 8.3𝐸 − 04 1.7𝐸 + 01 0.0𝐸 + 00 2.6𝐸 − 15 0.0𝐸 + 00 1.6𝐸 − 31 7.8𝐸 − 31 1.4𝐸 − 18 4.1𝐸 − 17 6.6𝐸 − 19
The details of the proposed algorithm are given as follows. First of all, all individuals have their own control parameters, 𝐹𝑖 and CR𝑖 where 𝑖 is the individual’s index. At the initialization stage, these parameters are initialized as 0.5 and 0.9, respectively. The mutation and crossover operations used in DE/rand/1/bin are employed. In the selection operation, if the trial vector is selected as an individual for the next generation, the control parameter values of this individual are stored in the 𝐹 Memory and CR Memory. After the selection operation, the parameter adaptation is carried out. The parameter 𝐹𝑖 is adapted by the Cauchy distribution with the average parameter value. After that, the 𝐹𝑖 is truncated to 0.1 or 1 if the 𝐹𝑖 is less than 0.1 or greater than 1. The adaptation of the scaling factor is performed as follows: 𝐹𝑖,𝐺+1 = 𝐶 (0, 𝛾𝐹 ) + 𝐹avg,𝐺,
(13)
where 𝐹avg,𝐺 is the average parameter value of the accumulated information in the 𝐹 Memory as the location parameter of the Cauchy distribution. The 𝛾𝐹 is scaling factor of the equation and is assigned 0.1. Similarly, the CR𝑖 is adapted by the Cauchy distribution with the average parameter value. After that, the CR𝑖 is
8
The Scientific World Journal
truncated to 0 or 1 if the CR𝑖 is less than 0 or greater than 1. The adaptation of the crossover rate is given as follows: CR𝑖,𝐺+1 = 𝐶 (0, 𝛾CR ) + CRavg,𝐺,
(14)
where CRavg,𝐺 is the average parameter value of the accumulated information in the CR Memory as the location parameter of the Cauchy distribution. The 𝛾𝐹 is scaling factor of the equation and is assigned 0.1. Algorithm 1 describes the pseudocode of the proposed algorithm. When performing parameter adaptation, if there is no successfully evolved individual, then the average parameter values are assigned the average parameter values of last generation.
5. Performance Evaluation 5.1. Benchmark Functions. The performance of proposed algorithm was evaluated by fourteen benchmark functions. The first eleven benchmark functions are from [14, 15] and the rest benchmark functions are Extended 𝑓12 (𝐹12 ), Bohachevsky (𝐹13 ), and Schaffer (𝐹14 ). The functions are shown in Table 1. The characteristics of the benchmark functions are described as follows: 𝐹1 –𝐹3 are continuous unimodal functions, 𝐹4 is a discontinuous step function, 𝐹5 is a noise quadratic function, and 𝐹6 –𝐹14 are continuous multimodal functions that the number of local minima exponentially increases when their dimension grows. A more detailed description of each function is given in [14, 15]. 5.2. Experiment Setup. The proposed algorithm was compared to standard DE algorithm and several state-of-art adaptive DE algorithms. The five algorithms in comparison are listed as follows: (1) adaptive Cauchy DE; (2) DE/rand/1/bin with 𝐹 = 0.5 and CR = 0.9 [1, 4, 16, 17]; (3) jDE [4]; (4) SaDE [7]; (5) MDE with MFC = 5 [9]. All of the used parameter values are the recommended or utilized parameter values by their authors. The population size NP is fixed by 100 in all experiments. The maximum number of generations is assigned by 1500 for 𝐹1 , 𝐹4 , 𝐹8 , 𝐹10 , and 𝐹11 ; 2000 for 𝐹2 and 𝐹9 ; 3000 for 𝐹5 , 𝐹12 , and 𝐹14 ; 5000 for 𝐹3 and 𝐹7 ; 9000 for 𝐹6 ; 1000 for 𝐹13 . All experiment results were run 50 times, independently. For clarity, the result of the best algorithm is marked in boldface. If the difference between the global minimum and the best fitness is lower than 10−5 (In 𝐹5 , 10−2 ), we countered the experiment is successful. 5.3. Comparison of Adaptive Cauchy DE with Adaptive DE Algorithms. The mean and the standard deviation of experiment results obtained by adaptive Cauchy DE and
/∗ Initialization ∗ / Generate the initial population Evaluate the initial population FOR 𝑖 = 0 to NP DO 𝐹𝑖 = 0.5 CR𝑖 = 0.9 END FOR WHILE The termination condition is not satisfied DO /∗ Mutation operation ∗ / FOR 𝑖 = 0 to NP DO Generate a mutant vector 𝑉𝑖,𝐺 Randomly select three donor vectors 𝑋𝑟1 , 𝑋𝑟2 , 𝑋𝑟3 𝑉𝑖,𝐺 = 𝑋𝑟1 ,𝐺 + 𝐹𝑖 ⋅ (𝑋𝑟2 ,𝐺 − 𝑋𝑟3 ,𝐺) END FOR /∗ Crossover operation ∗ / FOR 𝑖 = 0 to NP DO Generate a trial vector 𝑈𝑖,𝐺 Select a random number 𝑗rand lying between [1, 𝐷] FOR 𝑗 = 0 to 𝐷 DO IF rand[0, 1) ≤ CR𝑖 or 𝑗 == 𝑗rand THEN 𝑢𝑖,𝑗,𝐺 = 𝑣𝑖,𝑗,𝐺 ELSE 𝑢𝑖,𝑗,𝐺 = 𝑥𝑖,𝑗,𝐺 END IF END FOR END FOR /∗ Selection operation ∗ / 𝑘=0 FOR 𝑖 = 0 to NP DO IF 𝑓(𝑈𝑖,𝐺) ≤ 𝑓(𝑋𝑖,𝐺) THEN 𝑋𝑖,𝐺+1 = 𝑈𝑖,𝐺 F Memory[𝑘] = 𝐹𝑖 CR Memory[𝑘] = CR𝑖 𝑘+ = 1 ELSE 𝑋𝑖,𝐺+1 = 𝑋𝑖,𝐺 END IF END FOR /∗ Parameter adaptation ∗ / IF 𝑘 ≠ 0 THEN 𝐹avg,𝐺 = mean(F Memory, 𝑘) CRavg,𝐺 = mean(CR Memory, 𝑘) END IF FOR 𝑖 = 0 to NP DO 𝐹𝑖,𝐺+1 = 𝐶(0, 𝛾𝐹 ) + 𝐹avg,𝐺 CR𝑖,𝐺+1 = 𝐶(0, 𝛾CR ) + CRavg,𝐺 END FOR END WHILE Algorithm 1: Adaptive Cauchy DE.
the compared DE algorithms for 𝐹1 –𝐹14 for 𝐷 = 30 are summarized in Table 2. The proposed algorithm shows better performance on solving the unimodal problems as well as in the multimodal problems except 𝐹3 benchmark function. jDE shows the best performance in 𝐹3 benchmark function. The proposed
The Scientific World Journal
9 Table 7: The success rate of comparison of various failure counters.
Success rate FC𝐹 = 0, FCCR FC𝐹 = 0, FCCR FC𝐹 = 1, FCCR FC𝐹 = 1, FCCR FC𝐹 = 2, FCCR
=0 =1 =0 =1 =2
𝐹1 100% 100% 100% 100% 100%
𝐹2 100% 100% 100% 100% 100%
𝐹3 100% 0% 0% 0% 0%
𝐹4 100% 100% 100% 100% 100%
𝐹5 100% 100% 100% 100% 100%
𝐹6 100% 100% 100% 100% 98%
𝐹7 100% 100% 100% 100% 100%
𝐹8 100% 100% 100% 98% 100%
𝐹9 100% 100% 100% 100% 100%
𝐹10 100% 100% 98% 100% 100%
𝐹11 100% 100% 100% 100% 100%
𝐹12 100% 100% 100% 100% 100%
𝐹13 100% 100% 100% 100% 100%
𝐹14 100% 100% 100% 100% 100%
Table 8: The experiment result of comparison of various mathematical functions for utilizing success memories. GEN 𝐹1 𝐹2 𝐹3 𝐹4 𝐹5 𝐹6 𝐹7 𝐹8 𝐹9 𝐹10 𝐹11 𝐹12 𝐹13 𝐹14
1500 2000 5000 1500 3000 9000 5000 1500 2000 1500 1500 3000 1000 3000
Arithmetic mean Mean Std 5.0E − 36 9.4E − 36 2.4E − 30 1.6E − 30 2.9E − 12 1.1E − 12 0.0𝐸 + 00 0.0𝐸 + 00 3.0E − 03 6.9E − 04 −12569.5 7.3E − 12 0.0𝐸 + 00 0.0𝐸 + 00 3.3E − 15 7.0E − 16 0.0E + 00 0.0E + 00 1.6E − 32 5.5E − 48 1.3E − 32 1.1E − 47 6.1E − 22 5.0E − 22 5.0E − 20 3.4E − 20 3.5E − 22 2.5E − 22
Median Mean Std 2.9𝐸 − 27 4.0𝐸 − 27 5.5𝐸 − 23 4.4𝐸 − 23 2.1𝐸 + 00 2.5𝐸 + 00 0.0𝐸 + 00 0.0𝐸 + 00 4.6𝐸 − 03 1.2𝐸 − 03 −12569.5 7.3E − 12 0.0𝐸 + 00 0.0𝐸 + 00 3.0𝐸 − 14 8.4𝐸 − 15 0.0𝐸 + 00 0.0𝐸 + 00 4.8𝐸 − 29 4.1𝐸 − 29 8.0𝐸 − 28 1.1𝐸 − 27 1.1𝐸 − 16 9.2𝐸 − 17 2.3𝐸 − 15 8.7𝐸 − 16 1.5𝐸 − 15 1.8𝐸 − 15
algorithm outperformed all multimodal problems. The second best algorithm is jDE. Although SaDE utilizes strategy adaptation as well as parameter adaptation, jDE shows better results than SaDE in all benchmark functions. It means that parameter adaptation is more important to improve the performance of DE. MDE shows better performance than DE/rand/1/bin in several unimodal and multimodal problems. Table 3 shows the success rate of comparison results. The success rate is obtained by a mount of successful counter divided by a mount of experiment runs (50). The proposed algorithm and two adaptive DE algorithms (jDE and SaDE) show perfect success rates. However, DE/rand/1/bin and MDE show lower success rate than the proposed algorithm and they totally failed to find global optimum in several benchmark functions. Figure 2 shows the average best graphs of adaptive Cauchy DE and the compared DE algorithms. 5.4. Comparison of Adaptive Cauchy DE and FEP and CEP. The mean deviation and the standard deviation of experiment results obtained by adaptive Cauchy DE, DE/rand/1/bin, FEP (Fast Evolutionary Programming), and CEP (Classic Evolutionary Programming) for 𝐹1 –𝐹11 for 𝐷 = 30 are summarized in Table 4. The results of FEP and CEP are taken from [13, Tables 2-4].
Best individual Mean Std 2.4𝐸 − 31 8.2𝐸 − 31 8.1𝐸 − 28 2.4𝐸 − 27 8.1𝐸 + 00 7.5𝐸 + 00 0.0𝐸 + 00 0.0𝐸 + 00 4.1𝐸 − 03 1.4𝐸 − 03 −12569.5 7.3E − 12 0.0𝐸 + 00 0.0𝐸 + 00 7.4𝐸 − 15 2.7𝐸 − 14 3.5𝐸 − 04 1.7𝐸 − 03 5.0𝐸 + 00 3.5𝐸 + 01 1.1𝐸 − 02 7.5𝐸 − 02 4.1𝐸 + 03 2.7𝐸 + 04 1.3𝐸 − 02 3.5𝐸 − 02 2.3𝐸 − 01 5.3𝐸 − 01
Itself Mean 4.2𝐸 − 19 2.9𝐸 − 16 4.7𝐸 − 04 0.0𝐸 + 00 4.4𝐸 − 03 −12567.1 0.0𝐸 + 00 1.7𝐸 − 10 3.9𝐸 − 04 1.2𝐸 − 20 1.4𝐸 − 19 4.0𝐸 − 11 1.2𝐸 − 10 1.1𝐸 − 09
Std 2.5𝐸 − 19 1.2𝐸 − 16 3.3𝐸 − 03 0.0𝐸 + 00 1.1𝐸 − 03 1.7𝐸 + 01 0.0𝐸 + 00 6.7𝐸 − 11 2.0𝐸 − 03 1.2𝐸 − 20 1.2𝐸 − 19 2.8𝐸 − 11 5.1𝐸 − 11 6.6𝐸 − 10
The proposed algorithm shows better performance on solving all benchmark functions than DE/rand/1/bin, FEP, and CEP. The second best algorithm is DE/rand/1/bin. However, DE/rand/1/bin shows lower performance than FEP in several benchmark functions (𝐹6 and 𝐹7 ). 5.5. Comparison of Adaptive Cauchy DE and Adaptive LEP and Best L´evy. The mean deviation and the standard deviation of experiment results obtained by adaptive Cauchy DE, DE/rand/1/bin, adaptive LEP, and best L´evy for 𝐹1 and 𝐹6 –𝐹11 for 𝐷 = 30 are summarized in Table 5. The results of adaptive LEP and best L´evy are taken from [18, Table 3]. The population size NP is fixed by 100 in all experiments. The maximum number of generations is assigned by 1500 for all benchmark functions. The proposed algorithm shows better performance on solving all benchmark functions than DE/rand/1/bin, FEP, and CEP. The second best algorithm is DE/rand/1/bin again. However, DE/rand/1/bin shows lower performance than adaptive LEP and best L´evy in several benchmark functions (𝐹6 and 𝐹7 ). 5.6. Parameter Study. Tables 6 and 7 show that various failure counter experiment results. The goal of this experiments is finding appropriate moments of parameter adaptation. FC𝐹 = 𝑛 means if an individual fails to evolve itself consequently 𝑛
10
The Scientific World Journal Table 9: The success rate of comparison of various mathematical functions for utilizing success memories. 𝐹1 100% 100% 100% 100%
𝐹2 100% 100% 100% 100%
𝐹3 100% 0% 0% 90%
𝐹4 100% 100% 100% 100%
𝐹5 100% 100% 100% 100%
𝐹6 100% 100% 100% 98%
𝐹7 100% 100% 100% 100%
15
4
10
2
0 −5 −10 −15 −20
𝐹9 100% 100% 96% 96%
𝐹10 100% 100% 90% 100%
200
1000
1800
𝐹13 100% 100% 74% 100%
𝐹14 100% 100% 82% 100%
2600 3400 Generation
4200
5000
4200
5000
−6 −8 −10 −12 −14
80
400
720
1040 1360 Generation
1680
−16
2000
(a) Test function 𝐹2
(b) Test function 𝐹3
2.5 2 1.5 1 0.5 0
4
2 Fitness (average best) log
Fitness (average best) log
𝐹12 100% 100% 92% 100%
−4
−30
−0.5 −1 −1.5 −2 −2.5 −3
𝐹11 100% 100% 96% 100%
−2
−25 −35
𝐹8 100% 100% 100% 100%
0
5
Fitness (average best) log
Fitness (average best) log
Success rate Arithmetic mean Median Best individual Itself
0 −2 −4 −6 −8 −10 −12
120
600
1080
1560 2040 Generation
Adaptive Cauchy DE SaDE jDE
2520
3000
DE/rand/1/bin MDE
(c) Test function 𝐹5
−14
200
1000
1800
2600 3400 Generation
Adaptive Cauchy DE SaDE jDE
DE/rand/1/bin MDE
(d) Test function 𝐹7
Figure 2: Average best graphs of Adaptive Cauchy DE with the compared DE algorithms.
times, the scaling factor of individual is adapted. Similarly, FCCR = 𝑛 means if an individual fails to evolve itself consequently 𝑛 times, the crossover rate of individual is adapted. For example, if FC𝐹 = 1 and FCCR = 0, then an individual’s scaling factor is adapted when the individual fails to evolve itself, the last selection operation and the crossover of individual aer adapted in every generation. The results show that adapting control parameters FC𝐹 = 0 with FCCR = 0 and FC𝐹 = 1 with FCCR = 0 had good performance in the comparison. However, when comparing success rate, FC𝐹 = 0 with FCCR = 0 had higher success rate than FC𝐹 = 1 with FCCR = 0 in 𝐹3 benchmark function.
Note that when failure counter is increasing, the performance of algorithm decreased. Therefore, parameter adaptation should be performed in every generation. This is because the individuals of DE are evolved for exploring new regions. Therefore, it is hard to assure that the previous suitable control parameter values are still suitable until satisfying some probabilities or during some periods. Tables 8 and 9 show the various parameter adaptation method experiment results. The goal of these experiments is finding proper method of utilizing 𝐹 Memory and CR Memory for parameter adaptation. Arithmetic mean indicates that the proposed algorithm utilized arithmetic
The Scientific World Journal
11
Table 10: The experiment result of comparison of Cauchy distribution with Gaussian distribution for parameter adaptation. GEN 𝐹1 𝐹2 𝐹3 𝐹4 𝐹5 𝐹6 𝐹7 𝐹8 𝐹9 𝐹10 𝐹11 𝐹12 𝐹13 𝐹14
1500 2000 5000 1500 3000 9000 5000 1500 2000 1500 1500 3000 1000 3000
Cauchy 𝛾 = 0.1 Mean Std 5.0E − 36 9.4E − 36 2.4E − 30 1.6E − 30 2.9E − 12 1.1E − 12 0.0𝐸 + 00 0.0𝐸 + 00 3.0E − 03 6.9E − 04 −12569.5 7.3𝐸 − 12 0.0𝐸 + 00 0.0𝐸 + 00 3.3E − 15 7.0E − 16 0.0E + 00 0.0E + 00 1.6E − 32 5.5E − 48 1.3E − 32 1.1E − 47 6.1E − 22 5.0E − 22 5.0E − 20 3.4E − 20 3.5E − 22 2.5E − 22
Cauchy 𝛾 = 0.3 Mean Std 1.6𝐸 − 28 1.2𝐸 − 28 3.1𝐸 − 24 1.3𝐸 − 24 1.3𝐸 − 02 6.7𝐸 − 02 0.0𝐸 + 00 0.0𝐸 + 00 4.0𝐸 − 03 1.3𝐸 − 03 −12569.5 7.3𝐸 − 12 0.0𝐸 + 00 0.0𝐸 + 00 8.7𝐸 − 15 2.7𝐸 − 15 2.0𝐸 − 04 1.4𝐸 − 03 6.2𝐸 − 30 4.9𝐸 − 30 1.0𝐸 − 28 9.4𝐸 − 29 3.7𝐸 − 17 2.9𝐸 − 17 2.7𝐸 − 16 1.1𝐸 − 16 4.4𝐸 − 17 6.6𝐸 − 17
Gaussian Std = 0.1 Mean Std 2.8𝐸 − 32 3.4𝐸 − 32 1.9𝐸 − 27 2.1𝐸 − 27 1.3𝐸 − 01 5.6𝐸 − 01 0.0𝐸 + 00 0.0𝐸 + 00 3.4𝐸 − 03 1.6𝐸 − 03 −12569.5 7.3𝐸 − 12 0.0𝐸 + 00 0.0𝐸 + 00 4.2𝐸 − 15 1.6𝐸 − 15 0.0E + 00 0.0E + 00 1.9𝐸 − 32 6.7𝐸 − 33 6.0𝐸 − 32 7.6𝐸 − 32 1.5𝐸 − 19 2.1𝐸 − 19 1.6𝐸 − 17 8.0𝐸 − 18 2.1𝐸 − 19 2.4𝐸 − 19
Gaussian Std = 0.3 Mean Std 2.8𝐸 − 30 2.8𝐸 − 30 7.4𝐸 − 26 4.7𝐸 − 26 5.3𝐸 − 12 9.0𝐸 − 12 0.0𝐸 + 00 0.0𝐸 + 00 3.1𝐸 − 03 8.4𝐸 − 04 −12569.5 7.3𝐸 − 12 0.0𝐸 + 00 0.0𝐸 + 00 6.3𝐸 − 15 1.1𝐸 − 15 0.0E + 00 0.0E + 00 2.9𝐸 − 31 1.9𝐸 − 31 2.3𝐸 − 30 2.8𝐸 − 30 3.5𝐸 − 18 2.6𝐸 − 18 6.7𝐸 − 17 2.8𝐸 − 17 2.9𝐸 − 18 2.5𝐸 − 18
Table 11: The success rate of comparison Cauchy distribution with Gaussian distribution for parameter adaptation. Success rate Cauchy 𝛾 = 0.1 Cauchy 𝛾 = 0.3 Gaussian Std = 0.1 Gaussian Std = 0.3
𝐹1 100% 100% 100% 100%
𝐹2 100% 100% 100% 100%
𝐹3 100% 78% 72% 100%
𝐹4 100% 100% 100% 100%
𝐹5 100% 100% 98% 100%
𝐹6 100% 100% 100% 100%
mean function to extract mean values from 𝐹 Memory and CR Memory and each individual’s control parameter values are adapted based on the mean values as location parameters of the Cauchy distribution for parameter adaptation. Similarly, median indicates that the proposed algorithm utilized median function to extract median values from 𝐹 Memory and CR Memory and each individual’s control parameter values are adapted based on the median values as location parameters of the Cauchy distribution for parameter adaptation. Best individual indicates that each individual’s control parameter values are adapted based on the best individual’s control parameter values as location parameter of the Cauchy distribution. Finally, itself indicates that each individual’s control parameter values are adapted based on its own control parameter values as location parameter of the Cauchy distribution. The results show that adapting control parameters based on arithmetic mean function had good performance than median function. This is because the outliers give us the information about a new possibility of better control parameter values. Therefore, the arithmetic mean function is more applicable than median function. Parameter adaptation based on its own control parameter values shows good success rate in the comparison. However, the performance was lower than that of other methods. Parameter adaptation based on best individual’s control parameter values shows good performance in only unimodal problems. Tables 10 and 11 show the comparison results of the Cauchy distribution with the Gaussian distribution for
𝐹7 100% 100% 100% 100%
𝐹8 100% 100% 100% 100%
𝐹9 100% 98% 100% 100%
𝐹10 100% 100% 100% 100%
𝐹11 100% 100% 100% 100%
𝐹12 100% 100% 100% 100%
𝐹13 100% 100% 100% 100%
𝐹14 100% 100% 100% 100%
parameter adapation method. The goal of these experiments is finding which distribution property (short or long tail) is more suitable for parameter adaptation. Cauchy 𝛾 = 0.1 indicates that parameter adaptation is performed based on the Cauchy distribution and the scaling parameter of distribution is assigned 0.1. Gaussian Std = 0.1 indicates that parameter adaptation is performed based on the Gaussian distribution and the standard deviation parameter of distribution is assigned 0.1. The experiment results show that the Cauchy distribution with 𝛾 = 0.1 had good performance than others. This is because, the Cauchy distribution generates the large step from the peak location with higher probability. Therefore, the control parameters of each individual are assigned either near the average parameter value or far from that of the average parameter value which might be the better parameter value of the next generation.
6. Conclusion The parameters of DE should be adequately assigned to attain better performance. But finding suitable values demands a lot of computational resources. In this sense, we present a new DE algorithm which utilizes success memories of scaling factors and crossover rates to properly adjust the control parameters of DE; the control parameters are adapted at each generation based on the Cauchy distribution with mean values of success memories. Experimental results showed that the adaptive Cauchy DE algorithm generally achieves
12 better performance than existing DE variants on various multimodal and unimodal test problems. The results also supported the claim that a long tail distribution is more reliable than a short tail distribution in adjusting the control parameters.
Acknowledgments This work was supported by the National Research Foundation of Korea (NRF) Grant funded by the Korea government (MSIP) (no. 2012-013-735). This work was also supported by the DGIST R&D Program of the Ministry of Education, Science and Technology of Korea (13-BD-01).
References [1] R. Storn and K. Price, “Differential evolution—a simple and efficient heuristic for global optimization over continuous spaces,” Journal of Global Optimization, vol. 11, no. 4, pp. 341– 359, 1997. [2] R. Gamperle, S. D. Muller, and P. Koumoutsakos, “A parameter study for differential evolution,” in Proceedings of the International Conference on Advances in Intelligent Systems, Fuzzy Systems, Evolutionary Computation (WSEAS ’02), pp. 293–298, 2002. [3] J. Zhang and A. C. Sanderson, “An approximate Gaussian model of differential evolution with spherical fitness functions,” in Proceedings of the IEEE Congress on Evolutionary Computation (CEC ’07), pp. 2220–2228, September 2007. [4] J. Brest, S. Greiner, B. Boˇskovi´c, M. Mernik, and V. Zumer, “Self-adapting control parameters in differential evolution: a comparative study on numerical benchmark problems,” IEEE Transactions on Evolutionary Computation, vol. 10, no. 6, pp. 646–657, 2006. ´ E. Eiben, R. Hinterding, and Z. Michalewicz, “Parameter [5] A. control in evolutionary algorithms,” IEEE Transactions on Evolutionary Computation, vol. 3, no. 2, pp. 124–141, 1999. [6] A. E. Eiben and J. E. Smith, Introduction to Evolutionary Computing, Springer, Berlin, Germany, 2003. [7] A. K. Qin and P. N. Suganthan, “Self-adaptive differential evolution algorithm for numerical optimization,” in Proceedings of the IEEE Congress on Evolutionary Computation (CEC ’05), vol. 2, pp. 1785–1791, September 2005. ˇ [8] J. Brest, B. Boˇskov´c, S. Greiner, V. Zumer, and M. S. Mauˇcec, “Performance comparison of self-adaptive and adaptive differential evolution algorithms,” Soft Computing, vol. 11, no. 7, pp. 617–629, 2007. [9] M. Ali and M. Pant, “Improving the performance of differential evolution algorithm using Cauchy mutation,” Soft Computing, vol. 15, no. 5, pp. 991–1007, 2011. [10] J. Teo, “Exploring dynamic self-adaptive populations in differential evolution,” Soft Computing, vol. 10, no. 8, pp. 673–686, 2006. [11] H. A. Abbass, “The self-adaptive Pareto differential evolution algorithm,” in Proceedings of the Congress on Evolutionary Computation (CEC ’02), pp. 831–836, May 2002. [12] J. Zhang and A. C. Sanderson, “JADE: adaptive differential evolution with optional external archive,” IEEE Transactions on Evolutionary Computation, vol. 13, no. 5, pp. 945–958, 2009.
The Scientific World Journal [13] J. Zhang and A. C. Sanderson, Adaptive Differential Evolution: A Robust Approach to Multimodal Problem Optimization, Springer, Berlin, Germany, 2009. [14] X. Yao, Y. Liu, and G. Lin, “Evolutionary programming made faster,” IEEE Transactions on Evolutionary Computation, vol. 3, no. 2, pp. 82–102, 1999. [15] X. Yao, Y. Liu, K. H. Liang, and G. Lin, “Fast evolutionary algorithms,” in Advances in Evolutionary Computing, pp. 45–94, Springer, New York, NY, USA, 2003. [16] E. Mezura-Montes, J. Vel´azquez-Reyes, and C. A. Coello Coello, “A comparative study of differential evolution variants for global optimization,” in Proceedings of the 8th Annual Genetic and Evolutionary Computation Conference (GECCO ’06), pp. 485– 492, July 2006. [17] J. Vesterstrøm and R. Thomsen, “A comparative study of differential evolution, particle swarm optimization, and evolutionary algorithms on numerical benchmark problems,” in Proceedings of the Congress on Evolutionary Computation (CEC ’04), vol. 2, pp. 1980–1987, June 2004. [18] E. Cuevas, D. Zaldivar, and M. P´erez-Cisneros, “A novel multi-threshold segmentation approach based on differential evolution optimization,” Expert Systems with Applications, vol. 37, no. 7, pp. 5265–5271, 2010.