Computación y Sistemas Vol. 9 Núm. 2, pp. 093-103 © 2005, CIC-IPN, ISSN 1405-5546, Impreso en México
Segmentation of Blood Vessels Based on a Threshold that Combines Statistical and Scale Space Filters Segmentación de Vasos Sanguíneos Basada en un Umbral que Combina Filtros Espaciales Estadísticos Roberto Rodríguez Institute of Cybernetics, Mathematics and Physics (ICIMAF) Digital Signal Processing Group Calle 15 no. 551 e/ C y D, CP 10 400, Ciudad de la Habana, CUBA
[email protected] Article received on October 25, 2004; accepted on July 07, 2005
Abstract This paper presents a strategy for segmenting blood vessels based on the threshold, which-combines statistic and scale space filter. By incorporating statistical information, the strategy is capable of reducing over-segmentation. We propose a three stage strategy which involves: (1) optimal selection of window size; (2) optimal selection of scale and (3) segmentation process. We compared our strategy to two commonly used thresholding techniques. Experimental results showed that our method is much more robust and accurate. Our strategy suggested a modification to Otsu's method. In this application the important information to be extracted from images is only the number of blood vessels present in the images. The proposed strategy was tested on manual segmentation, where segmentation errors less than 3% for false positives and 0% for false negatives are observed. The work presented in this paper is a part of a global image analysis process. Therefore, these images will be subject to a further morphometrical analysis in order to diagnose and predict automatically malign tumors. Keywords: Thresholding method, Scale-space filter, Image segmentation, Angiogenesis process. Resumen Este artículo presenta una estrategia para la segmentación de vasos sanguíneos basada en el umbral, la cual combina estadística y filtro de espacio escala. Al incorporar información estadística la estrategia es capaz de reducir la sobre segmentación. Nosotros proponemos una estrategia consistente de tres estados, la cual involucra: (1) selección óptima del tamaño de ventana; (2) óptima selección de la escala y (3) el proceso de segmentación. Nuestra estrategia es comparada con dos técnicas comúnmente muy usadas las cuales hacen uso del umbral. Los resultados experimentales mostraron que nuestro método es mucho más robusto y exacto. Nuestra estrategia sugirió una modificación al método de Otsu. En esta aplicación la información importante a extraer de las imágenes es solamente el número de vasos sanguíneos presentes en ellas. Los resultados de la estrategia propuesta fueron comparados con aquellos obtenidos a través de la segmentación manual, donde el error de segmentación para los falsos positivos fue menor que el 3% y para los falsos negativos fue del 0%. El trabajo presentado en este artículo es parte de un proceso global de análisis de imágenes. Por tanto, estas imágenes serán sujetas a un adicional análisis morfométrico para diagnósticar y pronósticar automáticamente tumores malignos. Palabras Clave: Método a través del umbral, Filtro espacio escala, Segmentación de imágenes, Proceso de angiogénesis
1 Introduction In many image processing tasks, segmentation is a fundamental building block for high level image analysis process. It allows quantification and visualization of the objects of interest. However, segmentation of biomedical images is a difficult work due to their low signal to noise ratio and poor contrast [1]. Nevertheless, efforts towards the solution of the segmentation problem are motivated by the variety of applications wherein segmentation plays a crucial role [2]. 93
Roberto Rodríguez
Various techniques for image segmentation have been developed so far [1, 2, 3, 4, 5], among them, segmentation via threshold [6]. Threshold is computationally simpler than other segmentation techniques, such as boundary detection, region split-and-merge, segmentation via mathematical morphology or deformable contour techniques. It is therefore attractive for applications in which the computation time is a constraint. Thresholding methods can be classified as either global or local. Global methods use a single threshold level for the entire image. This approach is not suitable if a feature varies across the background of the image. For instance, if the average intensity level were to vary across the background due to uneven illumination, as commonly occurs in video microscopy, a global approach would not provide adequate results. Local thresholding methods develop a threshold surface, which allows a different threshold value to be applied at each pixel. This approach is effective if the feature varies across the background of the image, since the threshold surface can adapt to the variations. Threshold surfaces can be determined from the thresholds derived from those subregions which are thought to contain both background and objects. Practical problems occur, however, when the histogram is not bimodal and both object and background assume some broad range of gray levels [7, 8]. Therefore, local thresholding methods are often considered to segment images with unimodal histograms. This is precisely our case, because our images present poor contrast and low signal-to-noise ratio. It is generally thought that thresholding techniques are restricted to relative simple structures and also are hindered by image artifacts [3, 6]. However, this paper presents a multistage segmentation strategy using two image features associated with blood vessels, namely, intensity level and local variation of intensity. The technique was developed in response to the specific problems encountered in tissues from biopsies. In the first step of our approach, we carry out an optimal selection of window size. In the second stage, an optimal selection of scale space is obtained. Finally, we carry out the segmentation process based on the threshold. In order to obtain this goal we proposed a modification to Otsu’s method [9]. The representation of an image at multiple scales is not a new concept [2, 10]. The central idea is that important signal features persist at relatively coarse scales, even though their location may be distorted by the filtering process. Scale space filtering provides a way to associate image descriptions across multiple scales. The general concept of scale space refers to an image representation at a continuum of scales, embedding the image f into a family Tf | t ≥ 0 of gradually simplified versions, provided that it fulfils certain requirements. These requirements can be categorised as architectural, information reducing and invariance preserving. Therefore, there are two aspects that make a multiscale representation attractive. The first is the explicit representation of the multiscale aspect of real world images. The second is the simplification of further processing by removing unnecessary and disturbing details. More technically, the latter motivation for using a multiscale representation also reflects the common need for smoothing as a pre-processing step to many numerical algorithms as a means of noise suppression. The angiogenesis process is an important aspect of histopathological research [11, 12, 13, 14, 15]. This process is studied by anatomical pathologists and is characterised by formation of new blood vessels in the tissue, which increases its growth rate. Angiogenesis is a normal process that occurs in all tissues, but it is known that, in pathological cases, the increase of blood vessels is abnormal. For example, in mammary, prostate, bladder, and brain cancers, the greater the number of blood vessels, the more developed the disease. In the study of the angiogenesis process pathologists analyse, by using a microscope, all information related to the blood vessels. This work is very tedious and time consuming, and obviously automating the analysis is highly desirable. In this sense, a useful task for digital image processing would be the segmentation of blood vessel. The rest of paper is organized as follows: In Section 2 the materials and methods are given. Section 3 outlines the theoretical aspects. In this section our modification to Otsu's method are described too. Section 4 contains the experimental results. A discussion is presented as well, and we describe our conclusions in Section 5.
2 Materials and Methods 2.1 Medical Methodology Studied images are biopsies, which represent an angiogenesis process in malignant tumors. These were included in paraffin by using the immunohistochemical technique with the complex method of avidina biotina. Finally, monoclonal CD34 was contrasted with green methyl to accentuate formation of new blood vessels. These biopsies were obtained from soft parts of human bodies. This analysis was carried out for more than 80 patients. 94
Segmentation of Blood Vessels Based on a Threshold that Combines Statistical and Scale Space Filters
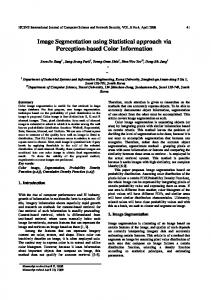
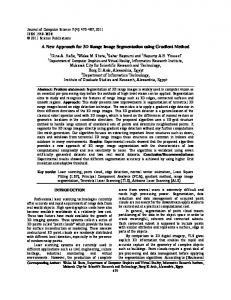
2.2 Characteristics of the Images in the Study Fig. 1 shows typical images, which were captured via the MADIP system with a resolution of 512x512x8 bit/pixels [19]. In Fig. 2 a horizontal profile can be observed through the centre of a vessel; this is a plot of the pixel intensities along a single row.
(a)
(b)
Fig. 1. Characteristic of blood vessels. (a) Original image; (b) Histogram image.
(a )
(b )
Fig. 2. An intensity profile through the centre of a vessel. The profile is indicated by a line.
There are several notable characteristics of this image, which are common to typical images that we encounter in biopsy tissue: 1. The intensity is slightly darker within the blood vessel than in the local surrounding background. It is emphasized that this observation holds only within the local surroundings. 2. High local variation of intensity is observed both within the blood vessel and the background. However, the local variation of intensity is higher within the blood vessel than in background regions (see Fig. 2) 3. Variability of blood vessels, both in size and shape, can be observed (see Fig. 1). 4. The contrast of intensities between the blood vessel (BV) and the background is low. This is evident from the intensity histogram (see Fig. 1 (b)). This histogram is uni-modal, reflecting the low separation in average intensity of the BV and background. Due to the acquisition protocol, the images are corrupted by a large amount of noise. One can observe the ripples in the histogram in Fig. 1(b). Across the entire image, changes in intensity level cannot reliably distinguish blood vessels, due to possible nonuniformity of the average background intensity and the low contrast between blood vessels and background. However, within a region of the image, changes in intensity level can effectively distinguish a blood vessel, since locally a blood vessel is darker than its surrounding background.
95
Roberto Rodríguez
2.3 Evaluation Method Manual segmentation generally gives the best and most reliable results when identifying structures for a particular clinical task. However, this task is very tedious and time-consuming for the segmenter, and thus it does not serve the needs of daily clinical use well. Up to now and due to the lack of ground truth, the quantitative evaluation of a segmentation method is difficult to achieve. An alternative is to use manual-segmentation results as the ground truth. In this work the important information to be extracted from images is only the number of blood vessels. For now, the dimension of blood vessels is not important. For this reason, in order to evaluate the performance of the proposed strategy, we calculated the percent of false negatives (FN, blood vessels, which are not found by the strategy) and the false positives (FP, noise, which is classified as blood vessels). These are defined according to the following expressions,
fp *100 , Vp + f p fn FN = *100 , V p + fn FP =
(1)
where Vp is the actual number quantity of blood vessels identified by the physician, fn being the quantity of blood vessels, which are not marked by the strategy and fp being the number of spurious regions, which are marked as blood vessels.
3 Theoretical Aspects 3.1 On Otsu's Method This method is based on discriminant analysis. The method separates pixels into two classes C0 and C1 (objects and background or vice versa) by a threshold at level t. C0 denotes pixels with levels {0, 1, 2, ........., t}, and C1 denotes pixels with levels {t+1, t+2, ......., L-1}, L being the number of gray levels. Let σ b2 and σ 2d be the between-class variance and the within-class variance, respectively. An optimal threshold can be obtained by maximizing the separability of the histogram, that is, the ratio of the between-class variance and the within-class variance with respect to t,
η(t) = The complete expressions for σ
2 b
and σ
2 d
σ b2 σ 2d
(2)
can be found in [9]. This approach is better than many popular
thresholding methods. In particular, it performs well in situations where there is little contrast between background and object, that is, in cases where a histogram can be modelled by two overlapping Gaussian curves with little separation between the two modes [17]. However, this method is very sensitive to noise and in this case it produces a biased threshold. As our images have a lot of noise, we introduced a variation to Otsu's method, which will be detailed later. 3.2 On Sharon's Method This method is based on the analysis of the standard deviation in the image. The inputs are the original image, the average and standard deviation for some background patch in the image, and a grid size. The thresholding proceeds as follows: given a grid size N, the input image is divided into NxN windows. For each NxN window, the statistics (average and standard deviation of gray scale) within are calculated. If the standard deviation within the window is smaller than the standard deviation of some background patch (input by the user), then there is no object within that window. If the standard deviation within the window is greater than the standard deviation of the grayscale within that window, the gray scale levels within the window are thresholded [17]. The formula used for calculating this threshold is, 96
Segmentation of Blood Vessels Based on a Threshold that Combines Statistical and Scale Space Filters
if St.Dev. window ≥ St.Dev. noise, then Threshold window = Ave. window - St.Dev. noise / 2
(3)
where St.Dev. noise is the standard deviation of the background patch. Sharon's method works well if the image contains little noise, but is very sensitive to noise. For that reason, we introduced, in the work mentioned above, a modification to this method [7]. In addition, Sharon's method has the drawback that is necessary to select the background to compute the variance; therefore, the final result is depending on this selection.
3.3 Gaussian Scale Space The central idea of linear multiscale filtering is that important image features persist at relatively coarse scales, even though their location may be distorted by the filtering process. This leads to the family of Gaussian functions as the unique filter for scale-space blurring. It has been shown that the normalized Gaussian g σ ( x ) is the only filter kernel which satisfies the following conditions,
gσ ( x ) =
1
(2 π σ 2 ) d
2
exp ( -
x.x 2 σ2
)
(4)
Here x.x is the scalar product of two vectors and d denotes the dimension of the domain. The extent of blurring or spatial averaging is defined by the standard deviation σ of the Gaussian which represents the "scale" parameter. The blurring process must essentially satisfy a set of the following fundamental hypotheses. Convolution Kernel: There exists a family of functions k t : ℜ Æ ℜ | t ≥ 0 such that
( T f) (x) = ∫ k (x - x´)f(x´) dx´ t t ℜ
(5)
N
The assumption that the filter is a convolution integral implies linearity and translation invariance [2], at least, in the patch where the convolution is applied [18]. Semigroup property:
T t + s f = T t ( T s f ), ∀ t, s ≥ 0, ∀ f
(6)
This property ensures that one can implement the scale-space process as a cascade smoothing which resembles certain processes of the human visual system [2]. Flat kernel for t Æ ∞ For t Æ ∞, one expects that the kernel spreads the information uniformly over the image. Therefore, if the integral over the kernel should remain finite, it follows that the kernel has to become entirely flat,
lim k t ( x ) = 0
t →∞
97
(7)
Roberto Rodríguez
3.4 Our Proposed Approach The histogram evidenced low contrast for our images [see Fig. 1(b)]. Thus, we computed the standard deviation (SD) at each area, where SD =
2
β and β
2
(i, j ) =
1
j +M
i+M
∑
2 W k =i − M
∑
l = j −M
[ f (k, l ) − µ(i, j )]2
(8)
where f ( k, l ) is the grey level intensity at pixel ( k, l ), W is an integer denoting the width of the mask, M = (W-1)/2 and µ ( i, j) is the mean intensity within the mask, computed as:
µ(i, j ) =
1 W
2
i+M
j +M
k =i − M
l = j −M
⋅ ∑
∑
f (k,l )
(9)
We used a fast algorithm for computing the variance, as was described in [15]. Taking into account the features of our images, we proposed subtracting from the threshold obtained by Otsu’s method the standard deviation (SD) at each area, Threshold area = Threshold Otsu - SD area
(10)
where Threshold area is our threshold now. The way of obtaining expression (10) was completely empiric. Nevertheless, it is possible to insure that the nonstationary standard deviation can be used to characterize the high frequencies [18]. Therefore, our approach should have best performance in images where there is a lot of noise. This will be shown in the section on experimental results.
4 Experimental Results 4.1 Linear (Gaussian) Scale-Space
The main motivation of this section is the simplification of the process which occurs during the creation of a scale space. Successive filtering eliminates not only noise but also reduces detail of the image without considering local image features. In this work was not used other filter (for example, median filter) because the noise is additive, it is demonstrated that Gaussian filter is best than median filter for this type of noise [3, 8]. We, firstly, carried out experiments for finding an optimal scale. As mentioned in [20], in every imaging situation one has to face the problem of scale. It is very important to point out that nowadays, it has been not found yet a method which permits to obtain numerically this parameter, because it depend on images [2, 10, 21]. Fig. 3 illustrates the effects for different sizes of the σ parameter. From this example it can clearly be seen how the level of detail in the image decreases as the level of blurring increases and how the major structures are retained.
98
Segmentation of Blood Vessels Based on a Threshold that Combines Statistical and Scale Space Filters
(a)
(b)
(c)
(d)
Fig. 3. A blood vessel image at different scales: (a) σ = 0.5, (b) σ = 2, (c) σ =7, (d) σ = 11.
We verified that for large values of sigma (σ) the smoothing was high and therefore it was considered poor by the following: on the one hand, homogeneous areas arose in the filtered image; on the other hand, some of the real blood vessels were lost. It is known that Gaussian scale space presents some drawbacks [2, 21]. In fact, Gaussian smoothing cannot take into account any a priori information on structures which are worth being preserved or enhanced and linear diffusion filtering dislocated edges when moving from finer to coarser scales. Occasionally (for σ Æ ∞), it also produces bad results in other processing stages due to an annihilation of the regional minima. In Figure 3, one can observe that for parameters (σ ) greater than 1.0 many blood vessels were very blurred. This was the reason why we decided to carry out our experiments with the parameter equal to 0.5. 4.2 Selection of Window Size The other step in our research was to determine the optimal window size for the segmentation process. Thus, we subdivided the image into contiguous areas of equal size. The sensitivity of the method to variations in the window size was evaluated by examining the effect of window size on blood vessels segmentation. This strategy allowed us to obtain an optimum threshold for each area. We carried out the variation in the window sizes that are identified as the mask size increases from 16x8 to 256x128, while Fig. 4 plots the intensity threshold that would be computed at the different regions. Changing the window size from 128x64 to 256x128 does not result in a change of intensity threshold. We tested that for small window sizes the method picks up smaller, finer structures (high variation), while it missed parts of larger objects, that is, some blood vessels were split. Therefore, we arrived to the final conclusion that the best performance is obtained, according to our application, with large window sizes (128x64 or 256x128). Thus, we selected as optimal a window size of 256x128.
T H R E S H
99 96 95 87 16
32
64
128
256
Fig. 4. Otsu’s threshold versus window size. It can be observed that Otsu’s threshold changes from 99 to 87.
99
Roberto Rodríguez
The x axis represents the window size: 16x8, 32x16, 64x32, 128x64 and 256x64.
4.3 Segmentation Process In this section we will describe the segmentation process. Firstly, we will discuss the influence of the parameter (σ) on the segmentation scheme, secondly, we will show the effect of the window size and finally, we will compare our approach with other segmentation methods. Fig. 5 shows, according to our approach, the segmented image from Fig. 3 at different scales: σ = 0.5; σ = 2; σ = 7; σ = 10.
(a)
(b)
(c)
(d)
Fig. 5. Segmented image from Fig. 3 at different scales (a) σ = 0.5, (b) σ = 2, (c) σ = 7, (d) σ = 11.
The sensitivity of the parameter can be evaluated by examining Fig. 5. Changing the parameter from 0.5 to 10 produces a dramatic loss of blood vessels. For example, on the one hand, black areas (see Fig. 5 (c)) arose in the segmented image, while on the other hand (see Fig. 5 (d)) many blood vessels were lost. Those effects were due to the process of Gaussian smoothing. The same performance was obtained for all images. In our work, however, it is very important to conserve the blood vessels. Now, we will show the influence of the window size on segmentation. Fig. 6 shows the obtained results for 16x8, 32x16, 64x32, 128x64 and 256x128. Segmentation was carried out for σ = 0.5. It is observed that changing the window size from 128x64 to 256x128 did not produce any dramatic variation in the result. However, the same did not happen when changing the window size from 16x8 to 64x32. In these cases, a lot of noise was introduced. We tested that for small windows the variance was much greater than for large windows. For example, for a window size of 16x8 the typical variance was 0.987, while for a window size of 128x64 the variance was 0.0078. These results indicated that intensity variance is a robust feature to identify different areas in the image. However, if we apply this strategy to the whole image the obtained results are poor, due to noise in the scene [7].
100
Segmentation of Blood Vessels Based on a Threshold that Combines Statistical and Scale Space Filters
(a)
(c)
(b)
(e)
(d)
Fig. 6. Segmented image from Fig. 3 (σ = 0.5) at different window sizes. (a) 16x8, (b) 32x16, (c) 64x32, (d) 128x64, (e) 256x128.
We decided to choose, according to the results in Fig. 6 and for taking advantage of the processing speed, the option of working with 256x128 window size. 4.4 Comparisons with other Methods In this section, we will compare our approach with other segmentation methods. Such comparison is necessarily incomplete, as a comprehensive comparison could only be done in a survey paper given the size of the literature. Instead, we selected two methods which are suitable for the kind of images used in our study. We also conduct another, more meaningful type of comparison, with manual segmentation. The results obtained with Otsu's and Sharon's methods and our approach are shown in Fig. 7. This segmentation was carried out for a 256x128 window size and σ = 0.5.
1(c)
2(c)
(b)
(a)
3(c)
Fig. 7. Segmented images, (original image, left part), (a) Otsu's method, (b) Sharon's method and (c) Our approach.
101
Roberto Rodríguez
The arrows indicate objects, which does not correspond to blood vessels.
We carried out the Sharon's method according to the modification reported in [7]. In these images it can be observed that Otsu's method introduced a lot of more noise than Sharon's method and our approach (see Fig. 7(a)). However, comparing Figs. 7(b) and 7(c) one can observe that our approach also performs better than Sharon's method. Table I shows the results of applying expression (1) to each method with respect to a manually segmented image (see Fig. 8(a)). 4.5 Verification of the Obtained Results Since much of the motivation for medical images segmentation is to automate all or part of the manual segmentation, it is perhaps more important to compare the results of our approach with those of manual segmentation. In order to evaluate the performance of the proposed strategy, the percent of false positives and false negatives was calculated between the result of segmentation and of the manual segmentation. Numerical results of the comparison, by using the expression (1), are summarized in Table I. Table I Numerical results of comparison. Method Otsu Sharon Our approach
Vp 79.8 79.8 79.8
fp 5 4 2.3
fn 0 0 0
FN 0% 0% 0%
FP 5.89% 4.77% 2.80%
Table I shows clearly that our approach has the best performance [3]. This statistical result indicates that the modification to Otsu’s method we introduced is an adequate procedure for blood vessels segmentation. In Table I also can be observed that the percent errors for false negatives were equal to 0 % for all cases; that is, all regions belonging to blood vessels were detected. We conducted approximately 45 experiments on different images and the same results were obtained. Nevertheless, in Fig. 7 (see arrows) can be observed, as the segmentation process is not completely correct. It can be seen, according to judgment of pathologists, as some of the false positives arose. The false positives may arise due to transition of illumination or these may be created by a problem in the preparation of the biopsies too. In practice, these problems are very difficult to be eliminated completely in real images. However, for all images our strategy produced less false positives. Therefore, the result from the full automatic segmentation steps is presented to the physicians for manual segmentation. With a few mouse clicks on the final result, the false positives are completely eliminated.
5 Conclusions We presented a three stage strategy for the blood vessels segmentation. The basic idea consists, firstly, in finding an optimal parameter for carrying out Gaussian smoothing; secondly, in obtaining an adequate window size; and finally, carrying out the segmentation process. In this final step we introduced a modification to Otsu’s method. We compared our strategy to two commonly used thresholding techniques, which were suitable for the kind of images used in our study. The experimental results demonstrated that our approach is fast and robust for the type of images considered. This work is a part of a global image analysis process in which these images will be subject to a further morphometrical analysis in order to diagnose and predict automatically malign tumors. Acknowledgements The authors would like to thank Dr. Roberto Wong from "Dr. Carlos J. Finlay" hospital, Cuba, for facilitating the test images and accepting this project. 102
Segmentation of Blood Vessels Based on a Threshold that Combines Statistical and Scale Space Filters
References 1. 2. 3. 4. 5. 6. 7. 8. 9. 10. 11. 12. 13. 14. 15. 16. 17. 18. 19. 20. 21.
Fu, K. S. ; and Mui, J. K., "A survey on image segmentation," Pattern Recognition, 13: 3-16 (1981). Pratikakis, I., “Watershed-driven image segmentation,” Ph.D thesis, (Vrije Universiteit Brussel, 1998). Sijbers, J. et al., “Watershed based segmentation of 3d MR Data for Volume Ouantization, ” Magnetic Resonance Imaging, 15(6) (1997) Lim, Young W.; and Lee,Sang U., “On the color image segmentation algorithm based on the thresholding and the fuzzy cmeans techniques,” Pattern Recognition, 21(9):935-952 (1990) Shareef, N. ; and Wang, D. L., "Segmentation of medical images using Legion," IEEE Trans. on Medical Imaging, 18 (1) (1999). Sahoo, P. K. et al., "A survey of thresholding techniques," Computer Vision, Graphics, and Image Processing, 41: 233-260 (1988). Rodríguez, Roberto M. et al., “Color segmentation applied to study of the angiogenesis Part I, “Journal of Intelligent and Robotic System, 34 (1): 83-97 (2002). Rodríguez, Roberto ; Teresa, E. A. ; and Ingrid, C. B., “A strategy for reduction of noise in segmented images. Its use in the study of angiogenesis,” Journal of Intelligent and Robotic System, 33 (1): 99-112 (2002). Otsu, N., "A threshold selection method from grey level histogram", IEEE Trans. Systems Man Cybernet, SMC-8: 62-66 (1978). Weickert, J. ; Ishikawa, S. ; and Imiya, A., "On the History of Gaussian Scale-Space Axiomatic", in Gaussian Scale-space theory,edited by J. Sporring et. al., (Netherlands: Kluwer Academic Publishers, 1997) 45-59. Boschner, B. H. et al., “Angiogenesis in bladder cancer: relationship between microvessel density and tumor prognosis,” J. Natl. Cancer Inst., 87, 21 (1): 1603-1612 (1995). Díaz-Flores, L. ; Gutiérrez, R. ; and Varela, H., “ Angiogenesis: an update,” Histol Histopath 9: 807-843 (1992). León, S. P. ; Folkerth, R. D. ; and Black, P. M., “ Microvessel density is a prognostic indicator for patients with astroglial brain tumors,” Cancer, 77, 2, (15): 362-372 (1996). Semple, J. P. ; Welch, W. R. ; and Folkman, J., “Tumor angiogenesis and metastasis - correlation in invasive breast carcinoma,” N. Engl. J. Med,. 324: 1-8 (1991). Weidner, N. et al., “Tumor angiogenesis correlates with metastasis in invasive prostate carcinoma,” American Journal of Pathology, 143 (2) (1993). Wu, K. ; Gauthier, D. ; and Levine, M. D., "Live Cell Image Segmentation," IEEE Transactions on Biomedical Engineering, 42 (1) (1995). Sharon, A. S., "ANGY: A rule-Based Expert System for Automatic Segmentation of Coronary Vessels From Digital Substrated Angiograms", IEEE Transactions on pattern Analysis and Machine Intelligence, PAMI 8 (2): 188-199 (1986). Rodríguez, Roberto M., “The interaction and heuristic knowledge in digital image restoration and enhancement. An intelligent system (SIPDI),” Ph.D. Thesis, (Havana: Institute of Technology, 1995). Rodríguez, R. ; Alarcón, T. ; and Sánchez, L., “MADIP: Morphometrical Analysis by Digital Image Processing,” Proceedings of the IX Spanish Symposium on Pattern Recognition and Image Analysis, (Spain, 2001), I: 291-298. ISBN 84-8021-349-3. Koenderink, J. J., "The structure of images," Biological Cybernetics, 50: 363-370 (1984). Lifshitz, L. M. ; and Pizer, S. M., "A multiresolution hierarchical approach to image segmentation based on intensity extreme," IEEE Transaction on Pattern Analysis and Machine Intelligence, 12 (6): 529-541 (1990).
Roberto Rodríguez M. Received his diploma in Physic from the Physics Faculty, Havana University in 1978 and the PhD. Degree in from Technical University of Havana, in 1995. Since 1998 he is the head of the Digital Signal Processing Group of the Institute of Cybernetics, Mathematics & Physics (ICIMAF). His research interests include Segmentation, Restoration, Mathematical Morphology, Visual pattern recognition, Analysis and Interpretation of images, Theoretical studies of Gaussian Scale-Space, New Lexis on Colour via Santana Method and Mean shift. He has published more than 40 articles in international journals and as many international conferences. 103