Apr 5, 2008 - The easiest way to express color is to extract and utilize color histogram. ..... M.S degrees in Electrical Engineering from Inha University, Korea, ...
IJCSNS International Journal of Computer Science and Network Security, VOL.8 No.4, April 2008
41
Image Segmentation using Statistical approach via Perception-based Color Information Seon-Do Kang† , Sang-Seong Park†, Young-Geun Shin†, Hun-Woo Yoo††, Dong-Sik Jang†
†
Department of Industrial Systems and Information Engineering, Korea University, Sungbuk-gu Anam-dong 5 Ga 1, Seoul 136-701, South Korea †† Department. of Computer Science, Yonsei University, 134 Shinchon-Dong, Seodaemun-Ku, Seoul 120-749, South Korea
Summary Color image segmentation is useful for fast retrieval in large image database. For that purpose, new image segmentation technique based on the probability of pixel distribution in the image is proposed. Color image is first divided into R, G, and B channel images. Then, pixel distribution from each of channel image is extracted to select to which it is similar among the well known probabilistic distribution function- Weibull, Exponential, Beta, Gamma, Normal, and Uniform. We use sum of least square error to measure of the quality how well an image is fitted to distribution. That P.d.f has minimum score in relation to sum of square error is chosen. Next, each image is quantized into 4 gray levels by applying thresholds to the c.d.f of the selected distribution of each channel. Finally, three quantized images are combined into one color image to obtain final segmentation result. To show the validity of the proposed method, experiments on some images are performed.
Key words: Color image, Segmentation, Probability Density Function (p.d.f), Cumulative Density Function (c.d.f)
1. Introduction With the rise of computer performance and IT industry, growth of information in multimedia form is explosive. Of this, imagery information shows especially rapid growth and research on methods for content-based retrieval for fast retrieval of such information is steadily proceeding. Content-based retrieval, which is differentiated from text-based retrieval where users manually index each image for retrievals, extracts features that can represent the image and retrieves an image based on them [1, 2]. Among the features that can represent imagery content are color, texture, and shape. Since color can intuitively describe an image, it is often employed solo. The easiest way to express color is to extract and utilize color histogram. However, because it loses information about important objects that compose an image, this method does not qualify for accurate retrieval [3-5]. Manuscript received April 5, 2008 Manuscript revised April 20, 2008
Therefore, much attention is given to researches on the methods that can accurately express objects. To be able to accurately demonstrate object information, segmentation of one object from the other must be accomplished. This article covers image segmentation as such. Color image segmentation is separating objects (or area) by integrating pixels with similar information based on certain criteria. This method leaves the problem of deciding the level of segmentation to be done, because it is not easy to accomplish segmentation that humans can recognize. Therefore, rather than the accurate object segmentation, approximate method - grouping pixels or areas with same information or features and comparing the similarity between these areas to retrieve - is employed in the actual retrieval system. This method is possible because it seeks images with high similarity, not complete identity [6-9]. This paper proposes image segmentation based on probability distribution. Assuming color distribution of the pixels follow a certain PDF(Probability Density Function), the whole image can be expressed by integrating pixels of certain probability value and expressing them as areas. If one area is different from another, color histogram of the pixel values will have different PDFs, and similar areas will have similar distribution characteristics. Ultimately, related colors will have close probability values and with this as a basis, we seek to cluster and segment an image.
2. Image Segmentation Image segmentation is clustering of an image based on certain features of the image, and quality of such depends on correctly interpreting imagery data and accurately estimating certain features. This article is of a method that segments an image by assuming pixel value distribution of each area that compose an image follows a certain distribution function, selecting a density function according to statistical principles, and estimating parameters.
IJCSNS International Journal of Computer Science and Network Security, VOL.8 No.4, April 2008
42
2.1 Approximate PDF Selection and Parameter Estimation It is assumed that the distribution of pixel values composing an image follows one of the six typical basic PDFs p REF (v), REF = 1,2,...,6, v = 0,1,...,255 - Exponential, Normal, Uniform, Beta, Gamma, and Weibull distribution. However, it is not such a simple problem to select a PDF among the six that most closely simulates the distribution of pixel values from the actual image to be segmented. For this, in this article, we first acquire the distribution of pixel values from the actual image, then, using LSE(Least Square Error) to compute an error between such distribution and the six, we select a particular PDF that exhibits the smallest SSE among them. That is, we select the PDF with a trace that has the shortest distance from the trace of the distribution of the pixel values of an image [10, 11]. First, if we define w and h as the horizontal and vertical size (respectively) of an image, and suppose f C ( x, y ) , x = 0,1,...w − 1 y = 0,1,..., h − 1 , as an RGB color image and f Gi ( x, y) , i = R, G, B as individual R, G, B channel image for f C ( x, y ) , the best fit PDF to a given image is derived through the steps below.
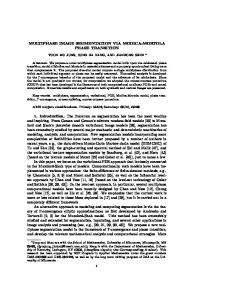
assumes that an image can be separated into 4 areas. For this, we derive a CDF(Cumulative Density Function) for the PDF selected in the preceding chapter, and divided the function into 4 equal parts and represented each area with the 4 parts. An image is segmented through 3 steps described below. STEP 1: Apply Step 4 value of CDF to the gray images of R, G, B channel. For the approximate PDF derived by equation (1) for each R, G, B channel, derive CDFs Fk (v) and divide the image into 4 bands with 25% probability interval based on the intensity value v . Fig 1 is an example of image segmentation using CDFs probability band. Each band features different areas dimensions despite the equal 25% difference in cumulative probability value.
STEP 1: Divide the color image f C ( x, y ) to be segmented into the gray images of R, G, B channel f Gi ( x, y ), i = R, G, B
STEP 2: Derive PDFs for each channel images pGi (v), i = R, G, B STEP 3: For each R, G, B channel images, derive the six basic PDFs p REF (v), REF = 1,2,...,6 . In this case, parameters must be estimated using 95% CI(Confidence Interval) STEP 4: For each channel, calculate using LSE the error between the true distribution of the image from STEP 2 and the six basic PDFs from STEP 3. Select the PDF pGi (v) with the smallest SSE(Sum of Square Error) for each channel.
p (v) = min p (v) − p (v) , i
i
G
G
REF
REF
for
i=R,G,B.
REF=1,2,…,6.
(1)
2.2 Image Segmentation Using Probability Band Typically, from Cognitive Engineering perspective, humans have a tendency to recognize an image through 3-4 main colors [12, 13]. Therefore, this research also
Fig 1. Image segmentation using CDFs probability band for each channel
STEP 2: Select the median as the band's representative value.
vi =
F
−
( F k − 1 ( v )) + F 2
−
( F k ( v ))
,
i, k=1,2,3,4. (2)
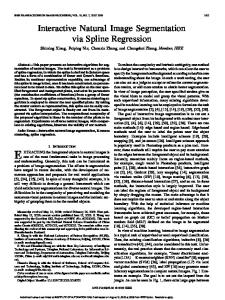
Here, Fk− (v) is Fk (v) 's inverse transform function, v i represents the representative value for the ith band, and k represents each step of CDF. To mark the 4 areas divided in STEP 1, a value that represents each step must be selected. In this research, the median is selected as the bands' representative value. That is, for the representative value of band i v i , the inverse transform of CDF F − ( Fk ( v )) is computed and the median of the current step value and the preceding step value is selected. Fig 2 describes the details of STEP 2.
IJCSNS International Journal of Computer Science and Network Security, VOL.8 No.4, April 2008
43
3.1 Approximate PDF Selection and Parameter Estimation Result Table 1 is the list of SSE of LSE for each R, G, B channel of 'Sun Rise' image sorted in ascending order. Beta distribution exhibits the smallest value for R and G channel, where Weibull does for B channel. Thus, they are selected as the optimal PDF for each channel.
Table 1. SSE for each channel of 'Sun Rise' Image (a) Red Channel (b) Green Channel (c) Blue Channel
Ranking Fig 2. Selection of the Representative Value for Each Band
STEP 3: Final segmented color image is produced by integrating the channel divided images. Final color image is acquired by integrating images that are divided into 4 areas for each channel. Since each channel contains 4 intensity values, the final image is a color image that can have the maximum of 64 ( = 4 × 4 × 4 ) color bins. Above mentioned algorithm divides pixels with same probability or same interval as one area. Therefore, even though they are not of the same area, they will be classified as the same area if they are of the same probability band. And, pixels of same probability band that does not affect the image substantially can be classified as noise. To amend this, morphology technique is used to remove the minute parts.
Function
Sum of Square Error
1
Beta
0.0377
2
Uniform
0.254
3
Normal
0.257
4
Exponential
0.264
5
Gamma
0.271
6
Weibull
0.307
(a) Ranking
Function
Sum of Square Error
1
Beta
0.0138
2
Uniform
0.0284
3
Normal
0.0330
4
Exponential
0.0354
5
Gamma
0.0355
6
Weibull
0.416
(b)
3. Test Result The proposed algorithm is tested on a Pentium IV computer using Matlab. The image used in this test is a 192x128 sized ‘Sun Rise’(Fig 3) color image.
Ranking
Function
Sum of Square Error
1
Beta
0.00216
2
Uniform
0.114
3
Normal
0.26
4
Exponential
0.425
5
Gamma
0.758
6
Weibull
0.853
(c)
3.2 R, G, B Channel Segmentation using Probability Band Result Fig 3. ‘Sun Rise’Image
Fig 4 (a) is the red channel of Fig 3 'Sun Rise' image and (b) is the result of segmenting (a) image through probability band process using the Beta distribution function and corresponding CDF derived by the optimal
IJCSNS International Journal of Computer Science and Network Security, VOL.8 No.4, April 2008
44
PDF selection and parameter estimation process. It can be verified that intensity value from 0(black) to 255(white) are divided into 4 intervals.
(a)
(b)
Fig 6. Segmentation of‘Sun Rise’Image Green Channel: (a) Original Green Channel (b) Segmentation using Beta Distribution Function
(a)
(b)
Fig 4. Segmentation of the Red Channel of Sun Rise Image: (a) Original Red Channel (b) Segmentation Using Beta Distribution Function
Fig 5 shows the segmenting process of each interval for Fig 4 (b) using STEP 1,2 of chapter 2.2. For example, (a) of Fig 5 shows 2 areas - interval 1 and the combination of interval 2, 3, 4. Although the silhouettes of buildings of the image (interval 1) and the background (represented by interval 2, 3, 4) are not distinguishable in (a), (b) exhibits a substantial similarity to the original albeit not exact.
(a)
(c)
Fig 7 shows the segmentation area for each interval of Fig 6 (b), and especially, since in accordance with the U shaped characteristics of Beta PDF most of the pixels are near the lows and highs of intensity distribution, the image shows a high contrast ratio. Therefore, as is observed in the figure, parts corresponding to the 'sun' and the 'building' show clear segmentation.
(a)
(b)
(c)
(d)
(b)
(d)
Fig 5. Segmentation of Fig 4 (b) into 1 interval and other: (a) 1 interval and others (b) 2 interval and others (c) 3 interval and others (d) 4 interval and others
Fig 6 (a) corresponds to the Green channel of 'Sun Rise' image and (b) is the result of segmenting (a) image using Beta distribution function.
Fig 7. Segmentation of Fig 6 (b) into 1 interval and other: (a) 1 interval and others (b) 2 interval and others (c) 3 interval and others (d) 4 interval and others
Fig 8 (a) corresponds to the Blue channel of 'Sun Rise' image and (b) is the result of segmenting (a) using Weibull distribution function. It is segmented into the white part which corresponds to the 'Sun' and the black part that surrounds it.
IJCSNS International Journal of Computer Science and Network Security, VOL.8 No.4, April 2008
(a)
(b)
Fig 8. Segmentation of‘Sun Rise’Image Blue Channel: (a) Original Blue Channel (b) Segmentation using Weibull Distribution Function
Fig 9 shows the area of each segmentation interval of Fig 8 (b) image, and the overall silhouette and noise element, which were not identifiable in Fig 8 (a), are identified. In this result, such silhouette or noises have negligible effect to image segmentation and thus can be considered as noise. Therefore, to remove this, Morphology technique mentioned in chapter 2.2 was employed.
(a)
Fig 10. Segmentation using approximate distribution functions
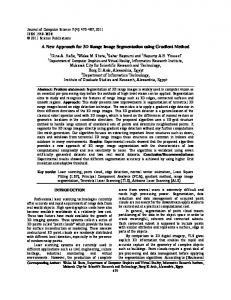
Fig 11 shows the result of segmentation of the three channels without selecting the best fit distribution functions for each channel. When Exponential distribution is selected for all three channels (a), when Weibull is selected (b), when Uniform is selected (c), it does not seem sufficient to represent the original image. Remainders (d), (e), (f) are relatively well segmented, and a certain degree of similarity among the three is noted. Especially, the case of Beta distribution (e) shows a high degree of similarity with Fig 10, and this attributes to the fact that for Red and Green channel, Beta distribution function was selected as the best fit PDF.
(b) (a)
(c)
45
(b)
(d) (c)
(d)
(e)
(f)
Fig 9. Segmentation of Fig 8 (b) into 1 interval and other: (a) 1 interval and others (b) 2 interval and others (c) 3 interval and others (d) 4 interval and others
3.3 Color Image Segmentation Final Result Fig 10 is the result of dividing the Fig 3 'Sun Rise' image into R, G, and B channel and segmenting and reintegrating using the PDFs that fit. Here, Red and Green channel use Beta distribution function and Blue channel uses Weibull distribution function.
Fig 11. Segmentation of Fig 4 image with each distribution function: (a) Exponential (b) Weibull (c) Uniform (d) Gamma (e) Beta (f) Normal
46
IJCSNS International Journal of Computer Science and Network Security, VOL.8 No.4, April 2008
4. Conclusion This article proposed image segmenting method for object-unit content-based image retrieval. After segmenting a color image into gray images of R, G, B channel, we found distribution functions that best represent the pixel value distribution of each gray image. Next, after dividing the intensity value based on the CDF of such distribution, the images were segmented. This reduces the color elements that can be considered small, thus adhering to the theory that humans recognizes images with 3~4 main colors. However, since the segmentation relies solely on the probability of color distribution, application to images with rich texture resulted in unsatisfactory performance. We believe that this shortcoming must be amended, and that application to more image samples is necessary to improve credibility of the proposed method.
“Adaptive Perceptual Color-Texture Image Segmentation”, IEEE Transactions on Image Processing, vol.14, no.10, pp.1524-1536, 2005. [8] Rafael C. Gonzalez, Richard E, Wood, Digital Image Processing, 2002. [9] Yoo, H.W, Jang, D.S, Jung, S.H., Park, J.H., Song, K.S., “Visual information retrieval system via content-based approach,” Pattern Recognition, 35(3), pp.749-769, 2002. [10] Richard L. Scheaffer, James T. McClave, “Probability and statistics for engineers,”1995. [11] Sheldon Ross, A First Course In Probability, 1998. [12] Biederman, I. Human image understanding: Recent research and a theory. Computer Vision, Graphics, and Image Processing, 32, pp.29-73, 1985. [13] A. Mojsilovic´, J.Kovaˇcevic´, J. Hu, R. J. Safranek, and S. K. Ganapathy, “Matching and retrieval based on the vocabulary and grammar of color patterns,” IEEE Trans. Image Process., vol.1, no.1, pp.38–54, 2000.
Seon-Do Kang received the M.S. degrees from National Defense Univ. in 2002. After working as a War Simulation Center officer (from2002), he has been a Ph.d at Korea Univ. since 2005. His research interest includes Simulation, Reliability, Image Processing.
Acknowledgment - This work was supported by the Brain Korea 21 Project in 2008. - This research was supported by the MIC (Ministry of Information and Communication), Korea, under the ITRC (Information Technology Research Center) support program supervised by the IITA(Institute of Information Technology Advancement) (IITA-2007-(C1090-0701-0025)).
Sang Sung Park received the Ph.D. degree in industrial system and information engineering from Korea University. He is a Research Professor of Ubiquitous Information Security Research Division at Korea University. His research interests include computer vision, pattern classification and knowledge
References [1] C. Faloutsos, M. Flicker, W. Niblack, D. Petkovic, W. Equitz, and R. Barber, “Efficient and Effective Querying by Image Content,” Technical Report, IBM Research Report, 1993. [2] T.S Chua, K.-L. Tan, and B.C. Ooi, “Fast signature-based color-spatial image retrieval,” in Proc. IEEE Conf. on Multimedia Computing and System, pp.362-369, 1997. [3] J. Fan and D. K. Yau, “Automatic image segmentation by integrating color-edge extraction and seeded region growing”, IEEE Transactions on Image Processing, vol.10, no.10, pp.1454-1466, 2001. [4] Y. Gdalyahu, D. Weinshall, and M. Werman, “Self-organization in vision: Stochastic clustering for image segmentation, perceptual grouping, and image database organization,” IEEE Transactions on Pattern Analysis and Machine Intelligence, vol.23, no.10, pp. 1053–1074, 2001. [5] Y. Deng and B. S. Manjunath, “Unsupervised segmentation of color texture regions in images and video,” IEEE Trans. Pattern Anal. Mach. Intell., vol.23, no.8, pp.800–810, Aug. 2001. [6] E. Navaon and O. Miller, “Color image segmentation based on adaptive local thresholds”, Image and Vision Computing, vol.23, no.1, pp.69-85, 2005. [7] J. Chen, T.N. Pappas, A. Mojsilovic and B.E. Rogowitz,
management.
Young Geun Shin received his B.S. degree in industrial system and information engineering from Korea University. He is currently a Integrated M.S. and Ph.D. andidate in Division of Information Management Engineering at Korea University. His research interests include pattern classification, scheduling and artificial intelligence.
IJCSNS International Journal of Computer Science and Network Security, VOL.8 No.4, April 2008
Hun-woo Yoo received B.S. and M.S degrees in Electrical Engineering from Inha University, Korea, in 1992 and 1994, respectively, and Ph.D. degree in Industrial Systems and Information Engineering at Korea University, Korea, in 2001. From 1994 to 1997, I have worked as a research engineer at the Manufacturing Technology Center of LG Electronics. From 2000 to 2003, I have worked as a chief research engineer at COSMO Information & Communication. And from 2003 to 2006, I have worked as a research professor at the Center for Cognitive Science at Yonsei University.
Dong Sik Jang received the Ph.D. degree in industrial and systems engineering from the Dwight Look College of Engineering, Texas A&M University, in 1988, the M.S. degree in Operations Research and Industrial Engineering from The University of Texas at Austin, in 1985, and the B.S. degree in Industrial Engineering from Korea University, in 1979. He is a Professor of Division of Information Management Engineering at Korea University. His research interests include computer vision, optimization theory and computer algorithm.
47