Published in Proceedings of the 12th ACM Conference on Computer and Communications Security, November 2005
An Auctioning Reputation System Based on Anomaly Detection Shai Rubin Mihai Christodorescu Jonathon T. Giffin Louis Kruger
Vinod Ganapathy Hao Wang
Computer Sciences Department University of Wisconsin, Madison {shai, mihai, vg, giffin, lpkruger, hbwang}@cs.wisc.edu
ABSTRACT
1. INTRODUCTION
Existing reputation systems used by online auction houses do not address the concern of a buyer shopping for commodities—finding a good bargain. These systems do not provide information on the practices adopted by sellers to ensure profitable auctions. These practices may be legitimate, like imposing a minimum starting bid on an auction, or fraudulent, like using colluding bidders to inflate the final price in a practice known as shilling. We develop a reputation system to help buyers identify sellers whose auctions seem price-inflated. Our reputation system is based upon models that characterize sellers according to statistical metrics related to price inflation. We combine the statistical models with anomaly detection techniques to identify the set of suspicious sellers. The output of our reputation system is a set of values for each seller representing the confidence with which the system can say that the auctions of the seller are price-inflated. We evaluate our reputation system on 604 high-volume sellers who posted 37,525 auctions on eBay. Our system automatically pinpoints sellers whose auctions contain potential shill bidders. When we manually analyze these sellers’ auctions, we find that many winning bids are at about the items’ market values, thus undercutting a buyer’s ability to find a bargain and demonstrating the effectiveness of our reputation system.
Online auction houses such as eBay have emerged as a convenient way to buy and sell items over the Internet. eBay alone has over 147 million registered users who posted over 431 million new listings in the first quarter of 2005 [12]. The presence and influence of such auction houses has been acknowledged by popular traditional retailers who now use them to promote and sell their products. Although online auctions sell commodities that are also sold by traditional retailers, the opportunity to find a good bargain is a primary motivation to favor online auctioning. However, participating in an online auction often requires buyers to trust an inherently adverse environment. First, because sellers can register under pseudonyms, a buyer risks participating in a transaction with an unknown seller rather than a trustworthy retailer. Second, because of the large scale of online auction houses, many sellers advertise the same items and the buyer is forced to choose from a large set of pseudonymous sellers. Recent studies have shown that pseudonymous sellers, large scale, and even the policies of the auction house encourage users to cheat [16]. A legitimate bidder participating in an auction has no way to determine whether other bidders in the auction are honest or are shill bidders who collaborate with the seller to artificially inflate the final price [22, 27]. One tool to establish a trust between buyers and sellers is an electronic reputation system [23]. Typically, a reputation system is a bi-directional medium where buyers post feedback on sellers, and vice versa. In eBay, buyers voluntarily comment on the quality of service, their satisfaction with the item traded, and promptness of shipping. Sellers comment about prompt payment from buyers, or respond to comments left by buyers. However, these feedback-based reputation systems suffer from two drawbacks. First, the reliability of the feedback is debatable: recent studies [7, 8, 24] have shown that bi-directional reputation systems tend to inflate positive feedback and deflate negative feedback. Indeed, our own analysis of eBay auctions shows that 95% of eBay sellers have good reputations and that 98% of their feedback is positive. Second, existing reputation systems do not help buyers avoid sellers whose auctions regularly appear price-inflated. The systems do not account for tactics, either legitimate or fraudulent, that a seller may use to ensure a profitable sale. A buyer cannot rationally choose a seller from the many that advertise a product. We propose a reputation system that addresses these drawbacks. Our system identifies sellers whose auctions appear to be priceinflated. It does not determine the cause of price inflation, i.e., it does not determine whether the price inflation is legal competitive bidding or is fraudulent. In conjunction with a traditional feedback-
Categories and Subject Descriptors K.4.4 [Computers and Society]: Electronic Commerce
General Terms Economics, Experimentation, Security
Keywords Anomaly detection, reputation system, auction, shilling
Permission to make digital or hard copies of all or part of this work for personal or classroom use is granted without fee provided that copies are not made or distributed for profit or commercial advantage and that copies bear this notice and the full citation on the first page. To copy otherwise, to republish, to post on servers or to redistribute to lists, requires prior specific permission and/or a fee. CCS’05, November 7–11, 2005, Alexandria, Virginia, USA. Copyright 2005 ACM 1-59593-226-7/05/0011 ...$5.00.
Published in Proceedings of the 12th ACM Conference on Computer and Communications Security, November 2005 based system, our system helps buyers avoid sellers who have good feedback but whose auctions are likely to end with prices near or above the items’ market values. Our system is robust against biased feedback because it avoids voluntary feedback from users. An example demonstrates the effectiveness of our system. Using data collected from actual eBay auctions, we automatically detected, out of more than 12,000 sellers, a hard-disk seller with the following behavior: all his auctions ended with a winning bid, while on average, 30% of the auctions posted by other hard-disk sellers ended with no bids. The average number of bids in this seller’s auctions was abnormally high. A group of bidders repeatedly participated, and lost, in his auctions, thus acting as shills. While our system cannot determine whether this behavior is fraudulent or merely competitive, the patterns discovered suggest that a buyer is unlikely to find a bargain in this seller’s auctions. Indeed, the final prices in his auctions were comparable to market value when coupled with shipping fees. We build our system using principles of anomaly detection. Our system is based upon the assumptions that most sellers are honest and their auctions are not artificially price-inflated. We collect data from the auctions of each seller, statistically compare each seller’s data against the data of all other sellers, and identify anomalous sellers. We designed our statistical models to identify price inflation; consequently, anomalies indicate sellers likely to have adopted questionable tactics and whose auctions are better avoided. Our reputation system is based upon three statistical models. The first model correlates the number of auctions a seller posts to the average number of bids in those auctions. We found an inverse correlation—as the number of a seller’s auctions increases, the average bid count decreases. This model identifies the first set of anomalous sellers: those who post many auctions and also attract many bidders. We assume that the auctions of some of these sellers are inflated. The second model provides an explanation, in terms of legitimate behavior, for the anomalous sellers identified by the first model. The model correlates an auction’s starting bid to the number of bids in the auction. We found that auctions with low starting bids receive more bids then auctions with higher starting bids. Hence, this model separates the anomalous sellers of the first model, sellers whose auctions attracts abnormally high number of bids, into two sets: those with low starting bids and those with high starting bids. We accept a low starting bid as a legitimate explanation for high number of bids. Therefore, auctions with many bids and low starting bids are less likely to be price-inflated than auctions with many bids and high starting bids. The third model provides explanation for the anomalous cases identified by the first model in terms of fraudulent behavior. The model identifies a group of bidders who repeatedly participate in a seller’s auctions, and lose. We call this group of bidders potential shills because their behavior is consistent with shilling: they inflate prices and let other people win. We use the third model to strengthen our belief that a seller’s prices are inflated. These three models identify anomalous sellers who appear to be artificially raising bids in their auctions. A seller with inflated prices is a seller who: (i) according to the first model, has many auctions that attract many bids, (ii) according to the second model, does not start auctions with a relatively low starting bid, and (iii) according to the third model, has a group of bidders who repeatedly participate in his auctions and lose. In addition to classifying a seller as normal or abnormal, our system also provides a score for each seller. This score is a set of three values, one for each model, that represents confidence in the system’s classification.
To summarize, the contributions of this paper are as follows: • A new application of anomaly detection. We formulate the problem of identifying unusual and possibly malicious selling practices in auctions as an anomaly detection problem. • A new behavior-based reputation system. We introduce a reputation system that is based upon sellers’ and buyers’ behavior rather than the feedback they give each other. We show that our system helps honest, bargain-seeking buyers identify auctions on which to place bids and avoid auctions which may be price-inflated. • Real-world evaluation. We deploy our reputation system in a large-scale experiment on real auctioning data from eBay. We show how our reputation system effectively pinpoints the sellers whose auctions seem price-inflated. We also find that eBay’s reputation system assigns high reputation to sellers who seem to inflate prices, thus confirming our belief that eBay’s reputation system is not useful for finding bargains.
2. RELATED WORK We review related work in reputation systems, fraud in electronic transactions, and anomaly detection.
2.1 Reputation systems A reputation system establishes trust in electronic transactions. Brinkmann and Seifert [4] argued that participation in an online transaction requires a feedback mechanism to establish trust. This requirement arises from the fundamental difference between online and real-life environments: in online systems, the participants have not met and do not have the mutual information needed for the risk assessment of the transaction. In an analysis of the eBay reputation system, Dellarocas [8] concluded that positive and negative feedback can affect the price and the probability of a sale, and noted that the feedback is overwhelmingly positive, a possible indication that the present eBay feedback mechanism does not work. Resnick and Zeckhauser [24], and, later, Resnick et al. [25] uncovered similar limitations in the eBay system: feedback is not the best predictor of future behavior, and negative feedback has little impact. Attempting to address the shortcomings of the eBay feedbackbased reputation system, Chen and Singh [6] proposed a reputation system for raters (providers of feedback), based on the consistency of a rater over time. This approach might improve the current eBay reputation system, but is still fundamentally restricted to answering questions about seller behavior after an auction, i.e., after bidding has completed, but before the item has been delivered. Thus, this system can answer questions about the quality of the item, promptness in shipping, and so on. Our reputation system is complementary in that it describes bidding behavior during an auction. Analogously to Chen and Singh’s system, our system automatically tracks both bidders’ and sellers’ auctioning behaviors.
2.2 Fraud in electronic transactions Fraud is one cause of price inflation in an electronic transaction system. Fraud prevention attempts to build marketplaces that limit or eliminate fraud altogether, while fraud detection identifies fraud during or after a transaction. In online auctioning, fraud prevention is achieved using policies and regulation (e.g., eBay prohibits auction shilling [11]) and feedback-based reputation systems are used to report past cases of fraud. Where fraud prevention and detection were insufficient or impossible, researchers changed the transaction system to make fraudulent activities undesirable. Hidv´egi et al. [13] addressed the prob-
Published in Proceedings of the 12th ACM Conference on Computer and Communications Security, November 2005 lem of shilling by proposing a Shill-Proof Fee (SPF) system that countered the monetary benefit of shilling through a dynamic fee based on the difference between the final price and the reserve price (the lowest price at which the seller is willing to sell). SPF is applicable only to Independent Private Value (IPV) auctions, where each potential bidder has his own valuation of the item for sale. In contrast, most eBay auctions are common value, where the item for sale has a common value (e.g., the market price of the item) known to every potential bidder. The proposed SPF scheme is not practical in the eBay setting as some fees would be excessive, reaching 60% or more of the final price. Detecting fraud in online auctions is inherently different than detecting fraud in other Internet activities. In an auction, a participant might not know that fraud has occurred even after the auction has concluded. Kauffman and Wood [16] used heuristics to determine when a bid is “questionable.” Labeling bids as “questionable” or “honest” before applying learning to derive a fraud-detection algorithm limits the scope of detection to specific types of fraud. To avoid this limitation, we use unsupervised learning that does not require auctions to be labeled a priori. We identify sellers that are dissimilar from a norm we believe is not fraudulent. As a result, our system can detect price inflation regardless of its cause and provides the ability to compare the level in which a particular seller differs from all other sellers.
2.3 Anomaly detection Fraud detection can be cast as a classification problem: given a transaction such as a credit card purchase or a bid in an auction, determine if it is fraudulent. Designing a fraud detection tool, then, is the task of building or learning a classifier. A classifier can be created using a database of past transactions where each data item is labeled as fraudulent or legitimate, known as supervised learning (e.g., [10]). Such methods have been applied for detecting fraud in electronic commerce: Brause et al. [3] presented a neural network algorithm for detection of credit card fraud, while the ASPeCT project [21] applied supervised neural network learning to fraud detection in mobile phone systems. For online auctions, Kauffman and Wood [16] proposed the use of logistic regression to predict reserve-price shilling. In intrusion detection for computer security, Lee et al. [19, 20] showed the importance of data mining for training classifiers from labeled data and then use the trained classifiers to do anomaly detection. As mentioned, in online auctions we do not have data labeled as “bargains” or “shills”. Therefore, we use unsupervised learning techniques to split the sellers into normal and abnormal sets. We then evaluate the relation between abnormal sellers and price inflation. To distinguish between normal and abnormal sellers, we use some of the features reported by Shah et al. [27]. They analyzed eBay auction data and applied clustering (a form of unsupervised learning) to classify bidders. They found several characteristics that applied to shills: shills are a group of bidders with a strong association to a seller, shills are infrequent winners, and shills bid early in the auction. In this work, we capture the first two features in our bidder profiles (Section 4). In computer security, intrusion detection benefited from unsupervised learning, as the labeling of data is cumbersome, error-prone, and time consuming. Kruegel et al. [18] proposed a system for service-specific anomaly detection, where an anomaly score was assigned to each network packet. Similarly, we build our technique on principles from anomaly detection, where we capture normal behavior and detect variations from the norm. This allows our technique to adapt and evolve over time, characteristics needed to track the changes both in legitimate behavior and in fraud patterns [2].
3. REPUTATION VIA ANOMALY DETECTION Our work develops a reputation system that assigns low reputation to sellers whose auctions are anomalous. We formally characterize anomalous auctions using three statistical models, each of which provides different evidence for activity that artificially increases prices. We then apply anomaly detection techniques to these models and identify sellers with the strongest evidence for price inflation. We assign low reputation to such sellers. In this section, we give an informal overview of the models we developed. We illustrate how the models automatically helped us identify a seller, called 102601 , whose behavior corresponds to price inflation. We inspected 10260’s auctions and found evidence of bidder activity that appeared to artificially inflate this seller’s prices. A formal treatment of the models appears in Section 4.
3.1 Models of Bidding Behavior Our reputation system is based upon the concept of auctioning reputation, which we implement using three statistical models. N : Average number of bids in a seller’s auctions. This model identifies sellers whose auctions, on average, attract a large number of bids as compared to auctions posted by other sellers. Our analysis of eBay’s auction data shows that the number of bids in a seller’s auction is inversely correlated to the number of auctions a seller posts: more auctions imply fewer bids per auction. Thus, a seller is considered anomalous if he has many auctions and most of his auctions attract a large number of bids. Note that the N model does not provide an explanation for price inflation. In particular, price inflation may be because of fierce bidder competition, which is legitimate, or because of shilling, which is fraudulent. The next two models provide explanations for the anomalous cases identified by the first model. M: The average minimum starting bid in a seller’s auctions. For each eBay auction, the seller can limit the first bid to a certain minimum, called the minimum starting bid. eBay will not let bidders place bids unless their bid is equal to or higher than this bid. M identifies sellers with the following property: they have a large number of bids in their auctions, but this behavior cannot be accounted for by a low minimum starting bid. We found that there is an inverse correlation between the minimum starting bid and the number of bids received per auction. An auction with a low minimum starting bid is likely to attract more bids than an auction with a high minimum starting bid. We use M to reduce our suspicion of price inflation in the auctions of a seller identified as anomalous by N . P: The bidders’ profiles in a seller’s auctions. This model determines, for each seller, whether there exists a group of bidders that repeatedly participates, and loses, in the seller’s auctions. The existence of such a group explains a high average number of bids as possible shilling activity. We use each of the above models individually to split the sellers into normal and abnormal. We say that a seller is abnormal with respect to N if the seller’s average number of bids is statistically different than that of other sellers. We say that a seller is abnormal 1
We omit the username of the seller for privacy reasons.
Published in Proceedings of the 12th ACM Conference on Computer and Communications Security, November 2005 with respect to M if the seller’s average number of bids cannot be predicted with high confidence by M. We say that a seller is abnormal with respect to P if his profile is statistically different than the profile of other sellers.
3.2 Using Anomaly Detection to Identify Price Inflation Consider a seller called 10260 who published 345 auctions during the three weeks in which we collected auction data from eBay. According to our data, he is the ninth highest volume seller in the category Laptop Parts & Accessories. While the average number of bids across all sellers in this category is 1.75 with a standard deviation of 2.7, the average number of bids in 10260’s auctions is 9.75, which is significantly different than the average number of bids across all sellers. Furthermore, sellers with a similar number of auctions averaged less than one bid per auction. We conclude that 10260 is abnormal with respect to N . We tried to explain 10260’s high average number of bids using the M model. 10260 usually set a minimum starting bid that was 67% lower than the market value of the item. M predicts, with 95% confidence, that with such a minimum-starting bid, the average number of bids should be 8.1. 10260’s low average minimum starting bid does not account for his high average number of bids. We conclude that 10260 is also abnormal with respect to M. Next, we tried to explain 10260’s average number of bids using the P model. We found that out of 936 different bidders who participated in 10260’s auctions, 5 bidders participated in 65% of the auctions. However, these 5 bidders only won 1% of 10260’s auctions. If we define a bidder’s winning rate as the number of auctions won by the bidder divided by the number of auctions in which they participated, then these 5 bidders had a winning rate of only 0.008. This rate is 19 times lower than the average winning rate of all other bidders who bid on 10260’s auctions. We conclude that 10260 is abnormal with respect to P. The bidding behavior of 10260’s auctions is abnormal according to all three of our models. While our system cannot prove that 10260 used shills, the 5 repeating bidders act consistently with the shill behavior reported by Shah et al. [27]. We believe that the anomalous behavior of 10260 suggests that a buyer is unlikely to find a bargain in 10260’s auctions. 10260 sells laptop computer hard-disks. In our three-week experiment, we found 258 other sellers who sell similar items. On average, 30% of these sellers’ auctions ended up with no bids; this is in stark contrast to 10260’s auctions, which always attracted bidders. There were no particular bargains that would have attracted a disproportionate number of bidders to 10260’s auctions; with shipping costs included, the auctions still ended with purchase prices comparable to market value.
3.3 From Bidding Behavior to Reputation Using the three models, we identify the auctioning reputation of each seller as a 3-tuple of anomaly scores. Table 1 provides our proposed interpretation for various outcomes of our system. An abnormal value for N , M, or P indicates a high number of bids, that the seller has a large number of bids not explained by a low minimum-starting bid, or that certain bidders repeatedly lose in this seller’s auctions, respectively. Although this table shows boolean values for simplicity, Section 4.5 explains that our system actually assigns numeric anomaly scores that describe our confidence in the normality or anomalousness of a seller. 10260 is abnormal with respect to all three of our models. This is the strongest evidence we can provide for price inflation. There are cases in which one of the models classifies a seller as normal
N A A A A N N N N
M A A N N A A N N
P A N A N A N A N
Evidence for price inflation Strongest (e.g., seller 10260) Weak: unexplained high number of bids Weak: potential shilling No evidence Weak: potential shilling No evidence Weak: potential shilling No evidence
Table 1: Interpretation of model anomalies. N , M, and P denote the models in the auctioning reputation. An “A” indicates that a seller’s score for a model is anomalous, while an “N” indicates that the score is normal. In practice, numeric values express confidence in the anomalousness of a score (see Section 4.5). while another model classifies him as abnormal. For example, there are sellers who have a high number of bids that can be explained by the minimum-starting bid model, but at the same time, have an abnormal set of repeating bidders. In such cases, we say that our reputation system provides weak evidence of shilling. Comparing cases of weak evidence and determining the level of weakness is beyond the scope of this paper.
4. FORMALIZING REPUTATION We formalize the intuitive process presented in Section 3.2 to enable the automation of our reputation system. This sections precisely defines the concepts “normal behavior” and “abnormal behavior”. We first collected auction data from eBay and then analyzed the data according to our three models (Section 3.1). In each model, we divided the seller population into a normal set that contained 95% of the sellers and an abnormal set containing the remaining 5% using a confidence interval with a coverage probability of 95% [26]. We define a seller as abnormal with respect to a particular model if he falls outside the confidence interval of the model.
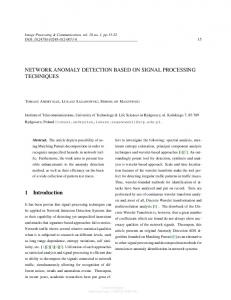
4.1 eBay Data During a period of three weeks in March 2005, we collected data from eBay auctions that were listed in the Laptop Parts & Accessories category. For each auction, we collected the following data: the seller’s username, the seller’s reputation according to eBay, and the bids that were placed. For each bid, we recorded its amount, the time it was placed, and the bidder’s username. In total, we collected 145,342 auctions. Before we analyzed the auctions according to our models, we filtered out uninteresting auctions. An eBay auction can end in three different ways. First, an auction can end using the Buy-It-Now option: a bidder buys the item by paying a predetermined price. This can happen even if the auction has already started and other bidders have already placed their bids. Second, an auction might end when the seller decides to accept the current highest bid and terminate the auction. Last, an auction might end when its allocated time has passed. In this case, the highest bid is the winning bid. We are interested in this final category because, with 127,815 auctions, it forms the majority of the data collected and because price inflation can occur when auctions end in this manner. eBay enables auctions that last one, three, five, seven, or ten days. Since the duration of an auction affects the number of bids in the auction, it is
Published in Proceedings of the 12th ACM Conference on Computer and Communications Security, November 2005 35
50 45
30
% of high−volume sellers
40
% of auctions
35 30 25 20 15
95%
25
5%
20
15
10
10 5
5 0
1
3
5 duration (days)
7
0
10
(a) Percentage of bidding auctions that last 1, 3, 5, 7, and 10 days. The total number of bidding auctions is 127,815.
2
0
12 10 8 6 4 Average number of bids per auction
N normal N abnormal Normal line
1600
90 1400 Number of auctions for a seller
% of all auctions
70 60 50 40 30
1200 1000 800 600 400
10260
20 10 0 0
All auctions seven−day auctions
20
60 40 % of all sellers
80
100
16
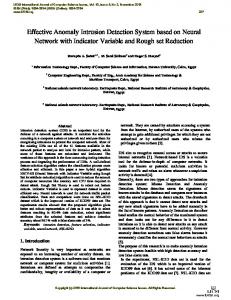
(a) Distribution of high-volume sellers based on the average number of bids in their auctions.
100
80
14
200
0
2
4
12 10 8 6 Average number of bids per auction
14
16
(b) Market share of sellers. The total number of sellers in the seven-day category is 12,331. 604 of these are high-volume sellers that posted 37,525 auctions (60% of the seven-day actions).
(b) The N model: correlation between average number of bids and the number of auctions a seller posted.
Figure 1: Characterization of eBay data. We focused our reputation system on 62,542 auctions in the 7-day category.
Figure 2: Average number of bids analysis for 604 high-volume sellers that posted 60% of the 7-day auctions.
inaccurate to compare the number of bids in auctions of different durations. Therefore, we learned behavioral models based on the data from 62,542 seven-day auctions which covered almost 50% of all auctions (Figure 1a). We observe that the market is dominated by high-volume sellers. Figure 1b presents the accumulated market share of sellers. In the seven-day category, 5% of the sellers controlled 60% of the market. Consequently, we restricted our attention to high-volume sellers, defined as the top 5% in terms of number of auctions posted. While the total number of sellers in the seven-day auction category is 12,331, only 604 are high-volume sellers who posted 37,525 auctions. During our three-week experiment, each high-volume seller posted at least 14 auctions.
to the N model. Figure 2b suggests that an abnormal seller is a seller with a large number of bids and a large number of auctions. We formally define this property using quantile regression [5, 17]. This method splits the plane of Figure 2b into two half-planes. The first half-plane contains 95% of the sellers whose behavior we define as normal. The second half-plane contains 5% of the sellers who have both a large number of auctions, and a high average number of bids in their auctions. We define the latter group of sellers as abnormal. For the results reported in this paper, we split the plane with a piecewise linear function called the normal line of N .
4.2 Average Number of Bids Model (N ) We now define normal and abnormal sellers with respect to the N model. Figure 2a presents the distribution of high-volume sellers with respect to their average number of bids. The x-axis in the figure accumulates averages in the ranges [0, 0.5), [0.5, 1), and so on. Ninety-five percent of the high-volume sellers have, on average, fewer than seven bids per auction. While this data alone suffices to define normal and abnormal sellers, we noticed that the average number of bids is statistically correlated (p-value smaller than 0.05 [26]) inversely to the total number of auctions posted by a seller: sellers who post more auctions receive fewer bids in their auctions (Figure 2b). Given this correlation, we use Figure 2b as the basis for defining a seller as normal (or abnormal) with respect
4.3 Average Minimum Starting Bid Model (M) Sellers not adopting fraudulent tactics, such as shilling, may also be classified as abnormal with respect to the N model. Legitimate bidder behavior, such as fierce competition on a high-demand item posted with a low minimum starting bid, can explain a high average number of bids. As a result, an honest seller who places an item on sale at a low starting price may be identified as anomalous with respect to the N model. The average minimum starting bid model (M) is designed to help differentiate between legitimate and fraudulent behaviors producing an anomalous N score. The goal of the M model is to predict the average number of bids in the seller’s auctions given the average minimum starting bid set by the seller. To obtain a fair comparison between the minimum bids imposed by sellers who sell different items, we define the relative minimum starting bid (RMB) for each auction:
Published in Proceedings of the 12th ACM Conference on Computer and Communications Security, November 2005 16 14 Average # of bids in seller’s auctions
D EFINITION 1 (B IDDER PRESENCE ). Let b be a bidder and s a seller. The presence of b with respect to s, denoted p(b, s), is the number of s’s auctions in which b placed at least one bid.
M normal M abnormal Polynomial fit Normal line
12
The cumulative bidder presence curve describes how this presence is distributed among different bidders in s’s auctions.
10260
10 8 6 4 2
0
0.1
0.2
0.3
0.7 0.6 0.5 0.4 Average RMB for seller
0.8
0.9
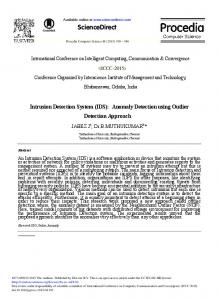
Figure 3: The M model: correlation between average number of bids in a seller’s auctions and the seller’s RMB.
RMB =
winning bid − minimum starting bid winning bid
On average, the winning bid of an auction represents the item’s market value [15]. Thus RMB, which is related to the ratio between the minimum starting bid and the winning bid, represents how cheaply the item started off, as compared to its market value; an RMB close to one indicates a low minimum starting bid. We define the seller’s average minimum starting bid as the average RMB in the seller’s auctions. Intuitively, we expect more bidders to participate in auctions of sellers whose average minimum starting bid is high. Figure 3 confirms our intuition. It shows a strong positive correlation (p-value less than 0.02 [26]) between the seller’s average minimum starting bid and average number of bids. We define the M model as the polynomial fit that describes this correlation (the dashed line in Figure 3). We define any seller whose average minimum starting bid is not in the 95% confidence interval (below the solid line) of this model as abnormal with respect to M. Note that some sellers, for example 10260 from Section 3.2, have both a high average minimum starting bid and a high average number of bids, but are still classified as abnormal with respect to the M model. This indicates that the large number of bids in their auctions cannot be attributed solely to a low minimum starting bid, and another explanation is necessary. The bidders’ profile model, which we introduce next, provides such an explanation.
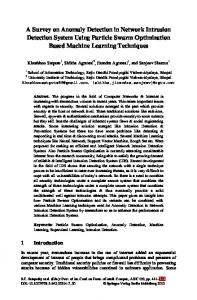
4.4 Bidders’ Profile Model (P ) The bidders’ profile model (P) identifies a group of bidders who repeatedly bid, and lose, in a seller’s auctions. Such a group of bidders act as shills for the seller: they participate in many auctions but let other bidders win. We assume that legitimate bidders participating actively in many auctions posted by a seller win auctions at a rate similar to that of buyers participating less actively. The P model compares cumulative distribution curves of repeating bidders and winning bidders. A statistically significant discrepancy between these curves indicates the presence of bidders who repeatedly lose. To identify a group of bidders who repeatedly bid in a seller s’s auctions, we construct the cumulative bidder presence curve for s. This curve enables us to identify repeating bidders because it counts, for each bidder, the number of s’s auctions in which they participated.
D EFINITION 2 (C UMULATIVE BIDDER PRESENCE (CBP)). Let s be a seller. Let {b1 , . . . , bn } be the set of n bidders who participated in s’s auctions ordered such that p(bi , s) ≥ p(bi+1 , s). Let Si = Σij=1 p(bj , s) for 1 ≤ i ≤ n and S0 = 0. The cumulative bidder presence (CBP) curve for s is the piecewise linear function connecting Si to Si+1 for all 0 ≤ i ≤ n − 1, scaled to the continuous domain [0, 100]. The cumulative bidder presence curve helps us identify a group of highly present bidders: they heavily participate, compared to other bidders, in s’s auctions. Since the bidder presence values are sorted in descending order, the existence of such a group appears visually as a CBP curve lying well above the linear line f (x) = x, as in the case of 10260 (Figure 4a). When all bidders are more equally present, the curve is close to linear, as in the case of 10417 (Figure 4c). To better understand the intuition behind the cumulative bidder presence curve, compare the curves of 10260 and 10417. Consider point A in the CBP curve of seller 10260 (Figure 4a). It shows that 10% of all bidders who participated in 10260’s auctions participated in 98% of his auctions. In comparison, Figure 4c shows that 10% of the bidders in 10417’s auctions participated in only 20% of his auctions (point C). In other words, when compared against 10417, the auctions of 10260 contain a group of highly present bidders: a small set of bidders who participate in many auctions. We found that 95% of the sellers’ CBP curves passed below the point (10%, 28%). That is, for 95% of the sellers, 10% of the bidders participated in fewer than 28% of that seller’s auctions. We call the curve that passes through (10%, 28%) the normal bidder presence curve, shown as the bold line in Figures 4a and 4c. Note that 10260’s CBP curve is above the normal curve while 10417’s is below. To determine whether a group of bidders who repeatedly participate in a seller s’s auctions also repeatedly lose, we construct the cumulative bidder wins curve for s. This curve counts the number of auctions won by each bidder. D EFINITION 3 (C UMULATIVE BIDDER WINS ). Let s be a seller. Let {b1 , . . . , bn } be the set of n bidders who participated in s’s auctions as identified in Definition 2. Denote as w(s, bi ) the number of times bi won an auction of s. Let Wi = Σij=1 w(s, bj ) for all 1 ≤ i ≤ n and W0 = 0. The cumulative bidder wins curve for s is the piecewise linear function connecting Wi to Wi+1 for all 0 ≤ i ≤ n − 1, scaled to the continuous domain [0, 100]. When we compare this curve to the cumulative bidder presence curve we can identify a group of bidders that repeatedly participate and lose. Consider the cumulative bidder wins curve of 10260 from Figure 4b. The same 10% of the bidders who placed 98% of the bids (point A) won only 20% of the auctions (point B). In comparison, 10% of the bidders who placed 20% of the bids in 10417’s auctions also won 20% of the auctions (point C in Figure 4d). When we plot the two curves on the same axes, the difference between 10260 and 10417 becomes apparent. In the case of 10260, there is a gap between the two curves (Figure 4b); this gap indicates that the most frequent bidders in 10260’s auctions are also frequent losers. In comparison, there is no gap between the curves of 10417;
Published in Proceedings of the 12th ACM Conference on Computer and Communications Security, November 2005 (a) Cumulative bidder presence curve
(c) Cumulative bidder presence curve 100
A
Participated auctions (%)
Participated auctions (%)
100
80
60
40
20
0
Normal line Bidder presence 0
10
20
30
40
50 Bidders (%)
60
70
80
90
80
60
40
20
0
100
Normal line Bidder presence
C 0
10
(b) Cumulative bidder presence and bidder wins curves
20
30
40
50 Bidders (%)
60
70
80
90
100
(d) Cumulative bidder presence and bidder wins curves
100
100
Participate or win (%)
Participate or win (%)
A 80
60
40
B
20
0
Bidder presence Bidder wins 0
10
20
30
40
50 Bidders (%)
60
70
80
90
100
Seller 10260. A small set of bidders frequently participate in 10260’s auctions and lose. Visually, this can be seen in as the gap between the two curves in Figure 4b.
80
60
40
20
0
Bidder presence Bidder wins
C 0
10
20
30
40
50 Bidders (%)
60
70
80
90
100
Seller 10417. Bidders win proportionally to their attempts. Visually, there is almost no gap between the curves in Figure 4d.
Figure 4: Bidders’ profiles for two sellers with inherently different P models. Each panel presents the normal curve of P common to all sellers and each seller’s unique cumulative bidder presence curve and cumulative bidder wins curve. this means that the most frequent bidders in 10417’s auctions have the same winning rate as other bidders in 10417’s auctions. For each seller s, we define its P score as the difference between the presence and win curves at the 10% point on the x-axis. We define an abnormal seller with respect to P as follows. First, at the 10% point, the value of the seller’s cumulative bidder presence curve must be above the value of the normal curve. Second, the gap between the presence and the win curves should be statistically high, defined as a value above the confidence interval constructed around the average gap with a coverage probability of 95%. By this definition, seller 10260 is abnormal and 10417 is normal with respect to the P model.
4.5 Auctioning Reputation Score Our auctioning reputation score is a vector of three variables hVN , VM , VP i, where each variable is a number between 0 and 100 and represents the coverage probability needed to include the seller inside a confidence interval. For example, consider again the seller 10260, whose reputation score is h99, 96, 99i. This means that if we want to define 10260 as normal with respect to N , we need to construct a confidence interval of 99%. Similarly, if we want 10260 to be normal with respect to M, we need to construct a confidence interval of 96%. Last, for normality with respect to P we need an interval of 99%. The amount by which we need to increase the confidence interval to redefine an anomalous seller as normal indicates the anomalousness of the seller. For example, if the P score for seller S1 is 96 and the score for seller S2 is 99, it means that S1 is closer to the normal curve and therefore is less anomalous than S2 .
5.
CASE STUDIES
Out of the 604 high-volume eBay sellers contained in our dataset, our reputation system identified 54 (9%) as abnormal with respect to at least one model. Of these fifty-four, eight are abnormal with respect to at least two models, and three are abnormal with respect to all three models. Figure 5 shows the distribution of all the abnormal sellers with respect to the three models. We now analyze four
Seller
Reputation Score
Empirical Evidence
hVN , VM , VP i
10260 7504
h99, 96, 99i h96, 98, 96i
672 7578
h94, 98, 97i h99, 89, 96i
potential shill bidders low minimum starting bid; potential shill bidders potential shill bidders potential shill bidders
Table 2: Reputation scores for four eBay sellers. A score in bold indicates that it is abnormal with respect to the normality line of the model.
of the abnormal sellers identified by our system and present a summary of our observations about these four sellers. Table 2 shows the reputation scores of these four sellers, along with a summary of the analysis. Seller 10260 is abnormal with respect to all three models: both his N and P scores are 99% However, 10260 is only marginally abnormal with respect to the M model, with a score of 96% (Figure 5c). Our empirical analysis of seller 10260’s auctions revealed that there was a group of bidders who always participated in his auctions but rarely won (Section 3.2). This behavior pattern is consistent with shilling [27]. Seller 7504 sold DVD drives for laptops and posted seventy-five auctions that always started at $1. With such a low minimum starting bid, it is not surprising that his auctions received an unusually high number of bids (Figure 5b). We identified a bidder who participated in every one of 7504’s auctions and always placed an early bid at a fixed price of $66. Although this bidder never won a single auction, his bids always pushed the final price from less than $50 to more than $67. Our investigation showed that a price of $66 is higher than the market value of the DVD drives, and we were able to find other eBay auctions for similar items that ended at a lower price. This behavior is consistent with shilling. Seller 672 also sold DVD drives for laptops and posted 20 auctions during our data collection period. The winning rate of the top
Published in Proceedings of the 12th ACM Conference on Computer and Communications Security, November 2005 18 Normal line
16
M
Average # of bids in seller’s auctions
N 2 24
13 1
3
2
9
P (a) Distribution of all abnormal sellers across the three models.
7504
14 672
12 10
10260
8 6 4 2
7578
0 0
0.2
0.6 0.4 Average RMB for seller
0.8
1
(c) Distribution of all abnormal sellers across the M model. 100
Normal line
1600
90 80
1200 Participated auctions (%)
Number of auctions for a seller
1400
1000 800 600 400
7578 10260
50 40 30 20
200
7504 672 7578 Normal Line
10 672
0
70 60
2
4
12 10 8 6 Average number of bids per auction
7504
14
16
0 0
20
60
40
80
100
Bidders (%)
(b) Distribution of all abnormal sellers across the N model.
(d) Distribution of some of the abnormal sellers across the P model.
Figure 5: Analysis of abnormal sellers. 5% of the bidders in his auctions was 2%, while the winning rate of all bidders on his auction was 13%. This classifies 672 as abnormal with respect to the P model (Figure 5c). The top two bidders participated in fifteen of the twenty auctions but won none of them. We found that these two bidders were exclusively buyers—they bid on items but never sold items on eBay. These bidders also usually placed bids at about 90% of the final price. Again, this behavior is consistent with shilling. Seller 7578 sold laptop batteries and posted 439 auctions, 248 of which ended with at least one bid. The winning rate of the top 5% of the bidders in his auctions was 14%, while the average winning rate across all other bidders was 40%. This classifies seller 7578 as abnormal with respect to the P model (Figure 5d). Two top bidders participated in forty auctions but won only one auction. The first bidder usually bid up to 90% of the final price while the second bidder only bid very early in the auction, usually with a small bid. These two bidders are both exclusively buyers; they only buy on eBay. The abnormality of 7578 with respect to N (Figure 5b) can be explained by a normal M (Figure 5c). Overall, the only evidence for price inflation is the existence of the two exclusive buyers. Although these buyers may not be fraudulent, na¨ıve buyers have reduced chances to find bargains from this seller. We hypothesize that an inexperienced buyer has diminished opportunities to get a bargain from a seller identified as abnormal with respect to at least two of our models: • In the auctions posted by each of these abnormal sellers, we observed bidding behavior consistent with shilling. For each of these sellers, there was a different set of bidders who repeatedly participated and lost in his auctions.
• Using an informal survey, we estimated that the final prices in these auctions were close to prices at other online stores, including reputable retailers. • For at least one seller, 7504, we found a bidder whose activity was highly suggestive of shilling. This bidder bid early and always at the same price. As a result, the final price of the item sold was higher than the price of similar items found on eBay. Interestingly, we note that the eBay reputations of these four sellers were overwhelmingly positive—on average, these sellers received 98.7% positive feedback. However, as these sellers are so abnormal with respect to other sellers, as determined by our reputation system, an inexperienced buyer is well-advised to bid elsewhere.
6. THREAT ANALYSIS We now consider the techniques a malicious seller could use to appear normal in our reputation system. Our system uses anomaly detection to identify sellers who have price-inflated auctions, possibly due to shilling. A malicious seller may try to lower his reputation scores so that they are in the normal ranges of our models. We say that such a seller attempts to normalize his reputation scores. We examine how a seller can normalize his N , M, or P score. We restrict ourselves to the case where the seller normalizes exactly one of these scores; cases where a seller attempts to normalize more than one score are left for future work.
6.1 Normalizing an N Score A seller is classified as anomalous according to N if his auctions attract more bids than the auctions of other sellers selling the same
Published in Proceedings of the 12th ACM Conference on Computer and Communications Security, November 2005 product. Therefore, to normalize the N score, the seller must reduce the number of bids in his auctions. We consider three ways in which a malicious seller could achieve this goal: Using fewer shill bids per auction. We assumed that a malicious seller used fraudulent shill bidders to elevate the prices of his auctions. To reduce the average number of bids, the malicious seller could use fewer shill bids per auction. We note that while using fewer shill bids does not eliminate shilling activity, it limits the seller’s ability to inflate prices. Thus, a malicious seller who uses fewer shill bids per auction to defeat our reputation system will be unable to inflate prices as desired. Creating a new identity. A malicious seller could create a new identity, thus starting with an empty profile in our system. Because a new identity does not have a reputation score, including feedback-based reputation as used by eBay, the seller will attract fewer buyers (as shown by recent research [1, 9, 24]). This reduces the average number of bids in the seller’s auctions. Thus, shill bids employed by the seller may not increase the average number of bids above the normality line for N . While this technique helps the seller stay within the normal range of N , losing a good feedback-based reputation translates into lost profits [9, 14, 25]. The malicious seller must decide between losing his old identity, which had a good feedback-based reputation but a poor reputation according to our system, and starting afresh. This example serves to demonstrate how our reputation system can complement a feedback-based reputation system. Adding shill bids to auctions of other sellers. In a classical poisoning attack, an attacker alters the definition of “normal” to include his behavior by poisoning the data used by the anomaly detection system to compute normality. A malicious seller could alter the N model by adding shill bids to auctions of other sellers at a level not expected to win. Sufficient change in the overall average may make the malicious seller’s behavior appear normal. To shill bid at a level high enough to sufficiently alter the average number of bids, the attacker must place a large number of bids in a large number of auctions. The attacker risks winning many auctions, particularly because eBay auctions regularly end with no bids and the malicious seller would be the only buyer bidding on many items. Although a poisoning attack is certainly possible, we believe that it is unlikely to succeed without high financial cost.
6.2 Normalizing an M Score M classifies a seller as anomalous if the average number of bids in his auctions is higher than the average predicted by the minimum starting bids set by the seller. To normalize his M score, a malicious seller has two options: • He can try to decrease the average number of bids in his auction using the techniques discussed in Section 6.1. • He can decrease his minimum starting bids so that the number of bids on his auctions matches the average predicted by M. Reducing the minimum starting bid alone does not ensure that M will classify a seller as normal. As Figure 3 demonstrates, there is a positive correlation between the minimum starting bid and the number of bids in an auction: the lower the minimum starting bid the more bids the auction gets. As the malicious seller lowers his starting bids, the average number of bids in his auctions will increase correspondingly; consequently, the seller still remains anomalous. It may be possible to develop a mathematical model that helps a malicious seller determine the minimum starting bid that would keep his M score within the normal range. Such a model is currently beyond the scope of this paper. We further note
that reducing the minimum starting bid is not an option for sellers who already start their auctions at low prices.
6.3 Normalizing a P Score A seller is classified as abnormal with respect to P if the seller’s cumulative bidder presence curve is above the normal bidder presence curve at the 10% mark and the gap between the cumulative bidder presence curve and the cumulative bidder wins curve is statistically high. To normalize his P score, an attacker should (a) lower the cumulative bidder presence curve so that it falls below the normal bidder presence curve, or (b) reduce the gap between the cumulative bidder presence curve and the cumulative bidder win curve. We consider two techniques a seller may use to achieve these goals. Distributing shill bids. The seller may collude with more bidders and distribute the shill bids between the expanded set of bidders. Distributing the shill bids of a single bidder b among many bidders reduces b’s bidder presence. Therefore, the cumulative bidder presence curve of the seller is shifted towards the normal bidder presence curve. We however note that distributing shill bids among a larger group of bidders does not affect N and M and the seller will have to normalize these metrics as well. Letting some shill bidders win. To reduce the gap between the cumulative bidder presence curve and the cumulative bidder wins curve, the seller could occasionally let some of the shills win. This technique may not be economically appealing to the seller because the seller must pay a fee to the auction house for each successful auction. While we believe that a seller is unlikely to resort to this technique, it may be interesting to formally analyze this technique using an economic model, such as the model of Kauffman and Wood [16].
7. CONCLUSIONS We have presented a new reputation system to rank sellers in online auction houses such as eBay. Our reputation system addresses a concern that is ignored by current reputation systems: identifying sellers who seem to inflate their prices. We used a combination of statistical modeling and automatic anomaly detection to rank sellers and to identify suspicious sellers who use tactics consistent with artificial price inflation. We demonstrated the efficacy and practicality of our ideas by building a reputation system and using it on real-world data gathered from eBay. We showed how our reputation system identified a small group of anomalous sellers. We manually analyzed these sellers’ auctions and found evidence that their auctions are price-inflated. Our findings also revealed that eBay’s reputation system assigned a high reputation to the sellers we identified as anomalous, showing that our system offers new information to potential bidders.
8. ACKNOWLEDGMENTS We thank Somesh Jha and Barton P. Miller for their support and encouragement. We also thank the anonymous reviewers for helping improve the quality of the paper. This work was supported in part by ONR contracts N00014-01-1-0796 and N00014-01-10708. Jonathon Giffin was additionally supported by a Cisco Systems Distinguished Graduate Fellowship.
9. ADDITIONAL AUTHORS Nicholas Kidd Computer Sciences Department University of Wisconsin, Madison
[email protected]
Published in Proceedings of the 12th ACM Conference on Computer and Communications Security, November 2005
10. REFERENCES [1] P. Bajari and A. Hortac¸su. The winner’s curse, reserve prices, and endogenous entry: Empirical insights from eBay auctions. RAND Journal of Economics, 34(2):329–355, Summer 2003. [2] R. J. Bolton and D. J. Hand. Statistical fraud detection: A review. Statistical Science, 17(3):235–255, 2002. [3] R. Brause, T. Langsdorf, and M. Hepp. Neural data mining for credit card fraud detection. In 11th IEEE International Conference on Tools with Artificial Intelligence, pages 103–106, Chicago, IL, Nov. 1999. [4] U. Brinkmann and M. Seifert. ‘Face to Interface’: Zum Problem der Vertrauenskonstitution im Internet am Beispiel von elektronischen Auktionen. Zeitschrift f¨ur Soziologie, 30(1):23–47, Feb. 2001. [5] P. Chaudhuri and W.-Y. Loh. Nonparametric estimation of conditional quantiles using quantile regression trees. Bernoulli, 8:561–576, 2002. [6] M. Chen and J. P. Singh. Computing and using reputations for Internet rating. In 3rd ACM Conference on Electronic Commerce (EC’01), pages 154–162, 2001. [7] C. Dellarocas. Immunizing online reputation reporting systems against unfair ratings and discriminatory behavior. In ACM Conference on Electronic Commerce, Minneapolis, MN, 2000. [8] C. Dellarocas. The digitization of word-of-mouth: Promise and challenges of online feedback mechanisms. Management Science, 49(10):1407–1424, Oct. 2003. [9] S. Dewan and V. Hsu. Trust in electronic markets: Price discovery in generalist versus specialty online auctions. Working paper, available at http://databases.si.umich.edu/ reputations/bib/papers/Dewan&Hsu.doc, University of Michigan, Ann Arbor, MI. [10] R. O. Duda, P. E. Hart, and D. G. Stork. Pattern Classification. John Wiley and Sons, Inc., New York, NY, 2nd edition, 2000. [11] eBay Inc. Policy: Seller shill bidding. Published online at http://pages.ebay.com/help/policies/seller-shill-bidding. html (last accessed May 4, 2005). [12] eBay Inc. First quarter 2005 financial results, April 2005. [13] Z. Hidv´egi, W. Wang, and A. B. Whinston. Shill-proof fee (SPF) schedule: the sunscreen against seller self-collusion in online English auctions. Working paper, Emory University, Atlanta, GA. [14] D. Houser and J. Wooders. Reputation in auctions: Theory, and evidence from eBay. Journal of Economics and Management Strategy, 2004. [15] J. H. Kagel and D. Levin. Common Value Auctions and the Winner’s Curse. Princeton University Press, 2002. [16] R. J. Kauffman and C. A. Wood. Running up the bid: detecting, predicting, and preventing reserve price shilling in online auctions. In International Conference on Electronic Commerce, Pittsburgh, PA, 2003. [17] R. Koenker and G. Bassett. Regression quantiles. Econometrica, 46:33–50, 1978. [18] C. Kr¨ugel, T. Toth, and E. Kirda. Service specific anomaly detection for network intrusion detection. In 17th ACM Symposium on Applied Computing (SAC’02), pages 201–208. ACM Press, 2002.
[19] W. Lee. A data mining framework for constructing features and models for instrusion detection systems. PhD thesis, Columbia University, 1999. [20] W. Lee, S. J. Stolfo, and K. W. Mok. A data mining framework for building intrusion detection models. In IEEE Symposium on Security and Privacy, pages 120–132, Oakland, CA, 1999. [21] Y. Moreau, H. Verrelst, and J. Vandewalle. Detection of mobile phone fraud using supervised neural networks: A first prototype. In International Conference on Artificial Neural Networks (ICANN’97), pages 1065–1070, Lausanne, France, 1997. Springer-Verlag. [22] New York Attorney General. Shill bidding exposed in online auctions. Press release, Nov. 2004. [23] P. Resnick, K. Kuwabara, R. Zeckhauser, and E. Friedman. Reputation systems. Communications of the ACM, 43(12), 2000. [24] P. Resnick and R. Zeckhauser. Trust among strangers in Internet transactions: Empirical analysis of eBay’s reputation system. In M. R. Baye, editor, The Economics of the Internet and E-Commerce, volume 11 of Advances in Applied Microeconomics. Elsevier Science, Amsterdam, Netherlands, 2002. [25] P. Resnick, R. Zeckhauser, J. Swanson, and K. Lockwood. The value of reputation on eBay: A controlled experiment. Working paper, available at http://www.si.umich.edu/ ∼presnick/papers/postcards/, University of Michigan, Ann Arbor, MI. [26] J. A. Rice. Mathematical Statistics and Data Analysis. Duxbury Press, 2nd edition, 1994. [27] H. S. Shah, N. R. Joshi, A. Sureka, and P. R. Wurman. Mining eBay: Bidding strategies and shill detection. In Springer-Verlag, editor, 4th International Workshop on Mining Web Data for Discovering Usage Patterns and Profiles, Edmonton, Alberta, July 2003.