An Ensemble of Convolutional Neural Networks for Unbalanced Datasets: A case Study with Wagon Component Inspection Everlandio Fernandes∗§ , Rafael L. Rocha∗ , Bruno Ferreira† , Eduardo Carvalho†‡ , Ana Carolina Siravenha†‡ , Ana Claudia S. Gomes† , Schubert Carvalho∗ , Cleidson R. B. de Souza¶ , ∗ Instituto
Tecnol´ogico Vale – Bel´em, PA, Brazil Innovation Institute for Mineral Technologies – Bel´em, PA, Brazil ‡ Social Service of Industry - Regional Department of Par´a, SESI, Bel´em PA, Brazil § Institute of Mathematical and Computer Sciences - University of S˜ao Paulo - S˜ao Paulo, Brazil ¶ Universidade Federal do Par´a, Bel´em - PA, Brazil
[email protected],
[email protected],
[email protected],
[email protected] [email protected],
[email protected],
[email protected],
[email protected] † SENAI
Abstract—Railway component inspection is a technique widely used for maintenance because defective components pose safety issues. Nevertheless, finding defective components is a hard task because they are normally hidden by dusty, which poses hard problems for the image segmentation algorithms. To approach this problem, manual inspection by humans is normally used, but it is time consuming, expensive and sometimes dangerous. Meanwhile, automatic approaches that uses machine learning algorithms are also difficult because the datasets are strongly unbalanced. Such datasets usually induce biased classification models that identify new instances as members of the class with the greatest abundance of examples in the training data. In this paper, we propose a new method that combines the use of Convolutional Neural Networks (CNN) with imbalanced learning to address the challenge of using machine learning to identify defective components. Our method was tested with realworld data from images used for wagon component inspection. Moreover, we compared our method with an ensemble of MLP networks using features extraction, such as the LeNet, and a CNN network without ensemble learning. Results indicate that our proposed method produced the higher overall accuracy compared to the other methods. Index Terms—Imbalanced learning, Convolutional Neural Networks, Ensemble, Image Classification.
I. INTRODUCTION Railway component inspection is an important issue because train derailments usually occur when there are failures in wheels or axles, objects on the railways or damage tracks [1]. Moreover, accidents in railways can lead to fatalities and causalities, as well as damage tracks and trains. In addition to financial costs, there might be environmental and social costs associated with repairs where the train derailment takes place. Overall, inspecting railway components that can potentially cause derailment is an important task for the railways maintenance. Machine vision technology has been widely used for inspecting railways components to increase efficiency,
effectiveness, and objectivity [2]. Previous inspections systems that use machine vision include wheel profile and safety appliances [3]. Despite is wide usage, automatic inspection from image understanding is not without challenging: the identification procedure might deal with several stages including image acquisition, preprocessing, feature extraction, and finally classification. The feature extraction stage specially is one that leverages on human knowledge and experience about the problem, thereby a human expert might discover (extract) the best feature set for training a classifier. To address this dependency on human expertise, Convolutional Neural Networks (CNN) have been more and more adopted due to their efficiency in the feature extraction and learning patterns from image data [4]. In other words, CNNs have become of one of the most used deep learning approaches to classify images [4] [5]. One challenge in machine learning, including CNNs, is to learn a model from unbalanced datasets. Such datasets often arise during the acquisition of images in real world scenarios. As an example, the shear pad (from now referred simple as pad) is one of the most important wagon components that need to be inspected. However, large organizations have a large wagon fleet with a wide variety of wagon models. Furthermore, not all wagons have a pad, and only a very small percentage of them have defects. In short, an automatic wagon inspection system needs to deal with a multi-class dataset with a very high imbalance rate. Meanwhile, recently published studies [6] [7] [8] [9] have reported the successful use of ensembles of classifiers for classification with unbalanced datasets, where each classifier is induced by a different sample from the original dataset [10]. Ensembles are designed to increase the accuracy of their base classifiers by combining them through a consensus function or operator [11]. Moreover, ensembles have a greater capacity for generalization than their base classifiers; this was formally presented in the study carried out in [12].
In this context, this work seeks the use of CNN together with ensembles to correctly classify, through images, the condition in which a wagon component is found. More specifically, we used three types of classifiers to evaluate the pads: (i) the first one is CNN (LeNet, CNN architecture described in [13]; (ii) Ensemble of Multi Layer Perceptron (MLP); (iii) Ensemble of Convolutional Neural Networks. The latter being our main proposal for solving the problem described. It is called from now on by Imbalanced Learning with Ensemble of Convolutional Neural Network - ILEC. The rest of this paper is organized as follows. The next section presents the related works associated with our method. Section III describes the method that we propose. The following section briefly describes the real-world problem where we tested our method. Section V describes the methodology we used to test our method. Section VI focuses on our experimental results and, finally, the last section concludes the paper presenting our plans for future work.
the learning process. The MOGP approach is adapted to evolve diverse solutions into an ensemble, aiming at improving the general classification performance. Wang and colleagues [22] investigate two types of multiclass imbalance problems, i.e., multi-minority and multimajority. First, they investigate the performance of two basic resampling techniques when applied to these problems. They conclude that in both cases the predictive performance of the methods decreases when the number of imbalanced classes increases. Motivated by these results, the authors investigate ensemble approaches using class decomposition (the oneagainst-all strategy) and approaches not using class decomposition. According to their experimental results, the use of class decomposition did not provide any advantages in multiclass imbalance learning.
II. R ELATED W ORK
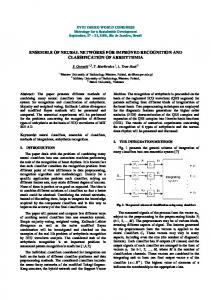
The primary objective of the proposed method is to build an ensemble of convolution neural network to deal with imbalanced image datasets. For this, the proposed method uses an imbalanced learning technique to construct a series of classifiers that aims to not harm the minority classes. To make the ensemble more accurate and with greater generalization power, a pruning technique based on a ranking of nondominance between diversity and accuracy of the classifier is applied to the process. Figure 1 outlines the proposed method, which is detailed below. Hansen and Salamon [23] have demonstrated that under specific conditions an ensemble’s expected error rate for a new instance tends to zero as the number of base classifiers tends to infinity. To do so, the base classifiers must have individual accuracy above 50% and be as diverse as possible. Two classifiers are considered diverse if they make mistakes in different instances of the same test dataset. Therefore, diversity and accuracy should be the main objectives when choosing the base classifiers that make up the ensemble. For this reason, the first action of our method is to repeatedly apply random undersampling to the training dataset to obtain a series of samples with balanced subsets of images. In order to achieve a diverse set of samples that also takes into account the minority class, ILEC selects only 80% of the most minority class in each sample. For example, if the class with the least number of instances has ten images and the dataset has three classes, each sample will have 24 images (0.8x10x3), with eight images in each class. After the sampling process, each subset of images induces a CNN model that is validated using the entire training dataset. That is, the accuracy of the CNN model is calculated verifying its effectiveness in the complete training dataset. The accuracy measure used in this research was the G-mean [7]. The geometric mean of the classifier correction, G-mean calculation procedure, produces low values if the classifier presents low precision in at least one of the classes. That is, a low G-mean value indicates that the classifier has significant
When dealing with imbalanced data sets, the propose solutions can be categorized in two levels: In (i) data and (ii) algorithm level. For the first, the dataset is altered to achieve balance in the class distribution [14]–[16]. In the second, the algorithm is modified to give higher importance to the minority classes [17], [18]. Works studying resample techniques for changing the class distribution can be found in the literature [14], [19] and, empirically, show that a preprocessing of the classes distribution is frequently useful. The resampling techniques can be oversampling, undersampling or a combination of both. In the oversampling the dataset is expanded to make minority class match the size of the majority class. In the undersampling the majority class is reduced until the size of the minority class. One of the undersampling strategies to reduce the majority is called Random Undersampling (RUS), however this simple technique may remove useful data. To alleviate such an effect, a directed undersampling may detect and remove less representative instances. The One-sided Selection (OSS) technique [20] use this strategy. As stated previously, recently published studies have reported the successful use of ensembles of classifiers for classification with unbalanced datasets. Several methods that take into account diversity and accuracy of base classifiers have been proposed. Multiobjective Genetic Sampling (MOGASamp) [21] constructs an ensemble of classifiers induced from balanced samples in the training data set. For this, a customized multiobjective genetic algorithm is applied, combining instances from balanced samples and guided by the performance of classifiers induced by those samples. This strategy aims to obtain a set of balanced samples from the imbalanced data set and induce classifiers with high accuracy and diversity. Bhowan and colleagues [6] developed a multiobjective genetic programming (MOGP) approach that uses accuracies of the minority and majority classes as competing objectives in
III. I MBALANCED L EARNING WITH E NSEMBLE OF C ONVOLUTIONAL N EURAL N ETWORK (ILEC)
Fig. 1: Proposed method Workflow. Balanced samples are generated from the unbalanced dataset, each sample will be applied to a CNN, with the results obtained (accuracy and diversity) passed by a non-dominant rank followed by the application of the pruning technique to obtain the ensemble result.
faults in at least one class, which makes this classifier less useful in practice. To verify the heterogeneity of the models previously generated, the measure of diversity of classifiers Pairwise Failure Crediting (PFC) [24] is also calculated from the CNN models. This measure is calculated for each model using a pair-wise comparison with all models. It indicates how much a model’s response differs from the whole group. The proposed method uses the PFC diversity measure due to the good results in imbalanced learning presented in [6] and [21]. Accuracy and diversity are often conflicting objectives, since two classifiers with high accuracy usually have low dissimilarity. For this reason, ILEC proposes the generation of a non-dominance rank [25] to select which classifiers will compose their CNN ensemble through a pruning process. The non-dominance ranking is a well-known measure of Paretobased dominance that computes the number of solutions in a population that dominate a particular solution considering two or more objectives. A non-dominated solution will have the lowest value in the ranking, i.e., 0, while high ranking values indicate low-performance solutions, that is, solutions dominated by many others. The pruning process used by ILEC sequentially removes the classifiers that have the highest non-dominance values. This indicates that the first classifiers to come out of the ensemble are those with lower values of accuracy and diversity in the population. Tie situations are decided randomly. Initially and after each pruning iteration, i.e., after a classifier is removed, the accuracy of the ensemble is calculated by majority vote. The pruning process is only confirmed if the resulting ensemble’s accuracy is no worse than that of the ensemble of the previous iteration. The process repeats until the elimination of a classifier causes a decrease in the accuracy of the resulting ensemble, or when only the classifiers that are non dominated by any other remain, that is, classifiers with the ranking value equal to 0. When a new example is presented to the ensemble, its class is determined by the majority vote1 considering the 1 Note that other voting strategies could be used without large impact in our method.
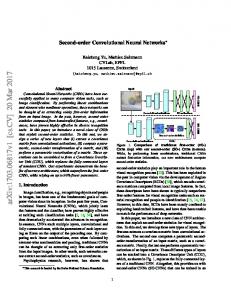
output of each base classifier. IV. S TATEMENT OF THE PROBLEM In many railway companies, the wagon maintenance is performed by an employee, who has to evaluate, in a given period of time, several items including the compression bar, triangle, an adapter of the bearing box, and a plate of support of the coupling. As wagons are often the most representative asset in railway operations, this maintenance should be more accurate and optimized. The visual inspection by humans place employees in risk situation since they need to be in dangerous places (for instance, very close to the trains) in order to inspect those items [26]. To be more specific, we are interested in a wagon component called pad. The pad is part of the railway truck, which is a structure underneath the wagon, or locomotive, to which other important components are attached, such as wheels, hence, etc. Typically two trucks are fitted to the wagon and have 4 wheels to support the cart. The pad is composed of metal and rubber and has a role similar to a damper. It is positioned between each of the side frame pedestals and the corresponding roller bearing adapter [27]. This work is part of a large project aiming the construction of an automatic inspection system for wagon components for the Vale S.A. Vale is the second largest mining company in the world. In Brazil the company operates approximately 2,000 kilometers of railroad tracks, and this type of transportation plays a fundamental role to its operations because the company has one of the biggest trains in the world, made up of four locomotives and 330 wagons. Furthermore, the company transports iron ore through its railways 24 hours per day, 7 days per week. Due to a large quantity of wagons, models, and the aggressive operating environment, the pad may suffer all kinds of damages. A camera system capture images that are processed by image processing and computer vision algorithms. Specifically, in this paper, we test our method in a task of pad classification based on the collected images. There might be 3 classes: broken pad, absent pad and pad without problems.
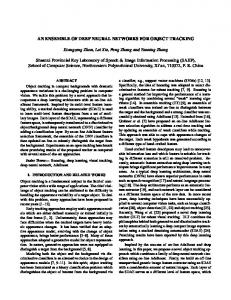
Fig. 2: Pad absent Fig. 3: Undamaged pad
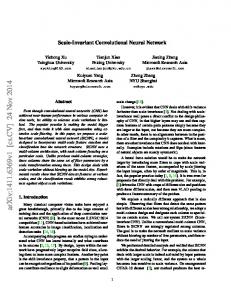
The details of how we conducted our tests are described in the following section. V. E XPERIMENTS This session describes the methodology used in this paper, as well the materials used. The subsection V-A presents the description of the dataset used to train and test the various classification methods. The subsection V-B describes the methodology of texture feature extraction, by Discrete Wavelet Transform and Gray-level Co-Occurrence Matrices, and the post-processing steps of feature vector composition and data normalization. And lastly, the subsection V-C explains about the deep learning methods used in the tests. A. Database Real images captured to compose the database were taken from the entire truck and reduced to the region of interest (pad). To standardizing the final resolution of the images was set to (128×256×1) (rows ×columns×channels). Due camera resolution, the images were captured in gray scale, it explains the third dimension in the final resolution. The database has a total of 334 images, divided into 3 distinct classes or labels, which are: class 1 (pad absent Fig. 2), class 2 (undamaged pad - Fig. 3) and class 3 (damaged pad - Fig. 4), with 53, 241 and 40 images, respectively. It is important to notice that these images were collected from real trucks, and pads, through our industrial partner. This shows an unbalanced dataset where a large number of images is concentrated in undamaged pad class. The dataset composed of 334 images were divided 80% for training and 20% for testing. B. Texture analysis To prepare the input of the ANN, Discrete Wavelet Transform (DWT) and Gray-Level Co-Occurrence Matrices (GLCM) were used to generate the feature vector with 128 coefficients. The measures of four energy, four moments and deviation of DWT directional decompositions (vertical, horizontal and diagonal) in 4 levels generated 108 coefficients of a feature vector. Five attributes were extracted from GLCM, they are the angular second moment (ASM), inverse different moment (IDM), entropy, contrast and correlation at four distinct distances, which in degrees are α = {0◦ , 45◦ , 90◦ , 135◦ }, obtaining 20 coefficients. Then the feature vector is normalized with min-max normalization technique, used for instance by Han et. al [28], and Siravenha and Carvalho [29].
Fig. 4: Damaged pad
In experiments with this technique, repeated random undersampling in the training dataset generate ten balanced samples. Therefore, each of these samples induces an MLP classifier, producing an ensemble of MLPs. A simple but efficient consensus function, majority vote, indicates the final response of the classification system. The experiments were repeated using different amounts of epochs in MLP training — 50, 100 and 500. C. Deep Learning Approach The feature extraction is a costly and complex process, which requires knowledge from the domain. The adequate selection of the features to be extracted greatly affect the performance of the system. The Convolutional Neural Networks (CNN) [30] is at the state of the art for the pattern recognition task. Its differential is the integration of the feature extraction with the classification. The network can be divided into two parts, the first is the feature extractor, that combines convolutional and pooling layers, the second part is usually a fully connected layer responsible for the classification. 1) LeNet: One of the first CNN model for training images [4], firstly used for handwriting recognition, the LeNet is one of the principal models to compare others methods and architectures. The network is composed of seven layers, with two convolutional (conv1 and conv2), two pooling (pool1 and pool2) and three fully connected (fully1, fully2 and fully3). Among many points are important in LeNet, such as max pooling, different activation functions (sigmoid and tanh nonlinearities), fully connected layers for classification. The fundamental difference in this work is related to the use of the number of fully connected layers, which in this work we use 2 (fully1 and fully2), and the number of neurons used in fully1, which in this case is 500. Experiments with this technique test its efficiency in the problem addressed by this study using the complete training dataset as input to the network. It is also being evaluated its efficacy with different amount of epochs to train the network — 20 and 50. 2) CNN Architecture: The CNN architecture that composes the ILEC proposal was previously published in [31] and [13], and consist of two convolutional layers (conv1 and conv2), two fully connected layers (fully1 and fully2) and one MaxPooling layer (pool1). The sequence that the layers has been implemented is conv1, conv2, pool1, fully1 and fully2.
TABLE I: Comparison of approaches. The MPL, LeNet, CNN, and ILEC approaches were compared at different epochs according to the G-mean, Standard Deviation (SD) and accuracy of each of the classes.
Ensemble MLP - Feature Extraction LeNet CNN
ILEC
50 ep. 100 ep. 500 ep. 20 ep. 50 ep. 20 ep. 50 ep. 10 ep. 20 ep. 30 ep. 40 ep. 50 ep.
Conv1 is the input layers that receives a gray scale image with resolution of 128x256 as input, has a kernel size of 3 and strides of 2 with ReLU activation function and 32 output filters. The next layer (conv2) has the same kernel size, stride and activation function of conv1, but with 64 output filters. Both conv1 and conv2 is no padding. The third layer is pool1 and has pool size and stride of 2 with no padding. The next layer is fully1 with 128 outputs neurons with ReLU activation function. The last layer is a fully connected with 3 outputs by softmax activation function corresponding to the probability distributions of three classes with cross-entropy loss function. This proposal of Convolutional Neural Network is the base classifier used by ILEC. Thus, experiments with this CNN are divided into two groups. The first one without any treatment for the unbalanced dataset. In this way, experiments use the complete training dataset with different amounts of epochs to train the CNN — 20 and 50. The second is as part of ILEC, described in Section III. ILEC initially produces ten balanced samples, using in each sample only 80% of the examples of the class with the least amount of instances (minority class), as described in that section. ILEC also is tested with different amount of epochs — 10, 20, 30, 40 and 50. VI. R ESULTS Table I summarizes the results of the experiments we described in the previous section. As previously stated, we trained our approach with different sets of epochs, namely: 10, 20, 30, 40, and 50. We can notice that after 20 epochs, the convolutional neural networks begin to show signs of overfitting, therefore reducing the overall accuracy of our method. Therefore, in the rest of this section we will focus specifically on the ILEC trained with 20 epochs. According to Table I, the proposed method has the best overall accuracy (G-mean: 0.9711) when compared to other methods. The closest approach to ILEC is the LeNet with 50 epochs (G-mean: 0.9622). However, the class of most interest in this study, i.e., damaged pad (class 3), presents a much lower result (0.9000) when compared to the proposed method (0.9922). It is also important to notice that the proposed method has the smaller standard deviation among all the tested methods.
G-mean 0.8137 0.8728 0.9402 0.8413 0.9622 0.8751 0.8548 0.9358 0.9711 0.9668 0.9664 0.9435
SD 0.0353 0.0304 0.0261 0.3004 0.0220 0.1551 0.3006 0.0247 0.0166 0.0220 0.0225 0.0230
class 1 0.7364 0.8000 0.9091 0.9636 0.9909 0.9091 0.9727 0.9988 0.9943 0.9955 1.0000 0.9864
class 2 0.7653 0.8347 0.9163 0.9694 1.0000 0.9735 1.0000 0.9079 0.9468 0.9452 0.9398 0.9398
class 3 0.9625 1.0000 1.0000 0.8000 0.9000 0.8125 0.7875 0.9234 0.9922 0.9875 0.9875 0.9656
When we compare the two tested ensembles, it is possible to note that both MLPs (100, and 500 epochs) present a 100% accuracy for class 3 compared to ILEC (99.22%). However, the approach using MLP networks are heavily dependent on the feature extraction method used, as in [32]. Meanwhile, the proposed method is based on convolutional networks where such extraction is not needed [4]. Rocha and colleagues [13] have developed a network architecture specific for pad classification. This is the CNN method described on section V-C and mentioned on Table I. Given the focus of the CNN, we decided to adopt this as the base classifier in the ILEC. Another option would be to use the Lenet, but this is a classic classifier [4]. Again, it is worth noting that ILEC’s results are better that CNN’s. This suggests that ILEC might be able to improve the results of any convolutional network that is designed for a specific goal, since the base classifier is only one component of the proposed method. This, however, needs to be further explored. Finally, it is important to mention that in this paper we have not taken into account the time necessary to train the different methods. We do recognize that this is an important aspect to be addressed. Since we are using an ensemble of convolutional networks, we believe our training time will be reduced because these networks will be trained in parallel. We plan to validate this in our future work. VII. C ONCLUSIONS AND F UTURE W ORK In this paper, we proposed a new method that uses an ensemble of convolutional neural networks for unbalanced datasets. We tested our method with 3 other methods: an ensemble of MLP networks, the LeNet, and the CNN networks. We used images from the pad, a wagon component. Such images are used to identify defective components in a railway inspection process. The results suggest that the proposed method has the best overall accuracy, the smaller standard deviation among all the tested methods, while at the same time has a good accuracy for all classes, especially on the class of interest. We plan to test our method with additional industrial datasets to further validate ILEC. In addition, an interesting question is whether the proposed method is able to improve the results of other convolutional networks, since these networks
will be only one component of the proposed method. As previously mentioned, we will assess the training time of our methods to find out its potential impact in real-world scenarios. Finally, we will augment our dataset with Salt and Pepper, Gaussian and Poison noises besides rotation, translation, and reduction of pixels in the image [33]. ACKNOWLEDGMENT The authors are grateful for the financial support to CNPq (processes 440880/2013-0, 310468/2014-0, 443111/2015-4, and 420801/2016-2) and FAPESP (process 2013/11615-6). R EFERENCES [1] M. Macucci, S. Di Pascoli, P. Marconcini, and B. Tellini, “Derailment detection and data collection in freight trains, based on a wireless sensor network,” IEEE Transactions on Instrumentation and Measurement, vol. 65, no. 9, pp. 1977–1987, 2016. [2] D.-B. Perng, H.-W. Liu, and C.-C. Chang, “Automated smd led inspection using machine vision,” The International Journal of Advanced Manufacturing Technology, vol. 57, no. 9, pp. 1065–1077, Dec 2011. [Online]. Available: http://dx.doi.org/10.1007/s00170-0113338-y [3] E. Resendiz, J. M. Hart, and N. Ahuja, “Automated visual inspection of railroad tracks,” IEEE Transactions on Intelligent Transportation Systems, vol. 14, no. 2, pp. 751–760, June 2013. [4] Y. LeCun, L. Bottou, Y. Bengio, and P. Haffner, “Gradient-based learning applied to document recognition,” in Proceedings of the IEEE, vol. 86, no. 11, 1998, pp. 2278–2324. [Online]. Available: http://ieeexplore.ieee.org/document/726791/ [5] I. Goodfellow, Y. Bengio, and A. Courville, Deep Learning. MIT Press, 2016, http://www.deeplearningbook.org. [6] U. Bhowan, M. Johnston, M. Zhang, and X. Yao, “Evolving Diverse Ensembles using Genetic Programming for Classification with Unbalanced Data,” IEEE Transactions on Evolutionary Computation, vol. 17, no. 3, pp. 368–386, 2013. [7] Q.-Y. Yin, J.-S. Zhang, C.-X. Zhang, and N.-N. Ji, “A Novel Selective Ensemble Algorithm for Imbalanced Data Classification Based on Exploratory Undersampling,” Mathematical Problems in Engineering, vol. 2014, pp. 1–14, 2014. [8] J. Wang, P.-l. Huang, K.-w. Sun, B.-l. Cao, and R. Zhao, “Ensemble of Cost-Sensitive Hypernetworks for Class-Imbalance Learning,” in 2013 IEEE International Conference on Systems, Man, and Cybernetics. IEEE, Oct. 2013, pp. 1883–1888. [9] Y. Qian, Y. Liang, M. Li, G. Feng, and X. Shi, “A resampling ensemble algorithm for classification of imbalance problems,” Neurocomputing, vol. 143, pp. 57–67, Nov. 2014. [10] M. Galar, A. Fern´andez, E. B. Tartas, H. B. Sola, and F. Herrera, “A review on ensembles for the class imbalance problem: Bagging-, boosting-, and hybrid-based approaches.” IEEE Transactions on Systems, Man, and Cybernetics, Part C, vol. 42, no. 4, pp. 463–484, 2012. [11] Z.-H. Zhou, “Ensemble learning.” in Encyclopedia of Biometrics, S. Z. Li and A. K. Jain, Eds. Springer US, 2009, pp. 270–273. [12] K. Tumer and J. Ghosh, “Analysis of decision boundaries in linearly combined neural classifiers,” Pattern Recognition, vol. 29, pp. 341–348, 1996. [13] R. L. Rocha, A. C. Q. Siravenha, A. C. S. Gomes, G. L. Serejo, A. F. B. Silva, L. M. Rodrigues, J. Braga, G. Dias, S. R. Carvalho, and C. R. B. de Souza, “A deep-learning-based approach for automated wagon component inspection (in press),” in In proceedings of SAC 2018: Symposium on Applied Computing, Pau, France, April 9-13, 2018, 8 pages, 2018. [14] N. V. Chawla, K. W. Bowyer, L. O. Hall, and W. P. Kegelmeyer, “Smote: Synthetic minority over-sampling technique,” Journal of Artificial Intelligence Research, vol. 16, pp. 321–357, 2002. [15] Z.-H. Zhou and X.-Y. Liu, “Training cost-sensitive neural networks with methods addressing the class imbalance problem,” Knowledge and Data Engineering, IEEE Transactions on, vol. 18, no. 1, pp. 63–77, Jan. 2006. [Online]. Available: http://dx.doi.org/10.1109/tkde.2006.17
[16] Y. Sun, M. S. Kamel, A. K. C. Wong, and Y. Wang, “Cost-sensitive boosting for classification of imbalanced data,” Pattern Recogn., vol. 40, no. 12, pp. 3358–3378, Dec. 2007. [Online]. Available: http://dx.doi.org/10.1016/j.patcog.2007.04.009 [17] J. R. Quinlan, “Improved estimates for the accuracy of small disjuncts,” Machine Learning, vol. 6, no. 1, pp. 93–98, 1991. [18] B. Zadrozny and C. Elkan, “Learning and making decisions when costs and probabilities are both unknown,” in Proceedings of the seventh ACM SIGKDD international conference on Knowledge discovery and data mining. ACM, 2001, pp. 204–213. [19] Y. Sun, A. K. C. Wong, and M. S. Kamel, “Classification of imbalanced data: a review,” IJPRAI, vol. 23, no. 4, pp. 687–719, 2009. [Online]. Available: http://dx.doi.org/10.1142/S0218001409007326 [20] M. Kubat and S. Matwin, “Addressing the curse of imbalanced training sets: One-sided selection,” in In Proceedings of the Fourteenth International Conference on Machine Learning. Morgan Kaufmann, 1997, pp. 179–186. [21] E. R. Q. Fernandes, A. C. P. L. F. de Carvalho, and A. L. V. Coelho, “An evolutionary sampling approach for classification with imbalanced data,” in Neural Networks (IJCNN), 2015 International Joint Conference on. IEEE, 2015, pp. 1–7. [22] S. Wang and X. Yao, “Multiclass imbalance problems: Analysis and potential solutions,” IEEE Transactions on Systems, Man, and Cybernetics, Part B (Cybernetics), vol. 42, no. 4, pp. 1119–1130, Aug 2012. [23] L. K. Hansen and P. Salamon, “Neural network ensembles,” IEEE Trans. Pattern Anal. Mach. Intell., vol. 12, no. 10, pp. 993–1001, Oct. 1990. [Online]. Available: http://dx.doi.org/10.1109/34.58871 [24] A. Chandra and X. Yao, “Ensemble learning using multi-objective evolutionary algorithms,” J. Math. Model. Algorithms, vol. 5, no. 4, pp. 417–445, 2006. [Online]. Available: http://dx.doi.org/10.1007/s10852005-9020-3 [25] K. Deb, A. Pratap, S. Agarwal, and T. Meyarivan, “A fast and elitist multiobjective genetic algorithm: Nsga-ii,” Trans. Evol. Comp, vol. 6, no. 2, pp. 182–197, Apr. 2002. [Online]. Available: http://dx.doi.org/10.1109/4235.996017 [26] J. Hart, E. Resendiz, B. Freid, S. Sawadisavi, C. Barkan, and N. Ahuja, “Machine vision using multi-spectral imaging for undercarriage inspection of railroad equipment,” in Proceedings of the 8th World Congress on Railway Research, Seoul, Korea, 2008. [27] S. IWnicki, Handbook of Railway Vehicle Dynamics. CRC Press, 2006, p. 548. [28] J. Han, M. Kamber, and J. Pei, Data mining: concepts and techniques. Morgan Kaufmann - Elsevier, 2012. [29] A. C. Siravenha and S. R. Carvalho, “Plant classification from leaf textures,” in 2016 International Conference on Digital Image Computing: Techniques and Applications, DICTA 2016, Gold Coast, Australia, November 30 - December 2, 2016, 2016, pp. 1–8. [Online]. Available: https://doi.org/10.1109/DICTA.2016.7797073 [30] Y. LeCun, “Generalization and network design strategies,” Connectionism in perspective, pp. 143–155, 1989. [31] R. L. Rocha, A. C. Q. Siravenha, A. C. S. Gomes, G. L. Serejo, A. F. B. Silva, L. M. Rodrigues, J. Braga, G. Dias, S. R. Carvalho, and C. R. B. de Souza, “Avaliao de tcnicas de deep learning aplicadas identificao de peas defeituosas em vages de trem,” in Workshop of Industry Applications (WIA) in the 30th Conference on Graphics, Patterns and Images (SIBGRAPI’17), E. Clua and F. L. C. Pdua, Eds., Niteri, RJ, Brazil, october 2017. [Online]. Available: http://sibgrapi2017.ic.uff.br/ [32] C.-M. Pun and M.-C. Lee, “Extraction of shift invariant wavelet features for classification of images with different sizes.” IEEE Transactions Pattern Analysis and Machine Intelligence, vol. 26, no. 9, pp. 1228– 1233, 2004. [33] R. C. Gonzalez and R. E. Woods, Digital image processing. Upper Saddle River, N.J.: Prentice Hall, 2008.