Detection of Brain Tumors from MRI using Gaussian RBF kernel based Support Vector Machine Satish Chandra*1, Rajesh Bhat *2, Harinder Singh*3, D.S.Chauhan*4 Department of CSE & IT, Jaypee University of IT, Solan,HP, India *2 Department of Computer Science, Indian Institute of Technology, New Delhi, India *3 Department of Mathematics, Jaypee University of IT, Solan, HP, India *4 Department of Electronics, Uttarakhand Technical University , Dehradun, India
[email protected] ,
[email protected]
*1, Corresponding author
Abstract The Support Vector Machine (SVM) is a powerful classification technique that has been used extensively in the field of medical imaging. A model based on SVM with Gaussian RBF kernel is proposed here for the automatic detection of brain tumor from MRI images. Various textural characteristics of the MRI images of human brain are extracted to construct a feature set. These features sets are then used to train the classifier. The results obtained are compared with another powerful efficient classifier AdaBoost. AdaBoost classifies data according to the law of majority vote by base classifiers (ensemble learning). The comparative results show that though the difference between the performance measures is marginal, SVM gives higher precision and low error rates.
Keywords MRI, Brain Tumors, Classification, SVM, AdaBoost, Gaussian RBF kernel.
1. Introduction MRI is primarily a medical imaging technique most commonly used in radiology to visualize the internal structure and function of the body. It provides an unparalleled view inside the human body. The level of detail we can see is extraordinary compared with any other imaging modality. MR Imaging is based on the observation of the relaxation that takes place after the RF pulse once applied in a human body, has stopped. The return of the excited nuclei from the high energy to the low energy state is associated with the loss of energy to the surrounding nuclei. The time elapsed in longitudinal return of the net magnetization to its maximum length in the direction of the magnetic field is termed as T1 relaxation time. Whereas, T2 relaxation or spin-spin relaxation, occurs when the
spins in the high and low energy state exchange energy but do not loose energy to the surrounding lattice. The T1 and T2 time constants dictate the shape of the exponential recovery and decay curves of the longitudinal and transverse magnetization, respectively. Here we present a model based on classification by SVM which can be used to identify the tumor pattern from MRI. We compare the result of classification with that obtained from the implementation of another classifier AdaBoost. The paper is organized as follows. Section 2 presents a brief summary of the important existing techniques for brain tumor pattern recognition. In section 3, we present a model based on SVM for the detection of presence of tumors. Section 4 consists of implementation of the proposed model. Finally, the performance of the proposed model is compared with the AdaBoost.
2. Related Works This section focuses on some of the significant approaches proposed by the researchers. The methods that we have examined are unsupervised, supervised methods and some hybrid approaches.
2.1. Unsupervised Methods Mark Schmidt [1] in his Master’s thesis has given a detailed study of the work done in the automatic tumor detection. In recent years, unsupervised classification techniques such as self organization map (SOM) and fuzzy c-means combined with feature extraction techniques [2] have been used for biomedical image classification. The main contribution in using unsupervised methods for MRI segmentation have been by Gibbs et al. [3], Zhu and Yan [4], Ho et al.[5]. One of the most extensively validated system was presented by Clark et al.[6]. Two main components of this system are Fuzzy C-Means
(FCM) clustering and a linear sequence of humanengineered knowledge-based rules and operations.
like tumor, white matter, gray matter etc.[10]. Benamrane et al developed a method for detection of tumors in medical images that uses a hybrid of fuzzy neural networks and expert system [11].
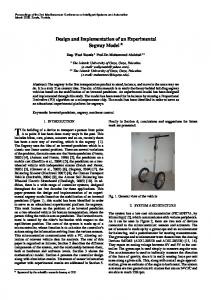
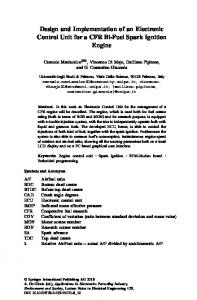
3. Proposed model Classification is the most widely used strategy used for recognizing the objects based on its features. Figure 2 shows the classification model proposed by us to identify the tumors present in brain. Two major parts of the model are feature extraction and classification. The textural features obtained from the MR images are given as input to the classification part of the model. The classifier used is the Support Vector Machine (SVM) with Gaussian RBF kernel. Figure 1. Sample MRI images of brain. The arrows show the presence of tumors.
2.2 Supervised Segmentation Recent work has shown that classification of human brain in magnetic resonance (MR) images is possible via supervised techniques such as artificial neural networks and SVM. Advantage of supervised method is automatic discovery of required pattern in the data rather than the manual experimentation and intuition. Supervised classification involves both a training phase that uses labeled data to learn a model that maps from features to labels, and a testing phase that is used to assign labels to unlabeled data based on the measured features. The main contributions in these methods have been given by Mazzara et al.[7] and Garcia and Moreno [8]. Another successful implementation of SVM in the brain tumor detection has been done by H. Selvaraj et al.[25].
3.1. Feature Extraction Feature extraction can be seen as a special kind of data reduction of which the goal is to find a subset of informative variables based on image data. It is used for reducing the computation cost and controlling the dimension. It is a pre-processing step which removes distracting variance from a dataset, so that the classification algorithm performs better [12]. Segmentation of MR images is based on sets of features that can be extracted from the images, such as pixel intensities, which in return can be used to calculate other features such as edges and texture [13]. Rather than using all the information in the images at once, feature extraction and selection breaks down the problem of segmentation to the grouping of feature vectors [14]. Selection of good feature is the key to successful classification [15].
MR Image preprocessing
Feature Extraction
Feature Vector
2.3 Hybrid techniques One of the recently discovered methods for MR Image classification is Color-Based K-Means Clustering Segmentation [9]. This segmentation algorithm uses K-means to convert a given gray-level MR image into a color space image and then separate the position of tumor objects from other items of an MR image. This method can successfully achieve segmentation for MR brain images to help pathologists distinguish exactly lesion size and region. Murugavalli and Rajamani proposed a hybrid technique combining the advantages of SOM (Self Organizing Map ) and FCM(fuzzy c means) and implemented for the MRI image segmentation process to detect various tissues
Feature Vector Classifier (SVM / AdaBoost)
Training
Testing
Result (TP / TN / FP / FN) Figure 2. Proposed model We have applied a simple but effective feature extraction method to describe the brightness and
texture of the images. The following statistical features are computed as described in the equation (1) and (2). Mean
x
1 X *y
Variance V =
x
y
i 1
j 1
x(i, j )
V
x
1 X *Y
(1)
i 1
K ( xi , jx )=i x j x
Polynomial:
d K(xi,x j ) =(γx i x j +r) ,γ> 0 (5)
(4)
T
Radial Basis Function (RBF):
y
( x(i, j ) x)
T
Linear:
2
(2)
K(x i ,x j ) exp(γ|| x i x j ||2 ),γ> 0
j 1
Where, x(i, j) is the image intensity for the location (i, j) and X and Y are the number of pixels in rows and columns of images respectively Pattern recognition is the sequence of steps that must be performed after appropriate features have been detected.
Sigmoid: Here
(6)
T
K(xi,x j ) = tanh(γxi x j +r) (7)
γ, r and d are kernel properties.
We propose to use a kernel termed as Gaussian RBF given by
|| x i x j ||2
3.2 Overview of SVM
K(x i ,x j ) exp(
SVMs are the most well known learning systems based on kernel methods. First introduced by Vapnik [16], it is as an alternative to neural networks, and that has been successfully employed to solve clustering problems, specially in biological applications. It performs classification by constructing an Ndimensional hyperplane that optimally separates the data into two categories. A classification task usually involves training and testing data which consist of some data instances. Each instance in the training set contains one “target value" (class labels) and several “attributes" (features). The goal of SVM is to produce a model which predicts target value of data instances in the testing set which are given only the attributes. Given a training set of instance-label pairs ( x, y) {( x1, y1 ),( x2 , y2 ).......( xn , yn )} where
Where = width of kernel in SVM. Our interest is to vary the width to eliminate the inconsistency of the coexisting over-fitting and under-fitting in SVM. Since correlation among image pixels is localized, global kernels such as polynomial kernels are inadequate for image classification. Barla et al.[18] discussed two image kernels: histogram kernels and Hausdorff kernels. Inspired by the positive results of RBF kernel in face recognition [19], we have used Gaussian RBF kernel in this work.
N
xn R y and yn {1, 1} , SVM requires the solution of the following optimization problem[17]:
min w ,b , ξ
l 1 T w w C ξi 2 i 1
Subject to
yi (wT ( xi ) b) > 1 ξi ξ i >0
(3)
Here training vectors xi are mapped into a higher (maybe infinite) dimensional space by the function Φ .Then SVM finds a linear separating hyperplane with the maximal margin in this higher dimensional space. C > 0 is the penalty parameter of the error term. Furthermore, T K(x i ,x j ) = Φ(x i ) Φ(x j )
is
called
the
kernel function. The kernel is used to transform data from the input (independent) to the feature space. Following are the four basic types of kernel functions:
2 2
)
(8)
3.3. AdaBoost AdaBoost (Adaptive Boosting) is a machine learning algorithm, formulated by Yoav Freund and Robert Schapire [20]. It is a meta-algorithm, and can be used in conjunction with many other learning algorithms to improve their performance. AdaBoost is adaptive in the sense that subsequent classifiers built are tweaked in favor of those instances misclassified by previous classifiers.It consists of generating an ensemble of weak classifiers (which need to perform only slightly better than random guessing) that are combined according to an arbitrarily strong learning algorithm [21]. It has been applied with great success to several benchmark machine-learning problems using rather simple learning algorithms such as decision trees or linear regression [22]. The AdaBoost algorithm takes as input a labeled training set represented by (9) ( x, y) {( x1, y1 ),( x2 , y2 ).......( xn , yn )} N
where
xn R y and yn {1, 1} . It calls a weak
or base learning algorithm iteratively. After each iteration, a certain confidence weight Dt ( xi ) is given (and updated) to each training sample. The
weights of incorrectly classified samples are increased so that the weak learner is forced to focus on the hard patterns in the training set. The task of the base learner reduces to find a hypothesis ht : x y for the distribution Dt . At each iteration, the goodness of a
For all the MRI images the pixels were extracted and their spatial coordinates and intensities were used for constructing the Gray Level Co-Occurrence Matrixes (GCM). Haralick method [26] was used for the extraction of features from MRI. The texture measures computed are
weak hypothesis is measured by its error given by,
Єt P[ht ( xi ) ( yi )] Di
(10)
Once the weak hypothesis has been calculated, AdaBoost chooses a parameter given by,
αt (1/ 2) ln((1 Єt ) / Єt )) .
(11)
i)
ii) iii) iv) v)
The distribution is next updated in order to increase the weight of samples misclassified and to decrease the weight of correctly classified patterns.
4. Experimental Results and Discussions The proposed model was implemented in three steps, viz MR image data acquisition, feature extraction and application of the classifiers for classifying the MR images into two groups, normal and abnormal. MATLAB was used for the feature extraction purpose. We used SVMlight [23] software for classification. A regularized version of the AdaBoost algorithm (in MATLAB) known as AdaBoost-Reg [24] was implemented for comparing the performance of SVM.
4.1 MR image data acquisition A total 86 abnormal and 48 normal axial images were obtained from hospitals and radiology centres of North India. The images under study were acquired using the Siemens 1.5-Tesla MR Systems. Two sets were prepared from the images, as detailed in table 1. SET
I II
Training Type
Biased Training Unbiased Training
No. of Images for Training
No. of Images for Testing
Normal
Abnormal
Normal
36
65
12
Abnor mal 21
36
36
12
50
Table 1. Number of Images in the two sets :I. Biased training and II. Unbiased Training
4.2 Feature extraction
Entropy: A measure of nonuniformity in the image based on the probability of cooccurrence values. Energy: A measure of homogeneity. Difference moment: A measure of contrast. Inverse Difference Moment: A measure of local homogeneity. Correlation: A measure of linear dependency of brightness.
4.3 Performance Measure The classification of the images may give four types of results namely, True Positive (TP), True Negative (TN), False Positive (FP), False Negative (FN). The various outcomes of classification is given in Table 2. Real Group Normal Abnormal
Classification Result Normal Abnormal TN FP FN TP
Table 2. Possible outcomes The most commonly used performance measures in classification are Precision and Recall. Precision can be seen as a measure of exactness or fidelity, whereas Recall is a measure of completeness. In a statistical classification task, the Precision for a class is the number of true positives (i.e. the number of items correctly labeled as belonging to the positive class) divided by the total number of elements labeled as belonging to the positive class (i.e. the sum of true positives and false positives, which are items incorrectly labeled as belonging to the class). Recall in this context is defined as the number of true positives divided by the total number of elements that actually belong to the positive class (i.e. the sum of true positives and false negatives). In a classification task, a Precision score of 1.0 for a class C means that every item labeled as belonging to class C does indeed belong to class C (but says nothing about the number of items from class C that were not labeled correctly) whereas a Recall of 1.0 means that every item from class C was labeled as belonging to class C (but says nothing about how many other items
were incorrectly also labeled as belonging to class C) [23]. The formula for precision and recall are given by
Accuracy= (TP + TN) / (TP + TN + FP +FN) * 100 Error= 1- Precision
The reason behind this significant improvement is the kernel function Gaussian RBF. The experimental results have shown [19, 27] low error rates with Gaussian RBF kernel compared to that with polynomial and other kernels. Therefore, it can be concluded that Gaussian RBF kernel based SVM is a promising technique for MRI image classification.. This automated pattern detection system can, therefore, be further used for classification of images with different pathological condition, types and disease status.
4.4. Results
5. References
As described in section 4.1, two different image sets were taken as biased and unbiased ones and experiments were performed. The performance of the proposed classifier (SVM with Gaussian RBF kernel) was evaluated and compared with AdaBoost. Table 3 presents the results obtained for the Set 1 (biased). Table 4 shows the results of classification for the image set 2(unbiased). It can be seen that SVM based classifier gives better precision values than AdaBoost, although the difference is not much.
[1] Mark Schmidt, “Automatic Brain Tumor Segmentation”, University of Alberta, 2005.
Precision= TP / (TP+FP) * 100 Recall= TP / (TP + FN) * 100 We also compute accuracy and error in the classification by the following formulae:
Classifier SVM (Gaussian RBF kernel) AdaBoost
Precision (%)
Recall ( %)
Accuracy ( %)
93.33 90.25
95.28 91.66
92.71 89.31
Table3. Classification Results for Set 1 Classifier SVM (Gaussian RBF kernel) Ada Boost
Precision
91.62 89.05
%
Recall (%)
Accuracy (%)
93.56 90.52
91.75 88.26
Table4. Classification Results for Set 2
4.5. Discussion It was discussed in section 2 that SVM has been used previously also, in the image classification. The performances of SVM and AdaBoost classifiers were computed on the basis of precision, recall and accuracy. The comparative performance results tabulated in section 6 it indicate that SVM approach is better than other classifiers. Furthermore the previous applications of SVM, which used other kernels, have yielded overall accuracy lying between 86 to 90 %, whereas, the proposed model yields an accuracy of about 92%.
[2] M . Maitra, A. Chatterjee,”Hybrid multi resolution Slantlet transform and fuzzy c-means clustering approach for normal-pathological brain MR image segregation”, Medical Engineering and Physics, Elsevier Publishers,2007. [3] Gibbs, P., Buckley, D., Blackb, S., and Horsman, A.,”Tumor volume determination from MR images by morphological segmentation”, Physics in Medicine and Biology, 41:2437–2446, 1996. [4] Zhu, Y. and Yan, H. “Computerized tumor boundary detection using a hopfield neural network” IEEE Transactions on Medical Imaging, 16:55–67,1997. [5] Ho, S., Bullitt, E., and Gerig, G. “Level set evolution with region competition: automatic 3D segmentation of brain tumors”, In 16th International Conference on Pattern Recognition, pages 532–535,2002. [6] Clark, M., Hall, L., Goldgof, D., Velthuizen, R., Murtagh, F., and Silbiger, M., “Automatic tumor segmentation using knowledge- based techniques. IEEE Transactionson Medical Imaging, 17:238–251,1998 [7] Mazzara, G., Velthuizen, R., Pearlman, J., Greenberg, H., and Wagner, H. “ Brain tumor target volume determination for radiation treatment planning through automated MRI segmentation”. International Journal of Radiation Oncology*Biology*Physics, 59(1):300–312,2004. [8] Garcia, C. and Moreno, J. (2004). Kernel based method for segmentation and modeling of magnetic resonance images. Lecture Notes in Computer Science, 3315:636– 645,2004. [9]. Ming-Ni Wu, Chia-Chen Lin, Chin-Chen Chang, "Brain Tumor Detection Using Color-Based K-Means Clustering Segmentation," International Conference on Intelligent Information Hiding and Multimedia Signal Processing, vol. 2, pp. 245-250, 2007.
[10] S. Murugavalli, V. Rajamani , “An improved implementation of brain tumor detection using segmentation based on neuro fuzzy technique”, Journal of Computer Science, Nov, 2007 , Science Publication. [11].Benamrane, A. Freville and R. Nekkache, “A hybrid fuzzy neural networks for detection of tumors in medical images”, American Journal of Applied Sciences, 2(4):pp.892-896, 2005. [12] Christopher J.C. Burges, “Geometric Methods for Feature Extraction and Dimensionality Reduction - A Guided Tour”, The Data Mining and Knowledge Discovery Handbook,59-92,Springer,2005.
[19] K.Hotta, “Support Vector Machine with local summation kernel for robust face recognition”. Proceedings of the Seventeenth International conference on Pattern Recognition (ICPR 2004). Volume 3, pages 4825,Cambridge, UK, 2004. [20]. Yoav Freund and Robert E.Schapire ,”A decisiontheoretic generalization of on-line learning and an application to boosting,” Journal of Computer and System Sciences, no. 55. 1997 [21] Friedman, J., “Stochastic gradient boosting. Computational Statistics & Data Analysis,” 38, 367-378.
[13] Q. A. Salih, A. R. Ramli, R. Mahmud & R. Wirza ,” MR Image Evaluation For Intensity Group Cluster Segmentation Of T1 And T2 Weighted Axial Sliced Section”,The Internet Journal of Radiology, 2004
[22] Robert M. Haralick, K Shanmugam and Its’Hak Dinstein. “Textural Features for Image Classification.” IEEE Transactions on Systems, Man, and Cybernetics, 1979
[14] Zadech, H.S., Windham, J.P., "Optimal linear transformation for MRI feature extraction," IEEE Transactions on Medical Imaging,V15, N6, p749-767,1996.
[23] T. Joachims, “Optimizing Search Engines Using Clickthrough Data”, Proceedings of the ACM Conference on Knowledge Discovery and Data Mining (KDD), ACM, 2002.
[15]. Principe, J., Xu D., and Fisher, J.,"Information theoretic learning," Unsupervised Adaptive Filtering, Ed. S. Haykin, John Wiley & Sons, New York, 2000
[24] Ratsch, G, Onoda, T, and Müller, K (1999), “Regularizing AdaBoost” ,In: Proc. NIPS 11, ed. by M. S. Kearns, S. A. Solla and D. A. Cohn, pp. 564-570, MIT Press.
[16] Vapnik, V., The nature of statistical learning theory, 536,Springer-Verlag, 1995. [17]. B. E. Boser, I. Guyon, and V. Vapnik.,” A training algorithm for optimal margin classifiers”, Proceedings of the Fifth Annual Workshop on Computational Learning Theory, pages 144-152. ACM Press, 1992. [18] A. Barla, E. Franceschi, “Pattern Recognition with Support Vectoe Machine”, First International workshop, SVM 2002, Niagara Falls, pages 83-96, Springer-verlag, Gernany, 2002.
[25] H. Selvaraj, S. Thamarai Selvi, D. Selvathi, L. Gewali,” Brain MRI Slices Classification Using LeastSquares Support Vector Machine”, International Journal ofIntelligent Computing in Medical Sciences and Image processing, Vol. 1, No. 1, Issue 1, 2007. [26] Makhoul, John; Francis Kubala; Richard Schwartz; Ralph Weischedel, “ Performance measures for information extraction” , Proceedings of DARPA Broadcast News Workshop, Herndon, VA, February 1999. [27] Y. Ma and V. Cherkassky, “Multiple Model Estimation for Nonlinear Classification”, Studies in Fuzziness and Soft Computing, Volume 177, Springer-Verlag Berlin Heidelberg 2005.