An Open Framework for Reverse Engineering Graph Data Visualization. Alexandru C. Telea. Department of Mathematics and Computer Science. Eindhoven ...
An Open Framework for Reverse Engineering Graph Data Visualization Alexandru C. Telea Department of Mathematics and Computer Science Eindhoven University of Technology, The Netherlands
1
Introduction
but structurally similar, graph. In the following, we shall focus on the selection, attribute computation, and mapping operations.
Reverse engineering (briefly RE) provides a conceptual framework for describing the process of software understanding and concept abstraction. Most RE software tools for use some form of visual representation and manipulation of the RE data. In most cases, such data consists of an attributed, multi-level, directed graph [4]. The nodes of this graph describe software artifacts at different abstraction levels, such as functions, classes, components, and packages. The graph’s arcs describe the relations between the artifacts, such as containment, requirements and provisions, and modification dependencies. Finally, the graph’s attributes describe properties such as size, cost, modification time, and various software metrics. However powerful, most existing RE tools are based on internal architectures which seriously limit the options for customisation of the several RE tasks such as data abstraction, simplification, and visual presentation. Several attempts have been made to design generic RE frameworks, which allow users to define and customize operations for their specific tasks. However, such frameworks are still too rigid to be easily reusable out of the context for which they were initially designed. We propose here an open toolkit for RE data exploration. Since RE data is mainly graph data, our toolkit is potentially useful in other domains that need graph visualization. The toolkit’s main novel element is a flexible architecture that groups the graph-related operations into several classes and provides a mechanism for these classes to communicate with each other. We experienced that the implementaton of new graph-related operations in the toolkit, such as specific metrics or visualizations, was considerably easier than when using similar toolkits. Moreover, the toolkit strives to minimize the time needed by end users to design custom visualizations for graph data in general and RE data in particular. Since the toolkit was initially targeted for usage in the industry, spcial attention was payed to usability issues.
Selection operations are of particular importance. Regardless of what an operation does, all operations need a common way to specify the data they work on. In general, this is a subset of the whole graph. In a typical scenario, a user creates several such subsets (’select’ a part of the entire data, or ’filter’ out some other part (Sec. 2.1)), then perform the desired editing and attribute computation (Sec. 2.2) on the selected data. Finally, the selected data is visualized by producing a graph layout and mapping it to a visual representation (Sec. 3). In our toolkit, we completely separate the specification of this subset (which are the nodes and edges to work on) and the operation specification (what to do with he selected nodes and edges). The selections are manipulated in the system as named objects, thus they are similar to variables in a usual program. The above principle leads to a minimal, but still powerful architecture which provides the desired amount of flexibility in the specification of the operations as well as keeping their implementation simple and efficient in the toolkit. We have implemented several selection operations in the toolkit, as follows. Conditional selections select all nodes and/or edges which satisfy a criterion given as a function on the nodes’ and edges’ attributes. Structural selections select all nodes and/or edges which satisfy a topological criterion. Frequently used structural selections in RE applications are selecting all direct and indirect descendants, or sub-components, of a node (also called ’vertical slicing’ the RE data) and selecting all nodes on the same level of abstraction (also called ’horizontal slicing’ the RE data) [4]. Finally, set selections perform boolean combinations (intersection, union, etc) on several selection objects. They are useful as part of more complex activities.
2
2.2 Attribute Computation Operations
Toolkit Architecture
Figure 1 shows the usual sequence of operations done in a typical reverse engineering session. First, the graph data is read e.g. from
selection load data
attribute computation
mapping
viewing
editing
Figure 1: Operation pipeline a code analysis tool. Next, the graph is transformed by several operations such as editing, selection, and attribute computation. Editing operations change the structure of the graph, e.g. by adding or deleting nodes and/or edges, or by performing graph clusterings, which group related nodes into ’super-nodes’ to produce a simpler,
2.1 Selection Operations
Attribute computation operations take a selection as input and compute one or several attributes on the selection’s nodes and/or edges. Attributes are stored (and retrived) in the nodes and edges as namevalue pairs, so a node or edge may have any number of attributes during its lifetime. We have found this system much more flexible than e.g. strong-typed designs which associate a fixed set of typed attributes with a node or edge. Two kinds of attribute computation operations have been implemented:
� metrics: several metrics specific to reverse engineering are provided, such as component coupling and cohesion, interconnection strength, and common clients and suppliers [4]. Implementing a new metric operation is typically a simple task, since such such operations take usually only a few lines of code. � layouts: in contrast to other approaches [3], we regard graph layouts simply as operations that compute 2D or 3D positional attributes for the nodes and/or edges. The required in-
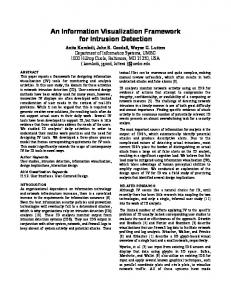
Figure 2: Visualization of 600 artifacts in mobile phone software
erface a layout algorithm needs to provide to be integrated in our toolkit is minimal. Integrating layout tools such as GEM [1] and GraphViz [2] has taken under 50 lines of code in our toolkit.
3
Mapping Operations
Mapping operations take as input selections with position attributes computed by layout operations and map them to a set of graphical objects that can be readily visualized. For each node and edge in the input selection, the mapping operation will produce a specific glyph, or graphical object, similarly to scientific visualization applications (Fig. 2). Users can supply their own Tcl procedures (see Sec. 4) to control the glyph creation. In this way, one can easily visualize several attributes of the selected nodes and edges in a variety of ways. The final step of the visualization pipeline views the glyphs produced by the mapping step in an interactive 2D or 3D viewer based on the Open Inventor toolkit [5], where users can zoom in, change the viewpoint, and interactively select nodes and edges to subsequently apply editing, layout, or attribute computation operations on them, thus loop the pipeline in Fig. 1.
4
Applications and Evaluation
The toolkit comes as a C++ core library of around 10000 source lines. Atop of this library, several custom operations (layouts, mappers, glyphs, and metrics) are implemented as short scripts in the dynamically interpreted Tcl language. Complete applications add an extra layer of user interfaces written in Tk atop of the Tcl layer. The example in Fig. 3 shows around 800 software artifacts extracted from 600,000 lines of C code from a moble phone application developed by NOKIA. Building the visualizations in Figs. 3 and 2 took under 10 minutes and under 20 lines of Tcl script code. Overall, our toolkit is quite similar to the GVF described in [3]. However, the concepts of selections, mapping operations, glyphs, as well as the interactive Tcl layer give are not present explicitly in the GVF. It is still to be seen whether these concepts make our toolkit more readily usable for our applications than the GVF.
References [1] M. H IMSOLT, GraphEd user manual, Technical report, Fakultat fur Informatik, Universitat Passau, Innstrasse 33, D-8390
Figure 3: Visualization of object oriented data
Passau, 1992. [2] E. KOUTSOUFIOS , S. N ORTH, GraphViz, DOT and NEATO Documentation, http://www.research.att.com. [3] M. S. M ARSHALL , I. H ERMAN , G. M ELANCON, An Object-Oriented Design for Graph Visualization, http://www.cwi.nl/InfoVisu/GVF [4] H. M ULLER , M. O RGUN , S. T ILLEY, J. U HL, A Reverse Engineering Approach to Subsystem Structure Identification, Software Maintenance: Research and Practice, 5(4):181–204, 1993. [5] J. W ERNECKE, The Inventor Mentor: Programming ObjectOriented 3D Graphics with Open Inventor, Addison-Wesley, 1993.