An Open Toolkit for Reverse Engineering Data Visualisation and Exploration A. Telea 1 , A. Maccari 2 , C. Riva 2 1
Department of Mathematics and Computer Science, Eindhoven University of Technology, The Netherlands,
[email protected] 2 Software Technology Laboratory, Nokia Research Center, Helsinki, Finland
[email protected],
[email protected]
Abstract. Maintenance and evolution of complex software systems (such as mobile telephones) involves activities such as reverse engineering (RE) and software visualisation. The RE conceptual framework for describing software understanding and concept abstraction is implemented up to different degrees by several RE tools. We found the architecture of most such tools hard to adapt to the domain specific requirements posed by our current practice in Nokia. We believe that the architecture of a RE tool should reflect the conceptual framework’s logical steps. We propose such an architecture and present a concrete RE toolkit that implements it. The toolkit provides a flexible way to build RE scenarios by subclassing and composition of a few basic components. We pay special attention to the visual and interactive requirements of the RE process. We show our plans to use it for further research on visualising the complex software structures that we extract from our products.
1 Introduction Program understanding [7, 1, 18] is an essential part of maintenance and evolution of complex software systems. The term ”program understanding” means identifying the software artifacts that compose a certain system and the structure and semantics of their relationships. Reverse engineering (RE) is the part of program understanding that concerns with the extraction of the low level system implementation data and their presentation at the right abstraction level. Several tools support RE by providing automatic and user-driven facilities for data extraction and visual data presentation [4, 5, 12]. In practice, however, attempts to reverse engineer large systems usually reach some functional and/or structural limitations of these tools. Some tools focus on domain modelling and program analysis but provide little for the examination and/or user editing of the extracted information. Other tools provide extensive data visualisation and editing [12, 5] but no program analysis or are hard to integrate with tools that perform this task. To address the above problems, we propose a new architecture for RE tools. First, we identify the common features (or ’agents’) the various RE tasks require (Sec. 1.1). Our architecture models these agents as loosely coupled object-oriented components that can be subclassed and/or composed to customise the tool (Sec. 1.3). Sections 2 and 3 present our architecture in detail. Section 5 shows and end-user view of our tool. Section 6 shows
the use of our RE tool for the analysis of concrete software data from the industry. Section 7 concludes with directions for future work. 1.1 Reverse Engineering Tasks A past investigation detected five major tasks that an RE tool should support [1]. These tasks are, in increasing abstraction level order: program analysis, plan recognition, concept assignment, redocumentation, and architecture recovery (see also Fig. 1)). Program analysis is the basic task that any RE tool should support and consists of two services: construction of a layered program model and presentation this model to the user, i.e. via graphical navigable views at different detail levels [12, 14]. Plan recognition aims at finding certain design patterns in the software [20]. These design patterns form the so-called domain model (Fig. 1). A first attempt for plan recognition support would be an editor for manual assignment of design patterns to elements obtained from program analysis and the visualisation thereof e.g. as UML diagrams. Concept assignment [6] is the task of discovering concepts and assigning them to their implementation counterparts. RE tools might support concept assignment by annotating the software artifacts with concepts picked from a domain-specific concept database and visualising this annotation. Redocumentation [18] is the task of retroactively providing documentation for existing software systems. Since redocumentation spans the three tasks discussed so far, a RE tool could support it by the mechanisms outlined so far. Architecture recovery [10] focuses on recovering the architectural aspects of large systems. Architecture recovery support may demand yet another (graphical) system representation.
domain model Reverse Engineering Process source code
Program analysis
− low−level − concrete − unstructured
Architecture Concept Plan Redocumentation recovery identification assignment
information enrichment
hierarchical representation − low−level − abstract − unstructured
Fig. 1. Reverse engineering tasks
1.2 Requirements for a RE Tool The five mentioned RE tasks concur, and not compete, to the overall RE goal, i.e. extracting low-level code information and enriching it with information from other sources. In other words, one must provide different views of the same data on which various queries, supported by a given domain model, can be made. Consequently, we identify three main ’agents’ that a generic RE tool should provide: views, queries, and domain models.
The views relate to the different focuses of the RE tasks [1]. Among these, we mention structural views (syntax trees, file-directory containment hierarchies, design pattern instances), functional views (concept and dataflow graphs), low-level views (source code), and high-level views (architectural plans, user documentation). A generic RE tool should provide several such views and allow defining domain-specific ones [11, 18]. The same flexibility should be provided for queries. A query is any algorithmic operation that can be executed on a given software model, e.g. searching for occurrences of a specific pattern, removing or replacing of an element with a given value, aggregating elements, computing quality metrics, and so on. Since many queries are domain specific, RE tools should provide a generic and simple manner to define them. Finally, the RE tool should allow defining problem-specific domain models. A domain model is a set of meta-rules that describes certain aspects present in the analysed software, such as a source-code grammar, a set of design patterns to be found, or a set of client-supplier relationships to be analysed. RE tools can use domain models to perform queries automatically at a higher level than purely structural. 1.3 Concrete RE Operations To address the needs for extensibility, domain retargeting, genericity, and simplicity to use, we propose a new toolkit architecture which closely models the steps of the conceptual RE pipeline, as follows. We identify five generic operations that implement the five RE tasks introduced in Sec. 1.1 (see also [20, 11, 18] and Fig. 2 b): 1. extract the low-level artifacts from the source code 2. aggregate the artifacts into a hierarchical representation 3. measure the representation’s quality by using various norms. If necessary, reexecute the aggregation step differently. 4. select a specific part of the hierarchy to examine 5. visualise the selected data. Insight acquired here may determine to reexecute the previous phases differently. Steps 2 to 5 can take place in any order. Although traditionally a program analysis model only, the above pipeline can be used all five RE tasks (Sec. 1.1). All selection, measuring, and visualisation operations apply thus to all tasks, every task needing potentially different operation implementations. Consequently, we use the above pipeline model as a basis for our generic RE tool architecture (Fig. 2). The toolkit is implemented as a layered system. The toolkit core is implemented as a C++ class library, for performance reasons. The user interface layer is implemented in Tcl/Tk for flexibility. The next section discusses the core data structures of our architecture. The RE operations are discussed next in Sec. 3.
2 Data Representation We propose a data representation containing four elements: structure, attributes, selections, and domain models.
Toolkit Core Core Data Model
RevEng data
read data
(k,2)-digraph
modify data
Graph data Selection Layout Mapping
Operations - selection - graph editing - mapping
Edit operations
Select operations
construct selection
modify selection Selections
display modify data view parameters Visualisation User operations operations interface datasets
Viewing Images a)
User Interface
b)
Fig. 2. a) Overview of the toolkit architecture b) Reverse engineering pipeline
2.1 Structure The structure data consists of two main elements: a representation of the basic (low level) artifacts, usually obtained by parsing the source code, and a hierarchical representation of the information enrichment during the RE process. There are many ways to describe this information, such as relational models [3], attributed graphs [9], or data tables [13, 14]. However, all these models are ultimately hierarchical attributed graphs, best described as (k,2)-partite graphs [2]. (k,2)-partite graphs are well suited for our RE tool data model (see example in Fig. 3 a). They are generic, i.e. can store both the basic artifacts (A..E) and the higher-level ones (F..H) produced by the RE data abstraction process. The graph levels may represent the same type of information, such as files in a file-directory hierarchy, or different types, such as variables, grouped in procedures, grouped in modules, etc. All five RE tasks are covered: higher levels may represent architectural elements associated to syntactic software artifacts on lower levels. The model is also easily navigable and compact, making it efficient for implementing the query, selection, filtering, and viewing operations. Graph nodes with several parents can easily model alternative system structurings. 2.2 Attributes Both graph nodes and edges may have attribute sets, i.e. collections of key-value attribute pairs with unique keys. We implement keys as string literals, values as primitive types (integer, floating-point, pointer, or string), and the mapping as a hash table. Attributes automatically change type if written to with a value of another type. Several attribute planes can coexist in the graph. An attribute plane consists of all attributes of a given set of nodes and/or edges for a given key. For example, one can set or query the ”price” attribute-plane of a given node set.
The above model is quite different from the attribute model of other RE tools [12, 4, 5]. Most such tools choose a fixed set of attributes of fixed types per node and/or edge, similarly to typed records. Our choice is more flexible, since a) certain attributes may not be defined for all nodes, and b) attribute-planes are frequently added and removed during a typical RE session.
level 2
information refinement
H
Graph level 1
F
A
G
B
D
C
r rw r
Selections
Operation
rw r r
selection editing mapping
E
level 0
a)
b)
Fig. 3. a) Example of (k,2)-partite graph b) Operations vs reading/writing data
2.3 Selections Selections are the second main component of our RE data model. A selection is a set of graph nodes and edges. Selections allow executing any toolkit operation on a specific subset of the whole graph. To make the toolkit flexible, we decouple the operation definition from the data on which it is executed. Selections allow their operation clients to iterate over their nodes and edges. To optimise memory storage and iteration speed, we implement several selection subclasses that store nodes and edges internally in different ways. This is an important aspect, as an usual RE session creates tenths of selections with hundreds or even thousands of elements. Selections are named, just as attributes. All selections are kept in a selection-list, which is managed similarly to the attribute-set. Asking for a selection whose name is not in the list returns a special EmptySelection object. In this way, operations do not have to test explicitly if their selection arguments exist or not. This simplifies the implementation of a new operations. 2.4 Domain Models Domain models are implemented in our toolkit as a set of meta-rules that prescribe the structure and attributes of the nodes and edges. We implement a domain model as a collection of node and edge types. A node or edge type is a collection of attribute types. An attribute type consists of a name and a type. The above model is roughly similar to the type system provided by several programming languages for e.g. records. The toolkit supports a collection of domain models defined as above. Similarly to graph data, domain models can be loaded from several file formats, such as the RSF format [4]. Nodes and edges may then be associated with a node, respectively edge type by setting a ”type”
attribute to name the desired attribute node, respectively. Operations such as metrics or aggregations may then use the types of nodes and edges to infer about their domainspecific properties. Several RE tools such as [5] implement domain models differently, i.e. by modelling every node and edge type as a class in the toolkit’s own programming language and implementing nodes and edges as instances thereof. However, this has several drawbacks. One can not add or delete attributes from existing nodes and edges, change attribute types, change the type of a node or edge, or introduce new domain models without recompiling the system. The main advantage of using a compiled solution — strong type checking — is not essential or may be even restrictive for the prototyping and investigative nature of the RE applications. We have chosen thus for a purely run-time, weaklytyped implementation of domain models.
3 Operation Model Operations read and write the graph via selections and may have three types of inputs and outputs: selections specifying on which nodes and edges the operation works; attribute keys that specify on which attribute planes the operation works; and operation specific parameters, such as the threshold value for a filtering operation. Following the RE task model (Sec. 1.3), we distinguish three major operation types, as follows (see also Fig. 3 b). Selection operations build selections by using different algorithms. Selection operations are the only ones that create selections (see Sec. 3.1). Graph editing operations modify the graph structure and/or attributes. These are the only operations that modify the graph (see Sec. 3.2). Mapping operations map the graph to other representations. Data visualisation is e.g. a mapping operation. Mappings are the only operations that only read both the graph and the selections (see Sec. 4). The above read/write interface provides a clear specification of the operations’ responsibilities for developers. Secondly, this allows the system to infer which data are modified after the execution of one or more operations and to automatically update all components that depend on the modified data. For example, selection objects are automatically updated after a structure editing, since this might have inserted or deleted selected nodes or edges. A second example are the data viewers (Sec. 4.3) that are automatically updated upon change of their input selections. In the following, we describe several concrete operation implementations. 3.1 Selection Operations Selection operations produce specific selection instances (Sec. 2.3), as follows. Level Selection A level selection receives a level number as an input and selects all the nodes and horizontal edges on that level. Level selections are used for visualising a specific aggregation level in a (k,2)-digraph. Level selections implement what other RE tools call horizontal slices in the data model [4, 5]. Tree Selection A tree selection receives a selection s1 as input and produces a selection s2 that contains
all the nodes and downward edges that are reachable from the nodes in s 1 . Tree selections are used for visualising the so-called vertical slices in a (k,2)-digraph. Conditional Selections A conditional expression receives a selection s1 as input and produces a selection s2 that contains all the nodes and edges of s1 that obey a given condition, specified by the user as an attribute function. Conditional selections implement what the RE tools usually call filtering. They are used to e.g. visualise specific parts of a large graph in queries such as: ’show all nodes where the cost attribute is higher than a given threshold’. 3.2 Graph Editing Operations Graph editing operations edit the graph structure or the node/edge attributes, as follows. 3.3 Structure Editing Structure editing operations construct and modify the graph structure. The simplest operations are addition/removal of nodes, edges, and levels, implemented as methods of the corresponding classes Node, Edge, Level, and Graph. Importing Graph Data These operations read a graph structure from a file by parsing specific file formats such as RSF [4], GraphEd [17], and DOT [8]. These operations are 100 C++ code lines on average, so it is reasonably simple to implement a reader for a new data format. Aggregation Aggregation operations take several nodes via an input Selection and produce a parent node. Implementing such operations involves constructing vertical edges to the new node. More complex aggregation methods can be implemented too, such as topology-based automatic graph simplification. 3.4 Attribute Editing These operations create, modify, and delete node and edge attributes (Sec. 2.2). Besides the Selection input common to most operations, attribute operations have also one or several attribute-plane names as inputs. These names refer to attribute-planes that the operation reads and/or writes, as follows. Metrics RE metrics are actually attribute editing operations. Examples of metrics include structural metrics, e.g. the number of provisions, requirements, and internalisations for a node [4, 1]. A metric can have two types of outputs: an attribute-plane for metrics that compute a new attribute for every node or edge, or a unique value for the input selection, e.g. the cyclomatic number. As compared to other RE tools, our framework allows easy customisation of: – the metric implementation. Usual metrics have around 10-50 C++ lines.
– the metric’s parameters. The nodes and edges to apply the metric on are selected via any selection operation (Sec. 3.1). The attributes used to compute the metric on and to store the metric into are given as attribute names. The implementations of the metric, attributes, and selection are thus kept decoupled. Graph Layout Most RE visualisations use graph layouts. Layouts compute 2D or 3D coordinates for a selection of nodes and edges. After layout, nodes and edges can be visualised, as described separately in Sec. 4. We treat layouts as attribute editing operations for several reasons. Computing a layout is, by definition, computing position attributes for nodes and edges. Treating layouts as attribute editing operations allows us to: – choose a desired layout type from a palette of available graph layouts. – apply different layouts to different graph subsets (selections), e.g. use spring embedders [15] for level selections and Sugiyama layouts [19, 8] for vertical slices. – combine different layouts. There is clearly no best layout. Often it is better to construct a layout incrementally, i.e. apply several layouts sequentially to refine the same positions. – modularise the toolkit implementation by decoupling layout computation from the visualisation. So far, we have implemented five layout operations, as follows (see also Fig. 4).
Fig. 4. Software visualisation. Top: spring-embedder and tree layouts. Bottom: vertical slice and 3D level layout
1. Tree-like layout: The input selection is treated as a directed graph. The nodes are arranged on levels in 2D such that the number of edge crossings is minimised [19]. We implement this layout based on the AT&T dot software [8]. Several tests have shown that dot software runs faster and more robustly for large graphs, and produced visually better layouts than similar software such as [4, 5]. 2. Spring embedder layout: This layout uses a physical model that tries to minimise the edges’ lengths with respect to the nodes’ positions [8, 15]. We implement this layout based on the AT&T neato software [8], whose performances are similar to dot’s. We provide a second spring embedder layout based on the GEM algorithm [15]. GEM implements different heuristics and control parameters than neato, leading sometimes to shorter running times and better visual results, especially for densely connected graphs. However, GEM is more sensitive to the parameter choice than neato. It is thus the user’s choice whether to apply the one or the other. 3. Grid layout: This operation lays out the selected graph on a 2D regular grid. No attempt is done to minimise the edges’ lengths or number of crossings. This layout is frequently run as preprocessing for more complex layouts. 4. Stacked layout: This operation lays out a selection spanning several levels of a (k,2)digraph by applying one of the previous layouts per level and then stacking the layed out levels in 3D. Stacked layouts are used to visualise both the horizontal and vertical relationships of a (k,2)-digraph. Adding new layouts is reasonably simple. The above layouts have been coded or encapsulated in no more than 100 C++ lines each, whereas the implementation of some layouts such as dot and neato exceeds 10000 C lines.
4 Mapping Operations Mapping operations serve three purposes: – visualisation: Mapping operations produce visual representations of the graph data. – interaction: The visual representations can be interactively modified by the user. – export: Mappings export the graph data to third parties e.g. by writing data files.
4.1 Data Visualisation Visualisation operations have four components: mappers, viewers, glyph factories, and glyphs (see the C++ classes with similar names in Fig. 5 a). Visualisation is based in our toolkit on the Open Inventor [21] graphics C++ library. Open Inventor offers sophisticated mechanisms for object direct manipulation and construction that considerably simplify the programming of the visual interface of our toolkit. Figures 4 and 5 b show several graph visualisations created with our toolkit.
Selection
Selection
input 1 selection
highlight 1 selection
MapperBase
position attribute plane 1 name
* Inventor scene graph 1
GlyphMapper
Viewer
1 edge glyph factory
node 1 glyph factory
GlyphFactory
GlyphFactory
a)
b)
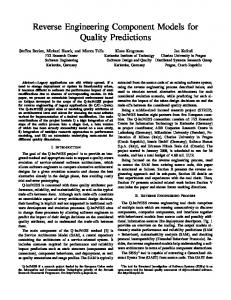
Fig. 5. a) Mapping operation components b) Glyph visualisation. Three types of glyphs (cones,cubes, and balls) are defined and associated with different node types. The glyph sizes reflect the nodes’ number of edges.
The Glyph Mapper The central visualisation component is the mapper, implemented by the MapperBase C++ class. A mapper takes a selection as input and produces an Inventor scene graph as output. The scene graph can be then interactively manipulated in several Inventor viewers. Specific MapperBase subclasses construct the scene graph in specific ways. For example, the GlyphMapper constructs the scene graph by creating one glyph for each node and edge in the input selection. The glyphs are positioned using position attributes from the nodes and edges. The positions are constructed prior to mapping by a layout operation (see Sec. 3.4 and Fig. 2). The Glyphs A glyph is a 2D or 3D graphical object built by a GlyphFactory to visualise a node or edge and their attributes, as follows. A GlyphFactory subclass constructs a glyph given a concrete node or edge. For example, the DefaultGlyphFactory builds a cube glyph for a node, respectively a line glyph for an edge. GlyphFactory subclasses provides a number of named parameters. For example, a ConeGlyphFactory subclass declares two parameters ”angle” and ”radius” that control the angle, respectively the radius of a 3D cone glyph. The user can associate these parameters with attribute-names to express which graph attributes are mapped to which graphical parameters. Figure 5 b visualises a software architecture in which the node type (package,class,function) maps to the glyph type (cube,cone,ball) and the node’s numberof-lines attribute maps to the glyph size. Choosing the association between the node and edge attributes and their glyphs’ graphical properties is a powerful manner to visualise the graph data [5]. Summarising, the GlyphMapper offers three ways to map the graph data to visual objects: by specifying a MapperBase subclass that builds the scene
Fig. 6. Tcl/Tk interface of the integrated reverse engineering application
graph; by choosing specific GlyphFactories; and by mapping the textttGlyphFactory graphical parameters to the node and edge attributes. Separating glyph placement (in the layout phase) from glyph construction (the mapping phase) is a simple but powerful way to customise the visualisation. New glyphs can be developed without any concern for their layout, whereas new layouts can work on the existing glyphs. 4.2 The Highlight Selection Viewers function both as output components, by displaying their input selection, but also as input components, by editing a highlight selection (Fig. 5). The highlight selection is a subset of the input selection that is displayed using a special colour and drawing style. This is shown in the lower-right image in Fig. 4 where the middle layer has been selected. The highlight selection can be edited interactively, as explained next. 4.3 The Viewer A viewer is an Inventor component that allows users to navigate in a scene graph constructed by a MapperBase. Viewers have an input role too. Viewers respond to user events, such as mouse clicks an drags, by editing the highlight selection of their MapperBases. Via the automatic update mechanism (Sec. 2.3, other parts of the application can execute specific actions on the edited selection. For example, interactive node aggregation is readily implemented by applying an aggregation operation (Sec. 3.3) on the highlight selection. Similarly, one can examine, delete, hide, interactively lay out, or apply metrics on the highlight selection.
5 User Interaction and Scripting The core architecture described so far is implemented as a C++ class library. For customisation purpose, we provide a Tcl interface to the core C++ API and add several custom Tk-based graphical user interfaces (GUIs) to build a complete application. The GUIs provide simple access to commonly used functionality, such as examining and
Fig. 7. Mobile telephone software visualisation. Entire system (left) and detail (right)
editing node attributes, selection objects, domain models, and viewers, loading and saving data, and so on (Fig. 6). A Tcl/Tk GUI front-end atop of a C or C++ core is quite similar to RE tools such as Rigi [4] or VANISH [5]. However, several differences are to be mentioned. First, our core architecture is based on a few orthogonal components (graph, selections, operations, mappers, glyphs, and viewers) that have only simple interdependencies (Fig. 2). Flexibility and customisation are provided by subclassing and composition of the basic components. For example, the script shown in the background window in Fig. 6, used to produce the visualisation shown in Fig. 5 b, has about 10 Tcl lines. In contrast, Rigi [4] uses a monolithic core architecture. Although adaptable via Tcl scripts, this architecture offers no subclassing or composition for the core itself. It is not possible, for example, to change the graphic glyphs or the interactive selection policy without recoding the core. Adding a new layout, domain model representation, or metric involves a low level API to access nodes and edges, as Rigi has no notion of manipulating these as selections. In contrast, VANISH [5] provides a way to build custom glyphs very similar to our GlyphFactory (Sec. 4.1). However, VANISH uses domain models based on compiled C++ classes which prove inflexible for our targeted RE scenarios (Sec. 2.4).
6 Applications We have used the integrated GUI application for the RE exploration of software systems built at Nokia. First, an attributed graph is extracted from the Java program sources. This graph contains low-level entities such as functions, classes, files, and packages, relationships such as ’uses’, ’contains’, and ’calls’, and various attributes such as object names, number of code lines, and version numbers. Next, this graph data is loaded in out RE tool as an RSF file [4] and the operation pipeline discussed in Sec. 1.3 (selection, aggregation, metric computation, layout, mapping, and viewing) is executed. Figure 7 (left) shows a selection of 10% of the whole graph, visualised with a spring layout. The about 900 software entities in this view are grouped in several independent clusters corresponding to the different original subsystems. The largest subsystem, shown in the lower left part of the figure, was selected interactively by the user and then
displayed separately in a second viewer (right image). In this image, we can easily see the ’bridge’ software components as being those nodes that connect the strongly coupled subgraphs. The whole scenario, starting from the RSF data delivered by the code analyser, took about 5 minutes to build. This implied the execution, via both the tool’s GUI and its Tcl command-line input, of less than 20 operations. To produce the zoomedin image shown on the right, a Tcl procedure of about 15 lines was written to take the highlight selection output of the left viewer, apply a spring layout, map it, and view it in a new viewer. To visualise node attribute names and values, we have written a second 12-line Tcl procedure that opens a GUI window (in Fig. 6 middle). This procedure is activated by the changing of the highlight selection in the detail viewer, i.e. by clicking on the desired node in this viewer. Overall, our RE tool proved to be more flexible than Rigi for the same case data, both for the end user that issues GUI and Tcl commands and for the developer that adds new functionality. The most time-consuming part of the executed scenarios was the layout computation. The layout implementations we use work reasonably fast for a few hundreds of nodes. For larger graphs, one has to apply several selection and/or aggregation operations to reduce the size of the data, prior to the layout and visualisation stages.
7 Conclusion and Future Work we have presented a new architecture for building visual RE tools. The presented architecture makes it easy to construct RE scenarios by compositing and/or subclassing a small set of software components. These components model the data and operations present in the abstract RE framework. RE data is represented as a generic attributed graph. Our architecture classifies the RE operations in graph editing, selections, layout, glyph mapping, and viewing. Functionally, these operations model respectively structural aggregation and metrics computations, queries and filtering, and data visualisation. The flexibility of the presented architecture reflects itself on two levels. First, end users can easily define custom data investigation scenarios simply by applying the provided operations in different orders with different parameters. Our architecture supports this scenario, as operations are only indirectly coupled by sharing the same graph data. Secondly, developers can easily define custom operations by subclassing the existing operations. The loose coupling between operations, promoted by the presented architecture, makes their code localised and limited in complexity - the about 40 operations we have implemented have each on the average 20 to 40 lines of C++ or Tcl code. Usually written in C++ for performance, such core operations are then easily assembled into more specific operations written in interpreted Tcl. Overall, the implementation of the presented architecture has about 8000 C++ lines (around 50 classes) and took four manmonths to develop. The toolkit implements around 30 operations (5 data readers, 4 data writers, 12 structure editing and metrics, 6 layouts, and about 10 mapping operations). The GUI-based integrated application built atop of the toolkit adds around 500 Tcl lines to the C++ core. As a last comment, we believe that the analysis of the architectural aspects involved in building RE tools performed in this paper is important for the development of flexible, customisable RE applications.
We plan to provide new domain-specific operations, such as graph simplification, layout, and glyph mapping, for the domain models used at Nokia to describe their current software architectures. Our RE system will thus serve both as a tool for investigation of the concrete mobile telephony software and as a testbed for prototyping new software visualisation techniques.
References 1. S. T ILLEY, A Reverse-Engineering Environment Framework, Tech. Report CMU/SEI-98TR-005, Carnegie-Mellon University, 1998. 2. H.A. M ULLER , M.A. O RGUN , S. T ILLEY, J. U HL A Reverse Engieering Approach to Subsystem Structure Identification, Software - Research and Practice, 5(4), pp. 181-204, 1993. 3. H. KORTH AND A. S ILBERSCHATZ, Database System Concepts, McGraw-Hill, 1986. 4. K. W ONG, Rigi User’s Manual, Dept. of Computer Science, University of Victoria, Canada. 5. R. K AZMAN , J. C ARRIERE, Rapid Prototyping of Information Visualizations using VANISH, Proc. IEEE InfoVis ’95, IEEE CS Press, 1995. 6. T. B IGGERSTAFF , B. M ITTBRANDER , D W EBSTER, The Concept Assignment Problem in Program Understanding, Proc. WCRE ’93, IEEE CS Press, 1993. 7. P. YOUNG Program Comprehension, Visualisation Research Group, Centre for Software Maintenance, University of Durham, May 1996. 8. S. C. N ORTH , E. KOUTSOUFIOS, DOT and NEATO User Guide, AT&T Bell Labs Report Series, http://www.research.att.com, 1996. 9. J. ROHRICH, Graph Attribution with Multiple Attribute Grammars, ACM SIGPLAN 22 (11), pp.55-70, 1987. 10. K. W ONG , S. T ILLEY, H. M ULLER , M. S TOREY, Structural Redocumentation: A Case Study, IEEE Software 12 (1), 1995, pp. 46-50. 11. K. W ONG, On Inserting Program Understanding Technology into the Software Change Process,internal report, Dept. of Computer Science, University of Victoria, Canada, 1997. 12. S. E ICK AND G. W ILLS, Navigating large Networks with Hierarchies, in Readings in Information Visualization [13]. 13. S. C ARD , J. M ACKINLAY, B. S HNEIDERMAN, Readings in Information Visualization - Using Vision to Think, Morgan Kaufmann Publishers Inc., 1999. 14. J. S TASKO , J. D OMINGUE , M. H. B ROWN , B. A. P RICE, Software Visualization - Programming as a Multimedia Experience, MIT Press, 1998. 15. A. F RICK , A. L UDWIG AND H. M EHLDAU, A fast adaptive layout algorithm for undirected graphs, Proc. GD’94, Springer-Verlag 1995. 16. E.R. G ANSNER , S.C. N ORTH, An open graph visualization system and its applications to software engineering, Software-Practice and Experience, John Wiley & Sons, (S1) 1-5, 1999. 17. M. H IMSOLT, GraphEd user manual, Tech. Report, Dept. of Informatics, Passau Univ., 1992. 18. S.R. T ILLEY, K. W ONG , M.D. S TOREY, H.A. M ULLER, Programmable reverse engineering, Dept. of Computer Science, University of Victoria, Canada, 1998. 19. K. S UGIYAMA , S. TAGAWA , M. T ODA, Methods for Visual Understanding of Hierarchical Systems Structure, IEEE Trans. Systems, Man, and Cybernetics, 11(2), pp.109-125, 1989. 20. A. M ENDELZON , J. S AMETINGER, Reverse Engineering by Visualizing and Querying, internal report, Computer Systems Research Institute, University of Toronto, Canada, 1997. 21. J. W ERNECKE, The Inventor Mentor: Programming Object-Oriented 3D Graphics with Open Inventor, Addison-Wesley, 1993.