Appendix S1. Multiple linear regression approach and ...
Recommend Documents
Jan 4, 2010 - pages on the p = 1 case and then covering multiple regression ...... 21. To clarify ideas, assume that there exists a subset S of predictor variables ...... pcisim(n1=100,n2=200,var1=10,var2=1) to simulate the CIs for N(µi,Ï2 i ).
Multiple Linear Regression The population model • In a simple linear regression model, a single response measurement Y is related to a single
As an illustration, suppose we simulate random (standard normal) âpredictor ... 50. Residual. Latitude. A strong suggestion that the longitude effect is quadratic:.
Table 1 Online appendix. Results of the multiple linear regression analysis exploring the relationship between plasma cortisol levels and the general cognitive ...
Forecasting, Budgetary Analysis, Stock Market Analysis,. Process and Quality ... the PJM market. ...... Hassan II University, Casablanca, Morocco. His current ...
Jan 1, 2001 - C-Regression Models towards Scale of Health in ICU. 1Mohd Saifullah ... The fuzzy c-mean (FCM) model proposed by Bezdek in 1981 ...
Department of Petroleum Geosciences, Faculty of Science, Soran University ..... [1] Gulf Keystone Petroleum Ltd., Investor presentation: www.gulfkeystone.com.
Auburn University Montgomery. Linear regression is one of the fundamental
models in statistics used to determine the rela- tionship between dependent and
...
[14] Azhar, N. and Farouqi, R. U. 2008. Cost Overrun Factors in the ... [20] Nasiru, Zakari Muhammad, Kunya Sani Usman, and Abdurrahman. Mutawakkil. 2012.
Regression (MLR) and linear Support Vector Regression (SVR). It attempts to .... Multiple linear regression is an extension of simple linear regression. Simple ...
by I. Golding (Baylor College of Medicine, Houston, TX), was used to ex- press the target ... alyzed using a custom software, described below. Image Analysis.
and δt = {s, f},. (1) where the subscript t denotes a discrete time corresponding to the video frame index, xt and yt represent the bird position in real world ...
followed by a holding step at 60°C for 30 min. ... bins were saved, modified or deleted depending on their fit to the data, with only unambiguously scorable loci.
We have developed the map equation approach to make use of this duality to detect community structure within directed and weighted networks that inherently.
1.3 Pipeline C: probabilistic joint site frequency spectrum . ... genome of Amborella trichopoda [1] using the bioinformatic pipeline A described below. 26. For all ...
Repositioning of a cyclin-dependent kinase inhibitor GW8510 as a ribonucleotide reductase M2 inhibitor to treat human colorectal cancer. Cell Death Discov.
(yes/no). Income. What is the household's monthly income, in average? (1= < $50, 2= $50 - $200, 3= $200 â $400, 4= $400 â $600, 5= $600 - $800, 6 = > $800).
application to real elephant movement data with covariates collected from Kruger ...... structure on the movement behaviour of a specialized goldenrod beetle,.
e-mail address: [email protected]. Abstract ... According to Barnett and Lewis (1994), an outlier is an observation that is inconsistent with the rest of the ...
Keywords: Multiple linear regression, Cross-correlation, Errors-in-variables (EIV) model, Weighted total least squares (WTLS), Regression coefficients.
LETOR dataset is already partitioned in 5 folds, each one of them with train, validation and test sets. Due to memory and time limitations and performance issues ...
suppression without resorting to the standardized regression modeling. The formulation provides a simple basis for the examination of their relationship. For the ...
Abstract--Application of ridge regression in geoscience usually is a more appropriate technique than ordinary least-squares regression, especially in the ...
Appendix S1. Multiple linear regression approach and ...
A forward stepwise multiple linear regression approach was applied to explore the extent to which a combination of independent variables could explain ...
Appendix S1. Multiple linear regression approach and results A forward stepwise multiple linear regression approach was applied to explore the extent to which a combination of independent variables could explain observed variation in the magnitude and timing of diel variation of NO3– concentrations in the Potomac River. The independent variables were based on discharge, water temperature, and photosynthetically active radiation as described in the Methods section of the text. These variables were first explored through Pearson Product Moment correlation with metrics of diel NO3– variation (Table S1). Those variables with p < 0.3 were further explored for inclusion in the best-fit multiple linear regression model. The best-fit model for each diel NO3– metric included all independent variables for which p < 0.05 and the variance inflation factor (VIF) < 6. The VIF threshold ensured that multicollinearity of independent variables was minimal. Best-fit models for each of the diel NO3– metrics are shown in Table S2.
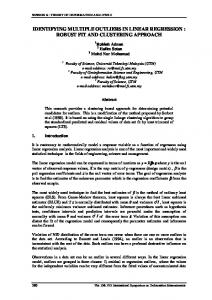
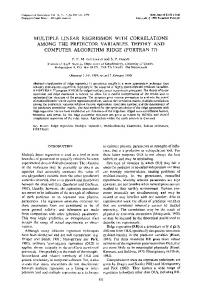
Fig. S1. Comparison of NO3– + NO2– concentrations (conc.) based on 43 manual samples collected in the Potomac River near the Little Falls gage with sensor-based NO3– concentrations measured simultaneously with sample collection.
2.5
NO3- conc. (sensor)
2.0
1.5
1.0
0.5
0.0 0.0
0.5
1.0
1.5
2.0
NO3- + NO2- conc. (grab samples)
2.5
Table S1. Pearson product–moment correlation coefficients of variables based on river discharge (Q), water temperature, seasonality, and photosynthetically active radiation (PAR) with metrics based on the magnitude and timing of diel NO3– variation in the Potomac River at the Little Falls gage. Correlations of variables with daily loss and daily maximum (max) loss were significant (p < 0.05) when r > |0.09| and highly significant (p < 0.001) when r > |0.145|. Correlations of daily mean time of diel max and minimum (min) were calculated using a circular statistics approach. Variables for these correlations were significant when r > 0.109 and highly significant when r > 0.161. Variable Q Q 283 Q 425 Q 566 Q 1-d Q 3-d Q 5-d Q 7-d Q 10-d Q 14-d Sunrise Sunset Day length Water temp Daily mean PAR Daily median PAR Daily max PAR PAR 1-d PAR 3-d PAR 5-d PAR 7-d PAR 10-d PAR 14-d PAR 10%
Description Daily mean Q (m3/s) Days since Q > 283 (m3/s) Days since Q > 425 (m3/s) Days since Q > 566 (m3/s) 1-d antecedent Q (m3/s) 3-dy antecedent Q (m3/s) 5-d antecedent Q (m3/s) 7-d antecedent Q (m3/s) 10-d antecedent Q (m3/s) 14-d antecedent Q (m3/s) Time of sunrise Time of sunset Length of day River temperature 30 cm above bottom (°C) Mean daily PAR (µmol s–1 m–2) Median daily PAR (µmol s–1 m–2) Max daily PAR (µmol s–1 m–2) 1-d antecedent PAR (µmol s–1 m–2) 3-d antecedent PAR (µmol s–1 m–2) 5-d antecedent PAR (µmol s–1 m–2) 7-d antecedent PAR (µmol s–1 m–2) 10-d antecedent PAR (µmol s–1 m–2) 14-d antecedent PAR (µmol s–1 m–2) 10th percentile daily PAR (µmol s–1 m–2)
Daily loss mg/L %
Max daily loss Time of daily max Time of daily min mg/L % Cartesian coordinate Cartesian coordinate
25th percentile daily PAR (µmol s–1 m–2) 75th percentile daily PAR (µmol s–1 m–2) 90th percentile daily PAR (µmol s–1 m–2)
0.192 0.0088 0.040
0.073 0.217 0.244
0.232 0.039 0.071
0.097 0.272 0.298
0.073 0.202 0.215
0.131 0.174 0.176
Table S2. Best-fit multiple linear regression models to explain variation in the magnitude and timing of diel NO3– variation in the Potomac River at Little Falls gage. Models were fit using a forward stepwise regression approach in which the coefficient of determination (R2) was maximized. Models were developed to include the maximum number of variables with p < 0.05 without exceeding a variance inflation factor of 6 for any variable. Q = discharge, PAR = photosynthetically available radiation. See Table S1 for definitions of variables. Regression model