Application of computational fluid dynamics modelling to an ozone ...
Recommend Documents
existing tanks perform poorly at current flows and flow is unevenly split among .... Replaced effluent collection pipes with effluent weirs, (3) Installed modified .... less than 0.004 m of head loss through the baffles, which correlated to a minor l
of Technology, Poland. Please cite ... contamination of air as well as for smooth course of technological ... outlet channel aligned with the central axis of the unit.
Rainey, Thomas and Pennisi, Steve and Joyce, James (2004) Applying
Computational Fluid. Dynamics Modelling to Optimise Environmental
Performance at ...
Real world applications of CFD modelling in the sugar industry are described in this ... These include the reduction of CO, NOx, SOx and particle emissions from.
ers and cheese ripening rooms, it is of paramount importance to control both ...... given air treatment-based food process (drying, ripening, chilling, cooking, etc.) ...
The PHOENICS CFD model produced by Concentration, Heat and ... of PHOENICS for modelling waste stabilization pond hydraulics refer to Shilton (2001).
Feb 16, 2016 - b Department of Chemical and Process Engineering, University of ..... process is based on 300 g/h fluidised bed reactor available at Aston.
Jun 10, 2012 - Industrial Flow Modeling Group, Chemical Engineering and Process Development Division, National Chemical Laboratory, .... Critical analysis of the reported literature shows that .... GodFrey and Zhu9 was presented by Khopkar et al.4, a
Mar 29, 2018 - ... Mat Ivings, Adrian Kelsey, Simon Coldrick, Jim Stewart and Rachel Batt ... Fiates, J., Santos, R.R.C., Neto, F.F., Francesconi, A.Z., Simes, ...
Nov 14, 2018 - ocean current and river hydrokinetic [3]; many of the applications in marine ... From the technical point of view, the conversion of kinetic energy present in large rivers, tides, ... second process deals with converting such mechanica
Nov 14, 2018 - Marten, D.; Wendler, J.; Pechlivanoglou, G.; Nayeri, C.N.; Paschereit, C.O. Qblade: An open source tool for design and simulation of horizontal ...
bringing cutting-edge thinking and best learning ... 3.4.1 Free turbulent flows. 53 .... 12.20 Beta pdf. 382 ... At the time of writing our first edition, CFD was firmly established in the ..... The third part of the book consists of a selection of t
Pearson Education Limited. Edinburgh ..... our book by the CFD community and by the amount of positive feedback ... second edition seeks to enhance and update. ...... whose ends at x = 0 and x = L are kept at constant, but different, tempera- ..... f
12.10, from Nikjooy, M., So, R. M. C. and Peck, R. E. (1988) 'Modelling of. Jet- and ..... A fluid particle follows the flow, so dx/dt = u, dy/dt = v and dz/dt = w. ...... Fletcher (1991) explains that the equation can be classified on the basis of t
All CFD codes contain three main elements: (1) A pre-processor, which is used to input the problem .... On the other hand, if the upstream boundary of the.
Application of the CFD to analyze a fluid problem requires the following steps. ... discretized to produce a numerical analogue of the equations. The domain is ...Missing:
10 9 8 7 6 5 4 3 2 1. 10 09 08 ... Conservative form of the governing equations of fluid flow. 24 ..... it is still up to the skills of the CFD user to design a grid that is a suitable ... are complex and non-linear so an iterative solution approach
Figure 1 Home made portable air conditioner. The evaporator unit consists basically of cooling coil prima- ry copper 1. 4. " wounded around a fan as shown in ...
This chapter has reviewed the numerical studies of the performance two green features used in buildings. For the performance of windcatcher, the air flow rate ...
found that an incorrect matching between the turbine rotor design and the
available ... options for low head pico hydro is a fixed geometry propeller turbine
with a ...
http://www.mathematik.uni-dortmund.de/∼kuzmin/cfdintro/cfd.html .... check for
symmetries and predominant flow directions (1D/2D). • neglect the terms which ...
7.8 Simulation Results for the F&P Completion CaseâDarcy's Law . ...... found by Henry Darcy (1856) [12] through experimentation with water flow through sand ...
... to aerodynamic design and optimization of wind turbine airfoils ... stage, previous to the blade construction. For .... discretized using a second order upwind.
simple support grids or Speziale-Sarkar-Gatski (related to RSM) ... Then a CFD chapter in a modern nuclear thermal hydraulics book is essential; other ...... simpler models in all classes of flows to warrant the additional computational expense.
Application of computational fluid dynamics modelling to an ozone ...
Jan 1, 2004 - The wide range of values found in the literature suggests that the ozone reactions are ... m2·s-2 km. Disinfection rate constant for. Cryptosporidium parvum ... Enhanced Surface Water Treatment Rule (IESWTR) the physical ..... In a long contactor of the configuration discussed in this paper, O3 may have.
Application of computational fluid dynamics modelling to an ozone contactor# Tzu-Hua Huang1, Chris J Brouckaert1*, Martin Pryor2, and Chris A Buckley1 1
Pollution Research Group, School of Chemical Engineering, University of Natal, Durban 4041, South Africa 2 Umgeni Water, PO Box 9, Pietermaritzburg 3200, South Africa
Abstract Computational fluid dynamics (CFD) modelling has been applied to examine the operation of the pre-ozonation system at Wiggins Waterworks, operated by Umgeni Water in Durban, South Africa. A hydraulic model has been satisfactorily verified by experimental tracer tests. The turbulence effect induced by the gas injection was modelled by increasing the level of turbulence intensity at the ozone contactor inlet. The simulated tracer response corresponded closely to the experimental results. The framework of ozone reaction modelling was subsequently investigated using values of rate constants from the literature. The predicted profile of residual ozone concentration suggests the current operating strategy can be improved to optimise the ozone utilisation. The wide range of values found in the literature suggests that the ozone reactions are strongly dependent on site-specific characteristics of the water. Further experimental work is required to determine rate constants which are applicable to water from the Inanda Dam.
Keywords: ozone reaction kinetics, CFD modelling, disinfection, rate constants, residence time distribution
Nomenclature C(t) Ci CO3 f(t) k km kr ks N N0 T T V
Concentration of tracer Tracer concentration at time i Residual ozone concentration RTD density function Turbulent kinetic energy Disinfection rate constant for Cryptosporidium parvum Ozone consumption rate constant Ozone self-decomposition rate constant Number of surviving micro-organisms at time t Number of controlled micro-organisms at t = 0 Time Mean residence time Mean velocity magnitude
Greek letters ∆t Time increment α(t) Average mass fraction of tracer ε Turbulent dissipation energy
kg·m-3 or g·l-1 kg·m-4 or g·l-1 mg·l-1 m2·s-2 m3·kmol·s-1 m3·kmol·s-1 l·s-1 s or min s or min m·s-1
s m2·s-3
Introduction Ozonation is used in drinking water treatment primarily to oxidise iron and manganese, to reduce odour- or taste-causing compounds, and to inactivate micro-organisms. The peripheral benefits include possible reduction in coagulant demand, enhancement of algae and colour removal. Ozonation of water is typically carried out by
dispersing gas containing ozone into the liquid phase. The contact between the two phases accompanied by an ozone mass transfer takes place in ozone contactors (Bin and Roustan, 2000). CT concept and the disinfection purpose of ozone The most important hydraulic characteristic of an ozone contactor is its residence time distribution (RTD). Under the US EPA Interim Enhanced Surface Water Treatment Rule (IESWTR) the physical removal or the inactivation of waterborne pathogens during disinfection of drinking water is specified in terms of CT which is the numeric product of the residual ozone outlet concentration (C) and a characteristic contact time (T) (USEPA, 1999). The value of CT is dependent on the target species and the disinfectant. The effective contact time is taken to be T10 rather than the mean hydraulic retention time. T10 is the time required for 10% of a pulse of a tracer introduced at the disinfectant dosing point to have reached the residual sampling point. Thus T10 can be derived from the RTD of a contactor, which in turn, is affected by its geometry and operating conditions. Cryptosporidium parvum is a parasitic protozoan which infects humans and may cause gastroenteric disease. Due to its relatively high resistance to free chlorine, its control is a particular problem for water treatment works. Several studies have reviewed the superior efficacy of ozone for control of C. parvum (Staehlin and Hoigné, 1985; Korich et al., 1990; Gyürék et al., 1999; Driedger et al., 2000; Rennecker et al., 2000). Because of the large CT value for C. parvum (up to 5 mg O3·min·l-1) its reaction with ozone is chosen to indicate the disinfection performance of the contactor. Ozone contacting system at Wiggins Waterworks
Revised version. Paper originally accepted as a poster presentation at the WISA 2002 Conference in Durban, South Africa, in May 2002. * To whom all correspondence should be addressed. +2731 260 1122; fax: +2731 260 1118; e-mail: [email protected] Received 12 December 2002; accepted in revised form 17 September 2003.
The pre-ozonation system at Wiggins Waterworks, operated by Umgeni Water in Durban, consists of four contactors. Each contactor is preceded by a static mixer so that every chamber can operate individually or in parallel with another contactor. The Sulzer static mixer is 1 m in diameter. An ozone-oxygen gas mixture is injected as a side-stream through the static mixer which
Available on website http://www.wrc.org.za
ISSN 0378-4738 = Water SA Vol. 30 No. 1 January 2004
#
51
weir (outlet)
drainage pipe
static mixer (inlet)
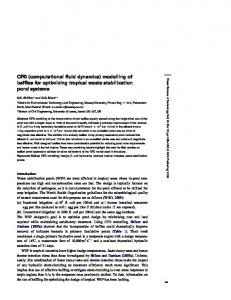
Figure 1 Geometry of the ozone contactor
(c) isometric view (a) plan view
6.2m
12.3m (b) front view
is employed to achieve high mass transfer of ozone to water. The pre-ozonation system has an unusual configuration, as it was converted from an existing structure. Water enters from the static mixer at the bottom, and passes through three horizontal compartments before it exits over the weir at the top. (Fig. 1) The operating rule for selecting the number of contact chambers in use aims to achieve an acceptable efficiency of ozone transfer in the static mixers. As the flow through the plant changes, the number of contactors in operation is changed. However the effectiveness of disinfection also depends on the CT in the contactor, which implies the need for a more sophisticated operating strategy. Why CFD? In contrast to a mixed-compartment modelling approach, computational fluid dynamic (CFD) modelling offers the advantage of a fundamental physical basis for representing the complex interaction between flow and chemical reaction phenomena. CFD modelling is based on the solution of sets of partial differential equations, which express the local and temporal phenomena, i.e. local momentum, energy, mass and transport balances. Because of the increasing power of computers, CFD modelling becomes an useful tool to analyse a complex system, such as an ozone contactor. The operation of the pre-ozonation system at the Wiggins Waterworks has been investigated with the following objectives: • • •
To determine the actual liquid residence time distribution To select the most appropriate position for monitoring residual ozone concentration To optimise the disinfection efficiency of the contactors by modelling the kinetic reactions to achieve the most efficient use of the ozone dosed to the system
The USEPA techniques stipulate that: (i) in the absence of an RTD result, table of conservative design factors may be used; (ii) if an experimental RTD result is available then the experimental value of T10 is to be used. CFD modelling can generate RTD results which could be used in method (ii).
52
ISSN 0378-4738 = Water SA Vol. 30 No. 1 January 2004
13.7m (d) side view
However, the power of CFD is such that a more rigorous approach can be adopted. The reactions involving the target species and the disinfectant can be incorporated in solution of the flow field so as to explicitly calculate the exit concentration of the target species. This paper discusses the verification of the hydraulic model and the framework of implementing the ozone reaction kinetics on the verified hydraulic model.
Hydrodynamics Fluent 5.5.14 was the software used for the CFD modelling. The details of setting up the initial model have been described elsewhere (Brouckaert et al., 2000; Huang et al., 2001). The 3D model discussed in this paper only considered the flow of water. The interest of this investigation is in the overall RTD of the contactor, rather than the interaction between the gas and liquid phase. The assumption is based on the near complete dissolution of ozone in water when the flow emerges from the static mixer. The gas flow rate is only about 1% v/v of the water flow rate. Once ozone is dissolved the oxygen in the stream remains as gas bubbles. Any hydraulics effect introduced by the bubbles or the mixer was indirectly represented by an increase in the turbulent mixing in this one-phase model. The turbulent intensity was adjusted to give the predicted RTD best fit to the experimental data. Experimental tracer tests Tracer tests were undertaken in order to experimentally determine the RTD of the contactor. Lithium chloride was the chosen tracer for its chemical stability and detectability at low concentration. Two tracer tests were carried out under different conditions, i.e. with and without gas injection. Approximately 7.8 kg of lithium chloride was used in each test. The water and gas were maintained at steady flow rates for the duration of the tracer tests. Three sampling points were positioned along the weir, one pair on 2 m in from the side, and the 3rd one in the centre of the weir. Samples were taken simultaneously at three points and were subsequently analysed using an atomic absorption spectrophotometer. From the experimental tracer tests, the tracer response curves for the cases with and without gas injection showed a similar pattern in the overall RTD, with some difference in detail. The inlet
Available on website http://www.wrc.org.za
2.5E-6
2 m from LHS
2.5 2.0
Simulated tracer mass fraction
Measured tracer concentration [mg/L]
3.0
Overall average
1.5
Centre 2 m from RHS
1.0 0.5 0.0
2.0E-6 Overall average 1.5E-6
2 m from RHS
1.0E-6
2 m from LHS
5.0E-7
0.0E+0
0
500
1000
1500
2000
2500
3000
2000
3000
2500
Time, t, [sec]
Figure 2 Experimental tracer response curves at various points along the outlet weir without gas injection.
Figure 4 Tracer response curve of 10% turbulence intensity ratio
3.0
2.5E-6
2.5
Simulated tracer mass fraction
Measured tracer concentration [mg/L]
1500
1000
500
0
Time, t, [sec]
2 m from LHS 2.0
2 m from RHS
1.5 Overall average 1.0
Centre
0.5
2 m from RHS
2.0E-6
1.5E-6
2 m from LHS 1.0E-6
Overall average 5.0E-7
0.0E+0
0.0 0
500
1000
1500
2000
2500
0
3000
500
1000
1500
2000
2500
3000
Time, t, [sec]
Time, t, [sec]
Figure 3 Experimental tracer response curves at various points along the outlet weir with gas injection.
Figure 5 Tracer response curve of 20% turbulence intensity ratio 2.5E-6
-1
flow rates were 107.3 Ml·d and 108.3 Ml·d , with and without gas respectively. Without gas injection, the measured concentration appeared slightly higher on the left side of the weir and the residence time distribution was narrower (Fig. 2) than the case when gas was present (Fig. 3). However, the shape of the overall response was retained. The uneven distribution of liquid flow, with more going to the left side, was observed irrespective of gas injection. The effect was more pronounced when the gas was absent, as shown in Fig. 2.
2 m from LHS Simulated tracer mass fraction
-1
2.0E-6
Centre 1.5E-6
2 m from RHS
1.0E-6
5.0E-7
Overall average 0.0E+0 0
500
1000
1500
2000
2500
3000
Time, t, [sec]
CFD simulated tracer tests The same flow-rate values were used in the CFD simulations as in the experimental tests. The FLUENT software provides a number of established models for turbulence and boundary layer flow in the vicinity of walls. The widely used k-ε model was chosen for the turbulence modelling. After specifying the geometry of the system and the inlet flow rate, the only other parameter required from the user was the turbulence intensity (TI) as shown in Eq. 1. TI is the ratio of the kinetic energy contained in turbulent fluctuations to the kinetic energy due to the mean velocity. 2 k 3 TI = V
(1)
The use of TI ratio helps to provide estimated values of k and e in the turbulent model. Values of 10, 20 and 50% TI ratio were tested, and the tracer response curves are plotted as the dimensionless
Available on website http://www.wrc.org.za
Figure 6 Tracer response curve of 50% turbulence intensity ratio
tracer mass fraction against flow time as shown in Figs. 4 to 6. CFD hydraulic model verification In order to achieve a comparable basis between the experimental data and the simulation results the RTD density function was calculated from the mass balance of the tracer. For example, in the experimental tracer test at a constant flow rate, f (t) is calculated as follows:
f (t ) =
C(t ) ∞
≈
i =∞
Ci
∫ C(t )dt ∑ C ∆t i
0
(2)
i =0
ISSN 0378-4738 = Water SA Vol. 30 No. 1 January 2004
53
2.0E-3
in the liquid consist of oxidisable species such as dissolved organic compounds, or reduced inorganic species such as Fe II and Mn II. Although pathogens form part of the OCS, they consume a negligible amount of ozone due to their extremely low concentrations. The disinfection reaction is therefore modelled as a separate reaction.
RTD density function, f(t)
T10 = 5.3 min T = 12.5 min
1.5E-3
Exp - with gas Exp - without gas ST - 50%TI ST - 10%TI
1.0E-3
Rate constants
5.0E-4
0.0E+0 0
10
20
30
40
50
60
Time, t, [min]
Figure 7 Comparison of predicted RTD density function with experimental data. The mean residence time and T10 are calculated from the experimental data with gas. Exp – experimental tracer test, ST – simulated tracer test
dissolved ozone
consumption
self-decomposition
The rate constants for the reactions categorised in Fig. 8 are taken from literature for the kinetic modelling. Extensive studies have been conducted to investigate the reactions of ozone with different organic compounds using predictive models; however, the adequacy of the model is difficult to achieve due to the complexity and variety of the constituents in raw water (Park et al., 2001). The application of the rate constants and assumptions will be discussed below. Self-decomposition The self-decomposition of ozone in water has been studied by several authors as a first-order reaction (Sotelo et al., 1987; Beltrán, 1995; Muroyama et al., 1999). The reaction rate was observed to increase with increasing pH and dissolved ozone concentration. The self-decomposition rate constant, ks, was examined by Beltrán (1995) over a wide range of pH values. For the present model, the value at pH 7 was used. k = 4.8 × 10 -4 l·s-1 s
by OCS
by pathogens species e.g.C. parvum
Figure 8 The distribution of dissolved ozone
In the case of the simulated tracer test, the mass fraction of the tracer, a(t) replaces the concentration of the tracer, C(t), in the above equation. Hence the area under the curve must be unity when integrating over time. The RTD density function, f(t), was plotted against flow time, t. Although the gas injection did shift the distribution of flow between the left and right sides of the contactor slightly, its effect on the overall residence time distribution was remarkably small. The model prediction using 50% turbulence intensity ratio agrees especially well with the experimental data (Fig 7). The variation of tracer response along the weir predicted by the model was confirmed by the experimental profiles, with tracer appearing slightly earlier on the left than on the right side.
Consumption by ozone-consuming substance The dissolved OCS may react with ozone or be oxidised by OH· radicals which are formed from ozone decomposition (Hoigné and Bader, 1983a; Hoigné et al., 1985). However, no general correlation is currently available to relate the ozone consumption with the decomposition of OCS. Muroyama et al. (1999) assumed the reaction between ozone and the OCS is first order with respect to ozone and to the OCS. The ozone consumption reaction rate constant, kr, was referenced by Muroyama et al. (1999) from experimental results and is calculated to be: The amount of OCS present in the water is estimated from the total organic carbon (TOC) content in water, using glucose as a representative molecule. A typical value of TOC in the Wiggins raw water is 3.3 mg·l-1, which yields 8.26 mg·l-1 OCS. Disinfection The reaction kinetics between C. parvum and ozone is based on the classical Chick-Watson inactivation model,
log
Ozone reaction kinetics The use of ozone in water treatment is generally based on the concept that reactions occur between dissolved ozone with watersoluble substances. The distribution of the ozone introduced can be globally categorised into off-gas losses, consumption, and loss by self-decomposition. (Bredtmann, 1982). Since the transfer efficiency of static mixers has been reported to be very high, about 85 to 98% (Bin and Roustan, 2000), for the present model, it is assumed that there is negligible off-gas loss. Ozone reactions in water are generally rather complex (Hoigné and Bader 1983a;b; Hoigné et al., 1985, Sotelo et al., 1987, Park et al., 2001). For the purpose of the reaction kinetic modelling in this paper, the depletion of the dissolved ozone can be represented schematically in Fig. 8. The ozone-consuming substances (OCS)
54
ISSN 0378-4738 = Water SA Vol. 30 No. 1 January 2004
N = −k µ C O3 t N0
(3)
where: N/N0 is the survival ratio of the micro-organism CO3 is the residual ozone concentration t is the contact time km is the inactivation rate constant. The value of km appears to be influenced by the quality of water, such as pH and temperature. This is reflected by the wide range of km reported in the literature (Joret et al., 1997; Gyürék et al.,1999, Do-Quang et al., 2000, Rennecker et al., 2000, Driedger et al., 2000, Li et al.,2001). For this paper, the disinfection rate constant, kµ , was calculated from the experimental results reported by Li et al. (2001) using an average residual ozone concentration 0.85 mg·l-1 and a contact time of 4 min, with the observed kill of 1.5 log-
Available on website http://www.wrc.org.za
TABLE 1 Input values for kinetic modelling of ozone reactions Species Ozone Ozone-consuming substances Cryptosporidium parvum
Inlet mass fraction 2.5 x 10⁻⁶ 8.26 x 10⁻⁶ 1.0 x 10⁻⁸
units. From Eq. (2). kµ = 0.441 l·mg-1·min-1 = 352.9 m3·kmol-1·s-1 The Fluent reaction modelling framework requires the reactant concentrations to be specified as mass fractions. In the case of pathogens, the mass fraction is not known. The measure of interest is the survival ratio N/N0, representing the probability that a viable organism will survive the process. To represent this in the model, the inlet mass fraction was set to an arbitrary value of 10-8, and survival ratios were calculated by ratioing simulated mass fractions to this value. The value 10-8 was simply chosen to be low enough for its effect on the ozone consumption to be negligible. The main input parameters are summarised in Table 1.
Figure 9 Simulated ozone concentration in mg/l. Base case – inlet OCS mass fraction = 8.26 x 10⁻⁶
CFD disinfection results Two cases of different ozone-consuming substance loading were examined. The level of OCS changes with the water quality, and hence the residual ozone concentration is dependent on the OCS loading. The inlet mass fraction of the ozone-consuming substance for the base case is as listed in Table 1. The comparison was made with doubling the OCS inlet mass fraction of the base case to obtain the value of 1.652 x 10⁻⁵ . The simulated residual ozone concentration for the base case (Fig. 9) indicated that most of the ozone introduced is reacted in the lowest compartment. At the higher OCS level, the distribution of ozone concentrations throughout the reactor is significantly altered (Fig. 10). The disinfection performance of the contactor on the present operating condition is illustrated in Fig. 11, indicating that the removal of C. parvum is more than 99%. The OCS level was doubled for the purpose of comparison. Although the OCS concentration was still low, the removal dropped to 90%. The increase in OCS loading significantly increases the C. parvum survival ratios (Fig. 12). This means that with higher OCS loading, an increase in the ozone dosage is needed.
Figure 10 Simulated ozone concentration in mg/l. Comparative case – inlet OCS mass fraction = 1.652 x 10⁻⁶
Figure 11 Simulated survival ratio of C. parvum. Base case – inlet OCS mass fraction =
Discussion Modelling the effect of gas injection by simply increasing the turbulent intensity is clearly a very rough approximation, and cannot be expected to provide an accurate description of the detailed flow patterns in the contactor. A full two-phase model, besides involving considerably greater computational difficulties, would also introduce many unknown factors and uncertainties concerning aspects such as bubble size, bubble coalescence, etc. The model and experimental results showed reasonably qualitative agreement with the left / right distribution of flow.
Available on website http://www.wrc.org.za
Figure 12 Simulated survival ratio of C. parvum. Comparative case – inlet OCS mass fraction =
ISSN 0378-4738 = Water SA Vol. 30 No. 1 January 2004
55
On this aspect the high turbulent intensity model resembled the experiment with no gas injection better than the experiment with gas injection, which is contrary to what one might expect. However, the main purpose of the model is to predict the disinfection performance of the contactor, and the very good agreement obtained between the approximate model and the overall experimental RTD indicated that the model is adequate. The current operating strategy requires improvement to optimise the ozone utilisation, although there may be some limitation on the equipment, such as the maximum throughput of the static mixer. The figures from the kinetic modelling should not be taken as definitive as it is not known how well the kinetic data from literature apply to the Wiggins raw water. Nevertheless the variation in the profile of ozone concentration indicated that OCS is a significant factor. As the rate constants were found to be dependent on the local water source, a specific kinetic study is thus required to characterise the raw water supply from the Inanda Dam. The CT concept is an approximate approach which requires the liquid residence time, the inlet and outlet concentrations of the dissolved O3. This approach has been developed for the conventional ozone contactor with multiple dosing points. In a long contactor of the configuration discussed in this paper, O3 may have all been depleted before the end of the contactor. The depletion of ozone will not only be due to reactions with the target species, and hence the ozone concentration at the outlet will not be appropriate for the CT formula. One of the advantages of CFD modelling in this investigation is to examine the different scenarios and positions to locate the most suitable point for monitoring the residual ozone concentration. From the simulated results obtained thus far, it would appear that it would be best to choose a monitoring point at the end of the second compartment.
Conclusion The OCS variation is shown to have a significant effect on the residual ozone concentration profile. Application of CFD modelling to a full-scale ozone contactor has been demonstrated in this paper. With sufficient validation from experimental data the simulated results can provide information to a more effective operation of an ozone contactor. For future work, an experimental study on the ozone demand of the water is required to characterise the raw water supplied to Wiggins Waterworks. The ozone contactor will be equipped with 3 residual ozone sensors to provide data on the local ozone concentration at selected positions, and to aid the validation of the CFD model. There are 6 internal points located in all three compartments. The positions of these points were chosen based on the simulation results, and a monitoring program will be in place for data collection.
Acknowledgements This paper forms a part of the project entitled Computational fluid dynamic support to water research projects which has been funded by the South African Water Research Commission. The input from the University of Natal Research Fund is acknowledged. The chemical analyses were carried out by Umgeni Water Analytic Services, and the technical support from Wiggins Waterworks is greatly appreciated. The authors would like to express their special gratitude to Mr Rachi Rajagopaul, Process Evaluation Facility at Wiggins Waterworks, Mr Dan Naidoo, and Mr Mohammed Docrat,
56
ISSN 0378-4738 = Water SA Vol. 30 No. 1 January 2004
Wiggins Operation staff, for their assistance in carrying out the experimental tracer tests.
References BELTRÁN FJ (1995) Theoretical aspects of the kinetics of competitive ozone reactions in water. Ozone Sci. Eng. 17 (2) 163-181. BIN AK and ROUSTAN M (2000) Mass transfer in ozone reactors. Proc.Int. Spec. Symp. IOA 2000: Fundamental and Engineering Concepts for Ozone Reactor Design. Toulouse, France. BREDTMANN M (1982) Significance of the ozone to water contacting system. In: Masschelein WJ (ed.) Ozonation Manual for Water and Wastewater Treatment. New York, John Wiley and Sons: 129-132. BROUCKAERT CJ, PRYOR M, BROUCKAERT BM and BUCKLEY CA (2000) A computational fluid dynamic study of an ozone contactor. Proc. WISA Conf. Sun City, South Africa. DO-QUANG Z, ROUSTAN M and DUGUET J-P (2000) Mathematical modelling of theoretical Cryptosporidium inactivation in full-scale ozonation reactors. Ozone Sci. Eng. 22 99-111. DRIEDGER AM, RENNECKER JL and MARIÑAS BJ (2000) Sequential inactivation of Cryptosporidium parvum oocysts with ozone and free chlorine. Water Res. 34 (14) 3591-3597. GYÜRÉK LL, LI H, BELOSEVIC M and FINCH GR (1999) Ozone inactivation kinetics of Cryptosporidium in phosphate buffer. J. Environ. Eng. 125 (10) 913-924. HOIGNÉ J and BADER H (1983a) Rate constants of reactions of ozone with organic and inorganic compounds in water - I Non-dissociating organic compounds. Water Res. 17 173-183. HOIGNÉ J and BADER H (1983b) Rate constants of reactions of ozone with organic and inorganic compounds in water - II Dissociating organic compounds. Water Res. 17 185-194. HOIGNÉ J, BADER H, HAAG WR and STAEHELIN J (1985) Rate constants of reactions of ozone with organic and inorganic compounds in water -III Inorganic compounds and radicals. Water Res. 19 (8) 9931004. HUANG T, BROUCKAERT CJ, DOCRAT M, PRYOR M and BUCKLEY CA (2001) A computational fluid dynamic and experimental study of an ozone contactor. IWA Conf.: Water and Wastewater Management for Developing Countries. Kuala Lumpur, Malaysia. JORET J-C, MENNECART V, ROBERT C, COMPAGNON B and CERVANTES P (1997) Inactivation of indigenous bacteria in water by ozone and chlorine. Water Sci. Technol. 35 (11-12) 81-86. KORICH DG, MEAD JR, MADORE MS, SINCLAIR NA and STERLING CR (1990) Effects of ozone, chlorine dioxide, chlorine, and monochloramine on Cryptosporidium parvum oocyst viability. Appl. Environ. Microbiol. 56 (5) 1423-1428. LI H, FINCH GR, SMITH DW and BELOSEVIC M (2001) Sequential inactivation of Cryptosporidium parvum using ozone and chlorine. Water Res. 35 (18) 4339-4348. MUROYAMA K, NORIEDA T, MORIOKA A and TSUJI T (1999) Hydrodynamics and computer simulation of an ozone oxidation reactor for treating drinking water. Chem. Eng. Sci. 54 5285-5292. PARK H-S, HWANG T-M, KANG J-W, CHOI H and OH H-J (2001) Characterization of raw water for the ozone application measuring ozone consumption rate. Water Res. 35 (11) 2607-2614. RENNECKER JL, DRIEDGER AM, RUBIN SA and MARIÑAS BJ (2000) Synergy in sequential inactivation of Cryptosporidium parvum with ozone/free chlorine and ozone/monochloramine. Water Res. 34 (17) 4121-4130. STAEHLIN J and HOIGNÉ J (1985) Decomposition of ozone in water in the presence of organic solutes acting as promoters and inhibitors of radical chain reactions. Environ.Sci. Technol. 19 1206-1213. SOTELO JL, BELTRÁN FJ, BENÍTEZ FJ and BELTRÁN-HEREDIA J (1987). Ozone decomposition in water: Kinetic Study. Ind. Eng. Chem. Res. 26 39-43. USEPA (1999) Disinfection, Profiling and Benchmarking Guidance Manual. United States Environmental Protection Agency (EPA) Office of Water, EPA 815-R-99-013.