7.8 Simulation Results for the F&P Completion CaseâDarcy's Law . ...... found by Henry Darcy (1856) [12] through experimentation with water flow through sand ...
APPLICATION OF COMPUTATIONAL FLUID DYNAMICS TO NEAR-WELLBORE MODELING OF A GAS WELL
A Thesis Submitted to the Graduate Faculty of the Louisiana State University and Agricultural and Mechanical College in partial fulfillment of the requirements for the degree of Master of Science in Petroleum Engineering
by Oscar Mauricio Molina BS, Universidad Pontificia Bolivariana, 2007 August 2015
Acknowledgments I would like to thank Shell Oil E&P US for providing the financial support to this research project.
ii
Table of Contents Acknowledgments . . . . . . . . . . . . . . . . . . . . . . . . . . . . . . . . . . . . .
ii
List of Tables . . . . . . . . . . . . . . . . . . . . . . . . . . . . . . . . . . . . . . .
vi
List of Figures . . . . . . . . . . . . . . . . . . . . . . . . . . . . . . . . . . . . . .
vii
Abstract . . . . . . . . . . . . . . . . . . . . . . . . . . . . . . . . . . . . . . . . . .
x
1 Introduction . . . . . . . . . . . . . . . . . . . . . . . . . . . . . . . . . . . . . .
1
2 Statement of the Problem . . . . . . . . . . . . . . . . . . . . . . . . . . . . . .
7
3 Literature Review . . . . . . . . . . . . . . . . . . . . . . . . . . . . . . . . . . .
9
4 Theoretical Background . . . . . . . . . . . . . . . . . . . . . . . 4.1 Fracture Modeling . . . . . . . . . . . . . . . . . . . . . . . 4.2 Fluid Flow in Porous Media . . . . . . . . . . . . . . . . . . 4.2.1 Darcy’s Law . . . . . . . . . . . . . . . . . . . . . . . 4.2.2 Forchheimer Formulation . . . . . . . . . . . . . . . . 4.3 Computational Fluid Dynamics . . . . . . . . . . . . . . . . 4.3.1 Turbulence Modeling . . . . . . . . . . . . . . . . . . 4.3.2 Coupling of Porous Media-Turbulence Models . . . . 4.3.3 Meshing . . . . . . . . . . . . . . . . . . . . . . . . . 4.3.4 Equation of State and Fluid Viscosity Model . . . . . 4.3.5 Material Balance: Convergence and Accuracy . . . . 4.3.6 Physical Timescale . . . . . . . . . . . . . . . . . . . 4.3.7 Methodology . . . . . . . . . . . . . . . . . . . . . . 4.4 Steady-State Well Model and Well Completion Performance 4.4.1 Steady-State Well Model . . . . . . . . . . . . . . . . 4.4.2 Compressible Flow Well Model . . . . . . . . . . . . 4.4.3 Well Completion Performance and NODAL Analysis iii
. . . . . . . . . . . . . . . . .
. . . . . . . . . . . . . . . . .
. . . . . . . . . . . . . . . . .
. . . . . . . . . . . . . . . . .
. . . . . . . . . . . . . . . . .
. . . . . . . . . . . . . . . . .
. . . . . . . . . . . . . . . . .
. . . . . . . . . . . . . . . . .
14 14 15 15 16 18 19 21 22 23 24 25 26 26 26 27 28
4.5
Fines 4.5.1 4.5.2 4.5.3 4.5.4 4.5.5
Migration Analysis . . . . . . . . . . . . . Particle Transport Theory . . . . . . . . Momentum Transfer . . . . . . . . . . . Wentworth Scale . . . . . . . . . . . . . Variations on Permeability and β Factor Finnie Model for Erosive Wear . . . . . .
. . . . . .
. . . . . .
. . . . . .
. . . . . .
. . . . . .
. . . . . .
. . . . . .
. . . . . .
. . . . . .
. . . . . .
. . . . . .
. . . . . .
. . . . . .
. . . . . .
. . . . . .
30 30 30 31 31 32
5 Description of Simulation Case Studies . . . . . . . . 5.1 Verification Case Study . . . . . . . . . . . . . . 5.2 Post-Processing of Well Completion Simulations 5.3 Darcy versus Forchheimer Formulation . . . . . 5.4 Well Completion Performance . . . . . . . . . . 5.5 Fines Migration Analysis . . . . . . . . . . . . .
. . . . . .
. . . . . .
. . . . . .
. . . . . .
. . . . . .
. . . . . .
. . . . . .
. . . . . .
. . . . . .
. . . . . .
. . . . . .
. . . . . .
. . . . . .
. . . . . .
. . . . . .
33 33 34 35 35 35
6 Methodology . . . . . . . . . . . . . . . . . . . 6.1 Geometry and CAD Models . . . . . . . . 6.2 Meshing and Mesh Statistics . . . . . . . . 6.3 Computational Fluid Dynamics Modeling . 6.3.1 Simulation Pre-Processing . . . . . 6.3.2 Numerical Solving Process . . . . . 6.3.3 Simulation Post-Processing . . . . .
. . . . . . .
. . . . . . .
. . . . . . .
. . . . . . .
. . . . . . .
. . . . . . .
. . . . . . .
. . . . . . .
. . . . . . .
. . . . . . .
. . . . . . .
. . . . . . .
. . . . . . .
. . . . . . .
. . . . . . .
37 37 39 40 40 43 43
7 Results and Discussion . . . . . . . . . . . . . . . . . . . . . . . . . . . . 7.1 Verification Case . . . . . . . . . . . . . . . . . . . . . . . . . . . . 7.2 Gravel Pack Completion . . . . . . . . . . . . . . . . . . . . . . . . 7.2.1 Case Study 1 (Lp = 0.5 ft) . . . . . . . . . . . . . . . . . . . 7.2.2 Case Study 2 (Lp = 1 ft) . . . . . . . . . . . . . . . . . . . . 7.3 Frac Pack Completion . . . . . . . . . . . . . . . . . . . . . . . . . 7.3.1 Pressure Distribution . . . . . . . . . . . . . . . . . . . . . . 7.3.2 Velocity Profile and Flow Behavior . . . . . . . . . . . . . . 7.3.3 Turbulence Kinetic Energy and Turbulence Eddy Frequency 7.3.4 Darcy’s Law versus Forchheimer Formulation . . . . . . . . 7.3.5 Analysis of Well Completion Schemes Performance . . . . . 7.3.6 Fines Migration Simulation Analysis . . . . . . . . . . . . .
. . . . . . . . . . . .
. . . . . . . . . . . .
. . . . . . . . . . . .
. . . . . . . . . . . .
44 44 46 46 52 58 59 61 64 65 66 67
iv
. . . . . . .
. . . . . . .
. . . . . . .
8 Summary, Conclusions and 8.1 Summary . . . . . . 8.2 Conclusions . . . . . 8.3 Future Work . . . . .
Future Work . . . . . . . . . . . . . . . . . . . . . . . .
. . . .
75 75 75 76
Bibliography . . . . . . . . . . . . . . . . . . . . . . . . . . . . . . . . . . . . . . .
77
Vita . . . . . . . . . . . . . . . . . . . . . . . . . . . . . . . . . . . . . . . . . . . .
84
v
. . . .
. . . .
. . . .
. . . .
. . . .
. . . .
. . . .
. . . .
. . . .
. . . .
. . . .
. . . .
. . . .
. . . .
. . . .
. . . .
. . . .
. . . .
. . . .
. . . .
. . . .
List of Tables 1.1
Typical Unstressed Gravel Permeabilities . . . . . . . . . . . . . . . . . . .
3
1.2
Typical Proppant Porosity and Pore Throat Size . . . . . . . . . . . . . . .
4
4.1
Classification of Common Grain Sizes . . . . . . . . . . . . . . . . . . . . .
31
5.1
Produced Sand Grain Size Distribution . . . . . . . . . . . . . . . . . . . .
36
6.1
Common Near-Wellbore Geometry Dimensions . . . . . . . . . . . . . . . .
37
6.2
Global Simulation Case Studies Mesh Statistics . . . . . . . . . . . . . . .
40
6.3
General CFD Simulation Conditions . . . . . . . . . . . . . . . . . . . . .
41
6.4
Domain Definition of Porous Media subdomains . . . . . . . . . . . . . . .
42
7.1
Numerical Comparison Between Analytical Model and CFD Simulation . .
45
7.2
Simulation Results for Gravel Pack (Case 1) . . . . . . . . . . . . . . . . .
46
7.3
NODAL Analysis of the Near-Wellbore Region (Gravel Pack, Case 1) . . .
48
7.4
Simulation Results for Gravel Pack (Case 2) . . . . . . . . . . . . . . . . .
52
7.5
NODAL Analysis of the Near-Wellbore Region (Gravel Pack, Case 2) . . .
54
7.6
Simulation Results for the F&P Completion Case . . . . . . . . . . . . . .
59
7.7
NODAL Analysis of the Near-Wellbore Region (Frac-Pack) . . . . . . . . .
61
7.8
Simulation Results for the F&P Completion Case—Darcy’s Law . . . . . .
65
7.9
Fines Migration Analysis Results (Top/Bottom Layer) . . . . . . . . . . .
68
7.10 Fines Migration Analysis Results (Frac Pack) . . . . . . . . . . . . . . . .
68
8.1
75
Summary of CFD Simulation Runs . . . . . . . . . . . . . . . . . . . . . .
vi
List of Figures 1.1
Schematic of a gravel pack completion (adapted from Matanovi´c et al., 2012)
2
1.2
Common types of fracture shape models in F&P completion . . . . . . . .
4
1.3
Produced sand inside a surface equipment . . . . . . . . . . . . . . . . . .
5
1.4
Stable sand arch around a perforation tunnel (from Carlson et al., 1992) .
6
2.1
Level of coupling of the near-wellbore physical models . . . . . . . . . . . .
8
4.1
PKN and KGD rock fracture models (adapted from Economides, 2000) . .
14
4.2
Velocity averaging methods (adapted from Ranade, 2001) . . . . . . . . . .
20
4.3
Common CFD volume mesh elements . . . . . . . . . . . . . . . . . . . . .
22
4.4
Inflow performance relationships (adapted from Economides et al., 2000) .
29
4.5
NODAL analysis of the near-wellbore region . . . . . . . . . . . . . . . . .
30
6.1
Geometry of the gravel pack model . . . . . . . . . . . . . . . . . . . . . .
38
6.2
Geometry of the frac pack model . . . . . . . . . . . . . . . . . . . . . . .
38
6.3
Detailed mesh view of the gravel-pack completion models . . . . . . . . . .
39
6.4
Mesh definition for the F&P completion model . . . . . . . . . . . . . . . .
40
7.1
Simulated and analytical pressure distribution . . . . . . . . . . . . . . . .
45
7.2
Pressure distribution at various pressure drawdowns (Lp = 0.5 ft) . . . . .
47
7.3
Streamlines in the r-direction at different depths (Lp = 0.5 ft) . . . . . . .
49
7.4
Cross-sectional flow pattern (Lp = 0.5 ft) . . . . . . . . . . . . . . . . . . .
49
7.5
Velocity inside the gravel pack region (Lp = 0.5 ft) . . . . . . . . . . . . . .
50
7.6
Detailed streamlines plot inside the wellbore (Lp = 0.5 ft) . . . . . . . . . .
50
7.7
Turbulence kinetic energy (Lp = 0.5 ft) . . . . . . . . . . . . . . . . . . . .
51
vii
7.8
Turbulence eddy frequency (Lp = 0.5 ft) . . . . . . . . . . . . . . . . . . .
51
7.9
Pressure distribution at various pressure drawdowns (Lp = 1 ft) . . . . . .
53
7.10 Pressure distribution inside perforation tunnels
. . . . . . . . . . . . . . .
55
7.11 Streamlines in the r-direction at different depths (Lp = 1 ft) . . . . . . . .
55
7.12 Cross-sectional flow pattern (Lp = 1 ft) . . . . . . . . . . . . . . . . . . . .
56
7.13 Velocity inside the gravel pack region (Lp = 1 ft) . . . . . . . . . . . . . . .
56
7.14 Detailed streamlines plot inside the wellbore (Lp = 1 ft) . . . . . . . . . . .
57
7.15 Turbulence kinetic energy (Lp = 1 ft) . . . . . . . . . . . . . . . . . . . . .
58
7.16 Turbulence eddy frequency (Lp = 1 ft) . . . . . . . . . . . . . . . . . . . .
58
7.17 Pressure distribution at different pressure drawdowns (xf = 1 ft) . . . . . .
60
7.18 Streamlines in the r-direction at different depths (xf = 1 ft) . . . . . . . .
62
7.19 Cross–sectional flow pattern (xf = 1 ft) . . . . . . . . . . . . . . . . . . . .
62
7.20 Velocity inside the fractures (xf = 1 ft) . . . . . . . . . . . . . . . . . . . .
63
7.21 Detailed streamlines plot inside the wellbore (xf = 1 ft) . . . . . . . . . . .
63
7.22 Turbulence kinetic energy (xf = 1 ft) . . . . . . . . . . . . . . . . . . . . .
64
7.23 Turbulenc eddy frequency (xf = 1 ft) . . . . . . . . . . . . . . . . . . . . .
64
7.24 Comparison between Darcy’s and Forchheimer models . . . . . . . . . . . .
66
7.25 Well productivity for the simulated completion schemes . . . . . . . . . . .
66
7.26 Gas production and concentration build-up versus sand production . . . .
67
7.27 Sand particle tracking for m ˙ sand = 1 lbm /s after 10 minutes . . . . . . . . .
69
7.28 Sand particle diameter distribution inside the frac pack (m ˙ sand = 1 lbm /s) .
69
7.29 Sand particle tracking for m ˙ sand = 10 lbm /s after 10 minutes . . . . . . . .
70
7.30 Sand particle diameter distribution inside the frac pack (m ˙ sand = 10 lbm /s)
70
7.31 Permeability and β factor versus sand concentration (top layer) . . . . . .
71
7.32 Permeability and β factor versus sand concentration (bottom layer) . . . .
71
7.33 Permeability and β factor versus sand concentration (F&P) . . . . . . . . .
72
7.34 Predicted erosion damage in the tubing string (m ˙ sand = 10 lbm /s) . . . . .
72
viii
7.35 Detail of sand particles behavior inside the wellbore . . . . . . . . . . . . .
73
7.36 Detail of sand particles behavior inside the wellbore . . . . . . . . . . . . .
74
ix
Abstract Well completion plays a key role in the economically viable production of hydrocarbons from a reservoir. Therefore, it is of high importance for the production engineer to have as many tools available that aid in the successful design of a proper completion scheme, de-pending on the type of formation rock, reservoir fluid properties and forecasting of production rates. Because well completion jobs are expensive, most of the completed wells are usually expected to produce as much hydrocarbon and as fast as possible, in order to short-en the time of return of the investment. This research study focused on the evaluation of well performance at two common completion schemes: gravel pack and frac pack. Also, the effects of sand production on well productivity and its associated erosive effects on the wellbore, downhole and tubular equipment were also a motivation in considering the inclusion of a decoupled geomechanics models into the study. The geomechanics-hydrodynamics modeling was done using a computational fluid dynamics (CFD) approach to simulate a near-wellbore model, on which diverse physical processes interact simultaneously, such as nonlinear porous media flow (Forchheimer formulation), turbulence kinetic energy dissipation, heterogeneous reservoir rock properties and particles transportation. In addition, this study considered a gas reservoir whose thermodynamic properties were modeled using the Soave-Redlich-Kwong equation of state. In general, this study is divided into: 1. Verification of a CFD simulation results against its corresponding analytical solution 2. Analysis of well completion performance of each of the proposed completion schemes 3. Effect of using Darcy’s law on the prediction of well completion performance 4. Sand production and erosive damage analysis The CFD approach used on this research delivered promising results, including pressure and velocity distribution in the near-wellbore model as well as three-dimensional flow patterns and effects of sanding on the wellbore integrity. x
1
Introduction
Well completion is the final stage of the well construction process and the initial step towards putting the reservoir on production. Completing a well usually requires a previous appraisal of the quality of the reservoir, including type and saturation of hydrocarbon fluids and interstitial water, reservoir rock properties (e.g. porosity φ and permeability k), to confirm the existence of commercial-exploitable volume of hydrocarbon reserves. The viability of the economic success of the life cycle of a production well depends on several factors, such as transport capacity and level of integrity of the near-wellbore region. These factors related to hydrocarbons production should to be globally balanced, in order to achieve: 1. Production of hydrocarbons in place at economic rates. 2. Minimization of the impact on the near-wellbore region integrity due to changes in the stress state of the formation rock. 3. Control of sanding and associated erosion problems that would affect downhole and tubular equipment as well as surface production equipment. Keeping these statements as the three main objective parameters influencing the success of a well completion job, this research project focused on the evaluation of the impact that of producing gas at high flow rates while controlling wellbore integrity and sand production using two different cased-hole completion techniques: gravel-packing or gravel pack and frac-packing or F&P. On one hand, gravel packing, used since the 1930s, is the most widely used completion scheme with sand control purposes, accounting for approximately 75% of the completion jobs in the oil and gas industry. This technique consists of shooting the reservoir rock through the cased well to create perforation tunnels in the productive zone of the nearwellbore region, and later a slurry of proppant (or sized-gravel) is pumped down the well where a screen mesh is installed in the center of the wellbore to pack the gravel into the completion, keeping tunnels open to flow, and serving as a very high permeability granular 1
filter (Figure 1.1). This technique is also a relatively expensive, thus its cost should be incorporated as another weighing factor into the decision-making process of completing a well with the gravel-pack scheme (Carlson et al., 1992) [7]. Furthermore, in the same source, the authors suggest the use of computational methods to obtain well performance curves for different completion schemes to get a broader picture of the overall decision-making process result with respect to the expected ultimate well productivity.
Schematic of a gravel pack completion (adapted from Matanovi´c et al., 2012) Figure 1.1: On the other hand, frac-packing (F&P) consists on creating near-wellbore fractures by inducing rock failure by pumping stimulation fluid carrying proppant (or sized-gravel) through the perforation tunnels at high pressure, leaking off into the formation after weakening formation rock’s strength in the near-wellbore region, so that once the slurry overcomes rock resistance by changing its stresses state, the induced rock failure allows to generate fractures along the rock’s least stress plane. Same as for gravel-packing, the void space within these fractures is readily filled with high-permeability carried into the stimulation fluid. There exists two main reasons to run a F&P completion job. First, the technique known as hydraulic fracturing is most likely applied on moderate to high-permeability reservoirs, knowing that permeability indicates the grade of consolidation of the formation. For the case of a typical gas well1 : • A low-permeability formation might be k < 0.1 mD 1
SPE PetroWiki - Hydraulic Fracturing. Source: http://www.petrowiki.org/hydraulic fracturing
2
• A medium-permeability formation might be 0.1 ≤ k < 10 mD • A high-permeability reservoir might be k > 25 mD Second, a hydraulic fracturing job in high-permeability formations is run to: • Improve reservoir and wellbore communication • Bypass formation damage • Reduce the drawdown around the wellbore (skin effects) • Increase the back stress on the formation • Control sand production • Reduce fines migration • Reduce asphaltene deposition • Reduce water coning Table 1.1 presents typical proppant size with their porous media properties at unstressed conditions. Table 1.2 includes typical porosity, pore throat size and fines retained for a range of US mesh sized-gravel (King, 2009) [34]. Table 1.1: Typical Unstressed Gravel Permeabilities US Mesh Size
Sieve Opening (micron, µm)
Permeability (k, D)
20 30 40 60 70 100
841 595 420 250 210 149
450 140-160 120 65 45 0.6
A quick analysis on how the large difference between reservoir and completion permeability might affect the well productivity and in which manner, yields to three hypothetical events that are related to the producing flow rate: 1. Fluid velocity inside perforation tunnels can be very high (> 200 ft/s) 2. Large inertial and kinetic energy losses due to the pressure drawdown between the completion region and the wellbore (Carlson et al., 1992) 3. Sanding onset can be triggered due to rock failure and high flow velocity, that carries release failed material into the wellbore and up to the surface (Yi et al., 2005) [72] 3
Table 1.2: Typical Proppant Porosity and Pore Throat Size US Mesh Size
Permeability (k, D)
Porosity (φ)
Pore Throat (micron, µm)
Fines Retained (micron, µm)
10/20 10/30 20/40 40/60
325 191 121 45
0.32 0.33 0.35 0.32
225 174 139 86
90 70 46 34
The onset of sand production is triggered by a formation rock failure due to the increase in principal and intermediate rock stresses state created by lowering fluid pressure after starting the depletion of the reservoir. This phenomenon is physically modeled by a geomechanics-hydrodynamics coupled process that is classified into three major groups, according to the type of associated rock failure, as explained by Wang, Wan and Settari (2005) [68]: • Shear failure induced by fluid pressure drawdown can lead to the breaking of sand grain bonds and the alteration of the material’s mechanical properties, i.e. cohesion (So ) and friction angle (φf ). • Tensile failure caused by high production rates can lead to dilation of the solid skeleton and the consequent loss of particles through disaggregation. • High stress due to completion cause the formation to fail whereas fluid transport the loose material into the wellbore In this view, a well completion job is not only intended to enhance communication between the reservoir and the wellbore but also to control sanding conditions by improving rock stability in the near-wellbore region as pressure drawdown increases, and by filtering sand grains being transported into the produced fluid stream.
(a) Dual screen mesh (source: (b) Erosive damage due to fines Hole Products, Inc.) migration (King, 2009)
Figure 1.2: Common types of fracture shape models in F&P completion 4
The wellbore screen mesh, as exemplified by Figure 1.2a), is the main barrier of the sand control system, installed with the specific purpose of preventing fines migration into the wellbore. Figure 1.2b shows the erosive damage caused on a screen mesh by fines migration and Figure 1.3 shows a surface equipment clogged with produced sand from a poorly consolidated matrix brownfield (Casabe Field, Colombia).
Figure 1.3: Produced sand inside a surface equipment Another important issue related to fines migration and bridging effect is pointed out by Carlson et al. (1992). In their technical paper, the authors assert that fluctuations in production rates from a well adversely affects the formation stability in the surroundings of perforations tunnels, sometimes leading to what is known as sand arches, as described by Figure 1.4. In their work on surveillance the permeability evolution of reservoirs producing sand, Chalmers et al. claim the result of their investigation indicates that permeability in sand producing reservoir goes through at least three steps (Chalmers et al., 2014) [8]: 1. Skin reduction due to removal of pore plugging materials from the formation matrix and near-wellbore region. 2. Near wellbore deformation/failure due to continuous removal of material as a result of increase in the pressure drawdown, thus the rock changes from a compression into a dilatant condition. This includes the formation of large cavities and shear/band fractures. 3. Cavities and fractures trigger the onset of compaction and the near-wellbore area starts to collapse.
5
Figure 1.4: Stable sand arch around a perforation tunnel (from Carlson et al., 1992) In summary, the success of the design of a prospective well completion job depends on the optimization of the main parameters that control each of the physical phenomena herein presented. In consequence, this ultimately leads to the consideration of using mathematical tools and modeling techniques to construct a near-wellbore model based upon a coupled system of physical processes, e.g. hydrodynamics and geomechanics, that could predict variations on either expected production rates, degradation of formation rock’s strength properties, and/or onset of sanding conditions with temporary changes in the variables of major interest for a reservoir engineer, such as pressure drawdown and productivity rates. To fulfill the goal of obtaining this much information that would help in the decisionmaking process of whether to complete a prospective production well or not, in the light of the three factors previously mentioned, this research project implemented a Computational Fluid Dynamics (CFD) simulation approach for the case of a fictitious three-dimensional, dual-layered gas reservoir in which a well was already drilled and cased. In addition, it was of particular interest to this research project to use CFD simulations to predict the fluid’s pressure distribution in the near-wellbore region while producing gas at a fixed pressure drawdown, assuming constant external reservoir pressure, along with its related velocity profile, especially inside perforation tunnels. Likewise, the CFD approach intended to account for inertial and turbulence effects when producing gas at high rates and how these effects influence pressure losses in the completion region that, in the long run, have a restrictive effect on the well productivity.
6
2
Statement of the Problem
Developing a near-wellbore model requires the coupling of the individual physical model(s) which describe flow behavior in each region (subdomain) that is part of a holistic model (domain). For instance, fluid flow in porous media, that applies to both reservoir and completion region, can be modeled for low flow rates using Darcy’s law. However, for the case of high flow rates, there is a point at which inertial effects becomes significative, hence the relationship between pressure drop and flow rate becomes nonlinear, and Forchheimer formulation should be used instead of Darcy’s law. Not only that, but also fluid properties changes with pressure and temperature, so it is mandatory and necessary to implement an equation of state ρ = ρ(p, T ). As this constitutive function depends on pressure and temperature, fluid flow equations for the near-wellbore model become strongly tied to the EOS. Equations of state are usually nonlinear, being the pressure-explicit, cubic EOS, the most common, e.g. Soave-Redlich-Kwong (SRK-EOS) and Peng-Robinson (PR-EOS). This indicates that both the EOS and fluid flow equations form a set of coupled-non-linear equations. In addition, the physical model of free-free-streamstream flow inside the wellbore is obtained through Navier-Stokes equations. These equations are highly nonlinear themselves and are strongly coupled to the fluid’s EOS and viscosity correlation. Geomechanics and hydrodynamics processes that leads to sanding onset depend on the fluid’s pressure gradient which, in turn, depends on the velocity gradient. Likewise, proppant transport properties, such as porosity, permeability and inertial coefficient, or β factor, depend on volumetric sand concentration inside the completion region. In view of the large amount of complications that represents the construction of the near-wellbore model by using differential equations given by the aforementioned physical models, this research project proposes a novel approach to model the near-wellbore region, including well completion scheme, sand production and erosive wear, using Computational Fluid Dynamics (CFD) modeling.
7
Figure 2.1: Level of coupling of the near-wellbore physical models This research was limited to the CFD simulation of an isothermal, single-phase compressible flow system, that used a coupled Forchheimer/Navier-Stokes formulation for modeling fluid flow in porous media, whereas a turbulence model was implemented for the wellbore region (Section 4.3.1). This research considered the modeling of a dual-layered gas reservoir, in which gas was defined as pure methane (CH4 ) and the Soave-Redlich-Kwong EOS was used to model its thermodynamic properties. The viscosity was calculated using the rigid interacting sphere model; however, because this model depends on temperature only, simulated viscosity was constant. Nevertheless, the CFD model lacks of a formal mathematical model for the reservoir geomechanics, thus sand production was simulated under the assumption that the onset conditions for sand migration were already triggered by the time of gas production. Also, the CFD simulation capabilities does not feature a particles filtration model, so that sand the concentration build-up in the reservoir and completion was artificially created by evaluating volumetric sand concentration with each region of the model (bottom and top layers and completion region) after a certain elapsed time after the start of sand production. Finally, the Finnie erosive wear model was incorporated into the near-wellbore model aiding to predict the probable spots were erosion problems would occur due to the action of sand grains flowing inside the wellbore.
8
3
Literature Review
The problem of sanding onset as a coupled geomechanics-poroelastic-hydrodynamics flow in porous media model has been investigated from a mathematical point of view by several authors, such as Wang et al. (2005) and Yi et al. (2005) [68, 72]. Yi et al. explored the effect of the selection of a particular rock strength criterion on the sanding onset prediction, then introduced four common rock strength criteria (MohrCoulomb, Hoek-Brown, Drucker-Pager and Modified Lade). The authors emphasized in the importance of obtaining the rock strength parameters cohesion (So ) and internal friction angle (φf ) from regressed data as the result of conventional triaxial test data. These parameters allow to compute the failure function for each rock strength criteria so that any of these models could be incorporated into the near wellbore poroelastic stress model. The following mathematical expressions, as presented by the authors’, are herein shown with the purpose to illustrate how the geomechanical model and the porous media equations for a two-dimensional system are coupled: 1 ∂ r ∂r
�
k ∂P µB ∂r
�
∂ + ∂z
�
k ∂P µB ∂z
� =
φ0 (cf + cr ) ∂P B ∂t
(3.1)
where µ = fluid viscosity, B = formation volume factor, k = permeability, φ0 = porosity measured at reference state, cf = isothermal compressibility of fluid and cr = isothermal compressibility of rock matrix. The corresponding axisymmetrical poroelastic stress model, assuming isotropic in-situ horizontal stress and uniform loading and formation properties:
∂σr ∂τrz σr − σθ ∂P + + + f r + αb =0 ∂r ∂z r ∂r ∂P ∂σz ∂τrz τrz + + + f z + αb =0 ∂z ∂r r ∂z
(3.2a) (3.2b)
being σr = effective radial stress, σθ = effective tangential stress, σz = effective vertical stress, τrz = shear stress in z direction, fr = body force per unit volume in radial direction, fz = body force per unit volume in vertical direction and αb = Biot’s constant. 9
Authors carried out finite element method (FEM) simulations to solved the coupled system on a fictitious 2-D gas reservoir, where production rates and sanding onset were predicted for each of the four different rock strength criterion. There are several more successful research work related to the implementation of this type of coupled modeling, especially to near-wellbore analysis (Wang et al., 2005; Suri et al., 2010 [65]). Nonetheless, the geomechanics modeling is not taken into account in the scope of this research project. Instead, it is considered that sand is already being produced from the reservoir, meaning that the sanding conditions were already triggered, and part of the evaluations conducted through this research project are devoted to evaluate the impact of fines migration on gas production rates and its related erosive effects inside the wellbore. Neither of the reviewed literature on geomechanics-hydrodynamics modeling consider non-Darcy, or inertial, effects. This means that additional pressure loss due to kinetic energy losses at high flow rates is not accounted for, hence simulation results may give an optimistic production or injection rate at high values of fluid pressure drawdown. Equally important is the fact that the work done on all the reviewed papers is based upon a twodimensional model that does not account for fluid flow behavior inside the wellbore nor erosive damage due to failed material migration into the wellbore. Therefore, after the literature review on geomechanics-hydrodynamics coupled reservoir simulators, specifically on their capabilities to model sanding onset and prediction of volumetric sand production rates, a brief summary of the observed opportunities of improvement is given below: 1. Full three-dimensional near-wellbore model that includes the wellbore region 2. Accounting for inertial effects 3. Multiple-layered, heterogeneous formation matrix 4. Implementation of a more realistic completion geometry, including perforation tunnels distribution around the wellbore as well as in the vertical direction 5. Modeling of gas using a real gas equation of state (EOS) 6. Visualization capabilities to generate pressure distribution plots, velocity contour plots and streamlines plots 7. Modeling of produced sand grains as solid particles being transported into the produced fluid stream
10
These improvements would require the evolution of actual 2-D coupled models into a more complex three-dimensional system of equations that could handle heterogeneous porous media while accounting for non-Darcy (inertial) effects of a compressible fluid flowing into the wellbore and carrying sand particles into it. Not only that, but also the introduction of a realistic geometry for a given completion scheme adds to the already increased difficulty of achieving such kind of coupled system of equations. The porous fluid flow process that describes additional kinetic energy losses due to inertial effects was first proposed by Forchheimer (Forchheimer, 1901) [21]. As explained later in this document, Forchheimer formulation requires the implementation of a correlation to calculate the inertial constant or β factor. This conclusion opens the opportunity to consider the application of computational fluid dynamics (CFD) to the problem of near-wellbore physics that include free-stream flow and erosive damage modeling inside the wellbore. Several authors have explored this research area. For instance, Furui (2004) [22] investigate the possibility of finding analytical solutions to an equation that describe well completion schemes using the concept of skin factor. In addition, the author simulated several completion schemes using finite element method (FEM) to obtain semi-analytical formulations, as well. Several other authors have used CFD simulations of the near-wellbore region before the development of this research project. In their work, Valsecchi et al. (2012) [67] used a combination of magnetic resonance imaging (MRI) and CFD simulations to predict flow patterns occurring near and inside the wellbore. This analysis consists of building a laboratory-scale gravel pack model that resembles a water well. By using MRI technique it was possible for them to visualize actual fluid flow behavior inside the laboratory scale model. Later, authors used a CFD post-processing software (Paraview) to generate streamlines and 3-D surfaces from the data obtained in the MRI tomography experiment. In their experiment, water flows into the wellbore at a rate of 12 gpm. Because the MRI scanner had a resolution of the order of millimeters, the particulate material researchers used to simulate the gravel pack was not smaller than 6-7 mm in diameter. In the final part of their work, authors used computed tomography (CT) scans to construct the computational 3-D geometry of the laboratory model, including wormholes. Then, they run steady-state CFD simulations of the model with gas. However, authors conceded that in despite the success of their investigation, the model is still too small compared to a real field-scale application. Another relevant research was done by Melo et al. (2013) [41]. The authors implemented an empirical wormhole propagation model on a commercial CFD software through 11
the use of user-defined functions, aiming to evaluate different pumping strategies for matrix acidizing treatments. The researchers anticipated turbulent flow and its associated effects, like turbulence kinetic energy losses, over the region of interest. In view of this, authors used implemented a turbulence model to account for turbulence effect. In their simulation, acid was pumped at a rate of 10 bbl/min until the cumulative volume reached 500 bbl, and the inert/acid mixture had a density of 1,000 kg/m3 and a viscosity of 1 cP. After studying the stimulation process with two different acids (HCl 0.5 M and EDTA 0.25 M), they came to the conclusion that the wormholes propagation front is strongly dependent on the type of acid used. Authors also considered an uniform formation damage along the extension of the reservoir, characterized by a very low permeability (0.1 mD), with 15% porosity and 1 in of radial penetration. Finally, researchers presented the predicted velocity distribution and several other plots related to wormholes propagation. Nevertheless, one drawback of this work is that the near-wellbore case study evaluated by the authors is two dimensional. Regarding inertial energy losses, two types of non-Darcy effects can be implemented through CFD modeling. To begin, Forchheimer formulation (Forchheimer, 1901) [21] adds the effect of inertial kinetic energy losses to the original Darcy’s law. As explained later in this document, this formulation requires the implementation of an inertial coefficient or β factor. Therefore, literature about non-Darcy or inertial flow was also reviewed, for two main reasons: • To select the most appropriate β factor correlation for the present research work. Several correlations for the β factor as function of porosity and permeability, proposed by Khaniaminjan (2008) [33], were studied to choose the one that best fitted the needs of this research work. • To understand the mechanisms that trigger the onset of inertial effects in high-rate low systems. Zeng and Reid (2006) and Huang and Ayoub (2008) [74, 30] discuss the definition of Type-I and Type-II criteria in an effort to predict the onset of inertial flow effects. Zeng and Reid define the Reynolds Number (Re) and Forchheimer Number (F0 ) at the pore scale, and use them to calculate the conditions at which inertial effects become relevant. On the other hand, a very important remark from the work of Melo et al. is the mention of an additional non-Darcy pressure loss due to turbulence rather than inertial effects. This type of non-Darcy effect is modeled using the concept of turbulence kinetic energy (TKE), that the authors used on their CFD research. ANSYS CFX–Solver Theory Guide [3] gives a mathematical explanation of the couple between turbulence model and a porous media model, either Darcy’s law or Forchheimer, to account for the turbulence energy losses. 12
Instead of using CFD modeling, Lolon et al. (2004) [36] built a numerical 2-D model of an actual gas well from the Gulf of Mexico. This well was frac packed. The authors assumed a 20/40 mesh InterProp proppant inside the fracture opening. Also, they modeled the pressure drop across the gravel pack and perforation tunnels for single-phase and multiphase flow case studies, which enabled them to combine the inflow model with a reservoir simulator in order to predict the total pressure drop inside the frac pack completion. The porous fluid flow model authors chose for this research was Forchheimer formulation and the inertial coefficient, or β factor, for single-phase flow was calculated using a correlation proposed by Geertsma (1974) [24] that includes the effect of irreducible water saturation. One remarkable achievement of this research work was enabling the coupling of the completion model with a reservoir simulator. They also quantified the amount of pressure losses due to Darcy and non-Darcy effects at different flow rates. Part of the conclusion of this work claim that neglecting inertial effects can deliver unrealistic production rates that may affect the overall forecast of the reservoir simulation. By analyzing simulation results of this work, it was concluded that including inertial pressure losses in the CFD model proposed in this research was primordial. Alongside the literature review of inertial effects and turbulence energy losses, research material in reference to erosion modeling using CFD was also reviewed. For instance, the work of Peri and Rogers (2007) and Paggiaro et al. (2013) and [51, 49] present a similar methodology, consisting of experimental testing of sand flowing through a valve at different percentage open. Then, the CFD model of the experimental test was run and the results were compared against actual experimental data. In both cases, predicted and experimental data showed good agreement with each other. Furthermore, Peri and Rogers use turbulence kinetic energy (TKE) to determine the intensity of turbulence in certain regions of interest. Given that flow velocity can be high inside and at the outlet of perforation tunnels, turbulence effects may have an important effect on flow behavior in the near-wellbore region and inside the wellbore, so that turbulence kinetic energy losses were also included in this research. Concerning sand production from the reservoir and its effects on permeability and β factor, the investigation conducted by Anbar (2014) [2] was thoroughly reviewed to understand how pore-scale modeling were used to develop mathematical correlations that relate porosity, permeability, and β factor with volumetric sand concentration within both the reservoir and completion region. From the author’s work, correlations for permeability and β factor were implemented via CFX Expression Language (CEL) functions.
13
4
4.1
Theoretical Background
Fracture Modeling
The Perkins-Kern-Nordgen (PKN) model was firstly proposed by Perkins and Kern (1961) [52] and later improved by the contributions of Nordgren (1972) [48]. Basically, the PKN model describes the fracture as an ellipsoid and uses a mathematical formulation to predict changes in fracture width and length with respect to changes in pressure and time (Figure 4.1a). The Geerstma-DeKlerk (KGD) model (1969) [25] also accounts for alteration in fracture width and length due to changes in in-situ stresses with time. The main difference of this model with respect to the PKN model is that the cross-sectional area of the KGD model is rectangular in shape rather than ovoidal (Figure 4.1b).
(a) PKN model
(b) KGD model
Figure 4.1: PKN and KGD rock fracture models (adapted from Economides, 2000) The PKN fracture model was selected as the fracture model for the frac pack completion scheme developed in this research work. However, as fracture dimensions should be different from time to time, depending on fluid pressure drawdown, for simplicity purposes of this project it was assumed that fracture geometry in the CFD model was independent of pressure, thus fracture width and length were fixed for all frac pack simulation scenarios. 14
4.2 4.2.1
Fluid Flow in Porous Media Darcy’s Law
Darcy’s law is the equation that describes fluid flow through porous media. This result was found by Henry Darcy (1856) [12] through experimentation with water flow through sandpacked pipes. He realized that the pressure drop across the porous media was proportional to the volumetric flow rate and inversely proportional to the fluid viscosity. Then, he defined the proportionality constant k (permeability) and then his experimental results correlated well with the equation: � q=
kA µ
�
Pi − Po L
(4.1)
where q, A, µ, and k are the volumetric flow rate, cross-sectional area, dynamic viscosity, and permeability, respectively. Likewise, Pi is the inlet pressure and Po is the outlet pressure being Pi > Po . The differential form of Darcy’s law (Eq. 4.1) is given by: k v = − ∇P µ
(4.2)
Because in Eq. 4.1 A refers to the cross-sectional area open or available to flow, A = φAtotal , with Atotal being the total cross-sectional surface. Therefore, v is actually the average macroscopic velocity or superficial velocity vector. Although the derivation of Darcy’s law was merely experimental, or phenomenological, Whitaker (1986) [70] demonstrated with the aid of the volume-averaging technique that Darcy’s law can in deed be obtained from Navier-Stokes equations (Eq. ??), assuming incompressible flow. The procedure yields: v=−
kxi xj (∇P − ρgxi ) (i, j) = {1, 2, 3} µ
(4.3)
where kxi xj = k is the permeability tensor and gxi = g(∂Z/∂xi ). For a cartesian coordinate system, (x1 , x2 , x3 ) ≡ (x, y, z), therefore the permeability tensor k is defined for i = 1, 2, 3 and j = 1, 2, 3 as: kxx kxy kxz k = kxi xj = kyx kyy kyz (4.4) kzx kzy kzz And if only the main diagonal elements are non zero and multiplying Eq. (4.3) by the
15
cross-sectional area A, the equation becomes the three-dimensional version of Darcy’s law: k q = − ∇(P − ρg) · A µ
(4.5)
dV dV dV , , ) with dV as the where A is the perpendicular area vector, defined as A = ( dx 1 dx2 dx3 volume of a differential element in any coordinate system. The term P −ρg is often referred to as flow potential (Φ). This term accounts for the gravitational effects on fluid flow in vertical, inclined or tilted domains. Using the definition of flow potential, Eq. 4.5 can be rewritten as: k (4.6) q = − ∇Φ · A µ
The flow potential version of the Darcy’s law (Eq. 4.6) has been extensively used in geological sciences like hydrology as well as in petroleum engineering. Nonetheless, Darcy’s law has a drawback and it is that this equation is only valid for low superficial velocity or creeping flows, due to the fact that at high velocities inertial effects become important and Darcy’s law is not able to capture those effects. As a final comment, notice that Darcy’s law is a momentum balance equation as it relates fluid pressure to flow velocity.
4.2.2
Forchheimer Formulation
As mentioned before, Darcy’s law fails to predict fluid flow behavior in porous media at high flow rates, at which inertial effects become influential, thus the relationship between q and ∇p is no longer linear. In his work with fluid flow in porous media at high velocity, Phillip Forchheimer (1901) [21] noticed that this relationship could be fitted with the addition of a squared-superficial velocity term to the original Darcy’s law equation, such that: dp µ = − vx − βρvx2 dx kx
(4.7)
If the porous media is isotropic, so that k = k for all i = 1, 2, 3 and j = 1, 2, 3, and neglecting gravitational effects, then Forchheimer equation can be expressed in a vectorial form as: µ ∇p = − v − βρ||v||v (4.8) k where the term β is known as the inertial flow coefficient, or β factor, while ρ||v||v is related to the fluid kinetic energy. This kinetic energy term is of great importance as it indicates that a portion of the fluid energy is used to overcome such inertial resistance at
16
high flow rates, meaning that flowing at high velocities implies an additional energy loss, as discussed by Huang and Ayoub (2008) [30]. The inertial coefficient, or β factor, depends on the properties of the porous media and although there are various analytical methods to derive it, β factor used for flow calculations in the oil and gas industry is usually obtained through laboratory experiments and then correlated to the media porosity and/or permeability. From the experimental work of several researchers on rock core samples [24, 33], a variety of empirical correlations as a function or rock permeability and porosity have been proposed. However, there are two weaknesses often associated with this methodology: • The correlation assumes that the β factor is not affected by the flow regime but it only depends of permeability and porosity, then β = β(k, φ). • Most of the experiments are done with Newtonian fluids. Three empirical correlations, proposed by Khaniaminjan (2008) were analyzed during the development of this research work: 9 × 10⁹ k −6/7 φ−8/7 4.8 × 10¹¹ β(φ, k) = 1.8 −0.48 k φ 17.2 × 10¹⁰ β(k) = k 1.76 β(φ, k) =
(4.9a) (4.9b) (4.9c)
Notice that β factor in Eq. 4.9c depends only on the absolute permeability of the porous medium. A comparison of these three correlations is shown in Section 6.3.1.1. On the analytical side, Ergun and Orning (1949) [16, 40] derived an expression for β factor, based on their experiments with fluid flow through packed columns and fluidized beds. The expression these authors proposed is: CE β=√ k
(4.10)
where CE is called the Ergun constant and, in contrast to the empirical β factor correlations used in this research, EC depends on the actual flow regime, being very small for laminar flows. Another analytical model for the β factor can be obtained for a situation when fluid is flowing through a perforated plate, but that kind of model is not discussed here. In an effort to predict the onset of inertial flow, several authors (Geertsma, 1974; Zeng and Reid, 2006; Huang and Ayoub, 2008) have proposed the implementation of two dimensionless numbers in the analysis of flow in porous media, Reynolds number (Re) and Forchheimer number (F0 ), historically recognized as Type-I and Type-II criterion, 17
respectively, defined as: ρ||v||Lc µ ρ||v||βk F0 = µ
Re =
(4.11a) (4.11b)
The term Lc in Eq. 4.11a represents a characteristic length scale, usually a sort of average particle diameter (dp ) or pore throat diameter (dt ). In addition, it can be noticed that Eq. 4.11b is equivalent to Eq. 4.11a when Lc = βk. Zeng and Reid (2006) [74] assert that critical values for inertial or non-Darcy flow are in the range of 1 ≤ Re ≤ 100 for the Type-I criterion, and 0.005 ≤ F0 ≤ 0.2 for Type-II criterion. Another relevant question in the application of either Type-I or II criterion to predict the onset of non-Darcy flow what velocity ||v|| to use, and whether a local maximum velocity or volume-average velocity criterion would be more appropriate to determine the onset of non-Darcy flow using Eqs. 4.11a or 4.11b. This is important in the analysis of fluid flow in heterogeneous porous media where the non-linear flow is originated in a very specific and small region that may have not a large impact on the overall flow regime of the region of interest.
4.3
Computational Fluid Dynamics
Computational flluid dynamics (CFD) is the science of solving fluid dynamics equations by the implementation of numerical techniques. The principal set of equations solved in a CFD simulation are the mass and momentum conservation laws coupled to a variety of auxiliary, or closure, functions that correlate to fluid transport properties and its thermodynamic state at flow conditions. Several additional physical processes can also be linked to the main system of equations, e.g. combustion, mass transfer and phase change, particle transport, non-Newtonian fluids, among others. ANSYS CFX–Solver Theory Guide (2014) presents the fluid dynamics equation of an isothermal process for a Newtonian fluid: ∂ρ + ∇ · (ρv) = 0 ∂t ∂ (ρv) + ∇ · (ρv ⊗ v) = −∇P − ∇ · τ + SM ∂t
(4.12a) (4.12b)
where τ is the shear stress tensor, given by: � � 2 T τ = µ ∇v + (∇v) − δ∇ · v 3 18
(4.13)
Eqs. 4.12a and 4.12b are the mass and momentum conservation laws, respectively. The term SM that appears in Eq. 4.12b is a momentum source/sink term and is used to couple the momentum balance equation to a momentum loss equation, e.g. Darcy’s law or Forchheimer equation. Several approaches exist to solve the above system of equations with adequate initial and boundary conditions imposed over a domain region. The method of simulating fluid flow using Eqs. 4.12a to 4.13, without any further assumption or simplification, is known as direct numerical solution (DNS). Because governing equations of fluid dynamics are highly non-linear and tightly coupled, this procedure is very computationally expensive and requires large computational resources. Therefore, DNS is only intended for specific applications where the simulated domain is small and the analysis of turbulence production is needed over its entire span; that is, from very small to very large eddies. In addition, DNS requires extremely fine grids, making the solution even more complex and time consuming in achieving convergence. For these reasons, DNS simulations are not always the best approach for a CFD model. To overcome this obstacle, simplified versions of the NavierStokes equations, known as turbulence models, have been developed since the late 1960s.
4.3.1
Turbulence Modeling
According to the ANSYS CFX Solver Theory Guide (2014) [3], turbulence consists of fluctuations in the flow field in time and space. Turbulence occurs when the inertial forces overcome viscous forces, thus leading to the generation of chaotic, random fluid flow patterns. It is also characterized by a high Reynolds Number (Eq. 4.11a). In order to simulate fluid flow without the requirement of a very detailed description of the flow field, i.e. allowing some approximations in the prediction of the velocity field, turbulence models are the right choice. Turbulence models have been developed to account for the effects of turbulence without the need of undergoing through a DNS–type simulation. The majority of these turbulence models are statistical and these are usually classified as Reynolds-Average Navier-Stokes (RANS) models. Other models, such as Large Eddy Simulation (LES) and Dettached Eddy Simulation (DES) are not statistical turbulence models. Figure 4.2 illustrates an analogue comparison between these two kinds of turbulence models. RANS turbulence models are based on the assumption that the velocity component Vi can be separated into two velocity terms: an average component V¯i and a time-varying component vi (t), yielding: Vi ≡ V¯i + vi (t) (4.14) 19
The average velocity component is given by the following equation: 1 V¯i = ∆t
ˆ
t+∆t
Vi dt
(4.15)
t
where ∆t is the physical timescale of the model, that is large relative to the turbulent fluctuations and small in relation to the timescale to which the fluid dynamics model are solved. For steady-state simulations, the time-dependent velocity term vi (t) in Eq. 4.14 becomes constant; however, the average velocity term V¯i still needs a physical timescale ∆t in order to average velocity fluctuations caused by the inertial, or turbulence, effects on the fluid flow.
Figure 4.2: Velocity averaging methods (adapted from Ranade, 2001) Two-equation RANS turbulence models are widely used in CFD simulations, as they deliver good accuracy with moderate computational effort. The two most known models are the k − � model and the Wilcox k − ω model (1993) [71]. These two models use the gradient diffusion hypothesis to relate the Reynolds stresses to the mean velocity gradients and the turbulent viscosity. In accordance with ANSYS CFX Solver Theory Guide (2014), the turbulence viscosity is defined as the product of a turbulent velocity and turbulent length scale, but its equation or model is not presented here. For the two aforementioned RANS turbulence models, k represents the turbulence kinetic energy (TKE), defined as the variance of fluctuations in the velocity field, � is the turbulence eddy dissipation rate, or the rate at which fluctuations vanish, and ω is the turbulence eddy frequency. On one hand, the k − ω model yields very accurate results for flow near bounding regions; however, this model usually gives inaccurate prediction of flow behavior in free20
stream regions. On the other hand, k − � model excels k − ω in prediction flow behavior in free-stream regions but is weak in predicting flow behavior near bounding regions. To overcome this issue by combining the near–wall treatment capability of the k − ω model with the open flow turbulence modeling of the k − � model, Menter (1994) [42] developed the Shear Stress Transport (SST) turbulence model, which consists in a transformation of the k − � model into a k − ω formulation and the subsequent addition of the two equations is then modified by two blending functions. This turbulence model performs excellent for simulation of fluid flow in complex geometries and under sharp velocity gradients.
4.3.2
Coupling of Porous Media-Turbulence Models
This approach is based on the combination of Navier-Stokes equations, or a turbulence model, with a porous media flow formulation, either Darcy’s law or Forchheimer equation. Basically, the coupling is possible by applying the concept of superficial velocity in porous media to the free-stream region and assuming that the pressure loss in the porous regions can be modeled as a momentum source term in the Navier-Stokes equation, such that: �µ � ∂ (ρvD ) + ∇ · (ρvD ⊗ vD ) = −∇P − ∇ · τ − vD + βρ||vD ||vD ∂t k
(4.16)
where vD is the superficial fluid velocity inside the porous media, defined as: vD = φv
(4.17)
with φ being the porosity of the medium (see Section 4.2.1). Furthermore, Eq. 4.16 reduces to the original porous media equation (Forchheimer or Darcy’s law) in those regions where the velocity gradient is insignificant. A good example is the hydrocarbon reservoir. Nonetheless, as velocity gradient increases, turbulence effects terms become important. This flow process can be mathematically expressed as: ∇P = −
�µ k
�
vD + βρ||vD ||vD + ∇PNS
(4.18)
where the term ∇PNS refers to the additional terms from Eq. 4.16 that account for pressure losses related to turbulence in situations where the velocity gradient cannot be neglected. Also, the mass conservation law is adapted to this average framework, in terms of the superficial velocity and pore volume, as: ∂ (φρ) + ∇ · (ρvD ) = 0 ∂t 21
(4.19)
In conclusion, the porous media-turbulence model numerically solve Eqs. 4.16 and 4.19, coupled to the constitutive relations ρ = ρ(P, T ) and µ = µ(P, T ), in a simultaneous manner. This solution process was done for this research project over the 3-D volume mesh representation of the analyzed near-wellbore model.
4.3.3
Meshing
The volume mesh is the discrete representation of the void space where fluid dynamics modeling takes place. In CFD terminology, a discrete volume of a 3-D mesh is called a volume cell or element. These three-dimensional elements can be classified into four general groups, according to their shape. Figure 4.3 summarizes the most common four cell shapes. Another kind of element not shown in the mentioned figure is the arbitrary polyhedron. As its name tells, this is an arbitrary 3-D element generated to fulfill any requirement of the volume mesh, e.g. complex regions and highly irregular boundaries.
Figure 4.3: Common CFD volume mesh elements Regarding the volume mesh itself, it can be classified under the three types of mesh structures: • Structured: the volume mesh uses a (i, j, k) indexing system to refer to any cell within it. The final grid has a seemingly logic or structural construction pattern. This type of meshing can only be used for regular geometries. • Unstructured: its main property is the absence of a cell indexing, i.e. no (i, j, k), therefore a higher computational cost is required for this unstructured referencing. Also, the final volume mesh does not have a logical pattern. • Hybrid: a combination of the former two methods. Mostly used in fluid domains whose geometry can be represented as the combination of regular and irregular sub– domains. • Tetrahedral: a 3-D mesh that is generated by using tetrahedron–like cells only. This method is mostly applied to highly irregular geometries or domains.
22
The volume mesh has a significant impact on the rate of convergence of a given simulation, as well as in the numerical accuracy of the final solution. This is due to the fact that fluid dynamics equations are solved in each individual cell, thus depending on the mesh quality and the physics of the simulated model, the solution may achieve convergence or not. This means that the mesh quality, or grid cells density, has a direct impact on the computational cost of a simulation. Therefore, it is recommended to use finer grid only is strictly necessary based upon the domain physics. For instance, a fluid flow problem where fluid properties are strong functions of pressure and temperature requires a high quality mesh, as these two quantities are calculated on each grid cell, and convergence can be only achieved is a smooth pressure and temperature gradients are calculated each iteration, so that fluid properties do not have to undergo intense numerical fluctuations that ultimately affect overall convergence rate.
4.3.4
Equation of State and Fluid Viscosity Model
As mentioned throughout the document, fluid dynamics equations require the assignation of an EOS and a viscosity function as the closure functions in order to run a flow simulation. The majority of commercial CFD simulation packages include a variety of libraries with equations of state for different fluids, usually including water, nitrogen, as well as dry and wet hydrocarbons, like methane and n-pentane. This list of fluids may also include certain polar and non-polar species. As presented earlier, the CFD model proposed in this research work used the SRK-EOS (Soave, 1972) [61] to model the thermodynamic behavior of methane. The viscosity function is defined using either theoretical approaches, e.g. kinetic theory of gases, Sutherland’s model (1893) [66], or by empirical correlations, e.g. for dry hydrocarbon gases (Lee, 1966) [35]. The theoretical approaches featured on ANSYS CFX, the rigid non interacting and interacting sphere models, both based on kinetic theory of gases (Hirschfelder, Taylor and Bird, 1954) [29], assume that viscosity depends on temperature only, thus it will not change in isothermal flow processes. These two viscosity models are defined by the same equation: √
µ(T ) = 26.69
MT Ω(T )σ 2
(4.20)
where µ(T ) is the dynamic viscosity (µPa), M and T are the molecular weight (g/mol) and fluid temperature (K), respectively. The collision diameter σ is determined by:
23
σ = 0.809(vc )1/3
(4.21)
where vc is the fluid critical volume (cm3 /mol). The rigid non interacting sphere model assumes that Ω(T ) = 1 whereas the interacting sphere model defines Ω(T ) as a function of the critical temperature Tc , the minimum energy corresponding to the equilibrium separation of molecules ε, and the Boltzmann constant kB (Chryssakis and Assanis, 2005; Chung, Lee, and Starling, 1984) [9, 11]. Because temperature was assumed constant inside the reservoir, the CFD model was based on a constant viscosity value for methane. Although this may sound as a drawback for the presented modeling approach, it should be mentioned that viscosity of methane does not change largely with pressure, thus the error introduced by the assumption of constant viscosity is inconsequential.
4.3.5
Material Balance: Convergence and Accuracy
When dealing with the interpretation of numerical results of any fluid flow simulation, it is very important to revisit Reynolds transport theorem and the non-conservative form of the mass conservation law. The mass conservation law states that (total mass flux through volume surfaces, ∂Ω) = (total change of mass inside the control volume, Ω). Reynolds transport theorem allows to express this statement in the form of the following integraldifferential equation: { y � ∂ρ � dΩ = 0 (4.22) ρv · dA + ∂t ∂Ω
Ω
This equation clearly displays the two driving mechanism of mass transport in singlephase system along with the physical quantities that control each of them. On one hand, the surface integral, or convective term, indicates the amount of matter entering and leaving the control volume through its boundaries ∂Ω (inlets, outlets). This term is dominated by the velocity field v. On the other hand, the volume integral, or accumulation term, is dominated by the rate of change of mass per unit volume with time. Given that fluid density is determined by the EOS, therefore the accumulation term and the EOS function are coupled. At the same time, fluid velocity field v is governed by the momentum conservation law (Eq. 4.12b), also coupled with the EOS. This leads to the conclusion that fluid dynamics equations are tighly coupled. In that sense, Eq. 4.22 is an indicator of the overall numerical accuracy of the simulation. Because a CFD simulation solves fluid dynamics equations numerically, the right-hand side of Eq. 4.22 is set to a very small number (usually between 1 × 10⁻⁴ and 1 × 10⁻⁸ ) rather than zero, called convergence criterion 24
or convergence tolerance, denoted by εm . For most engineering purposes, a tolerance of 1 × 10⁻⁶ will suffice [3]. Once the system reaches steady-state conditions, the only term that influences Eq. 4.22 is the convective term. Therefore, at steady-state conditions: X X ( m ˙ ) − ( m ˙ ) inlet i outlet i ≤ εm i
(4.23)
i
This equation is helpful in the determination of the accuracy of simulation results, as the convergence of Eq. 4.23 implies that the momentum conservation must have achieved the convergence criterion as well; only under this condition, any CFD simulation can be said to have achieved convergence. However, this statement is not reciprocal because NavierStokes equations could converge to certain tolerance value even at unsteady flow conditions as they depend on the EOS rather than the amount of mass passing across the domain boundaries. To capture the inertial or turbulence effects on fluid flow due to high-rate flow, CFD simulators solve fluid dynamics equations using the concept of pseudo-elapsed time or physical timescale. Basically, the differential term dt is discretized as ∆ts in every temporal derivative and then equations are numerically integrated with respect to time and space until steady state is reached and simulation has converged. A more detailed discussion about the physical timescale and its role in numerical convergence is given in the next section.
4.3.6
Physical Timescale
Mathematical modeling of simultaneous physical processes often involves different timescales at which each of the coupled models becomes more dominant. This timescale is called physical timescale and it is defined depending on the model(s) being simulated. The ANSYS CFX Solver Theory Guide (2014) proposes an approximate calculation method for the physical timescale, based on the concept of residence time, in the following manner: ∆ts =
Ls v¯
(4.24)
where Ls is the characteristic length of the domain and v¯ is the average flow velocity. This approach assumes that the only physical phenomena being modeled is fully described by the mass and momentum conservation equations without any mass or momentum source/sink term. Eq. 4.24 applies mostly to single-phase, non-reacting, free fluid flow modeling. However, many physicochemical processes implies modeling different situations taking 25
place at different time scales; thus, instead of a unique physical timescale, there exists a time span where either model becomes the dominant. Therefore, selecting the appropriate timescale for a given CFD simulation is vital to get the numerical solver to achieve convergence.
4.3.7
Methodology
The implementation of a CFD simulation is systematic and relatively straightforward. It is based on a methodology that features the creation of the simulation domain, the definition of the mathematical model to be simulated and the corresponding domain properties, running the simulation, and analyzing the results. This methodology can be summarized as follows: • Define the geometry representation of the CFD model and generate the 3-D model. • Create the volume mesh, making all the required adjustments (refinement, meshing method, element aspect ratio, etc.) • Pre-process the CFD simulation by setting the scope of the study, defining the boundary conditions, choosing the equation of state (EOS) from the material library, selecting the turbulence model that better represents the actual physics of the model, and setup initial conditions and advanced solver options (multi-grid solver, parallel, physical timescale, etc.) • Run the simulation using the CFD numerical solver package until convergence criteria is achieved for all fluid flow equations. • Check for convergence and perform a material balance using Eq. 4.3.5. • Post-process simulation results and extract the most relevant data out of it, such as temperature, pressure, flow patterns, etc.
4.4 4.4.1
Steady-State Well Model and Well Completion Performance Steady-State Well Model
The steady-state well model is derived from the application of Eq. 4.5 in a cylindrical coordinate system assuming isotropic porous media (k ≡ k), fluid flows at constant flow rate q in the radial direction only (positive by convention), neglecting gravitational effects (g ≡ 0), and process is at isothermal conditions. Consequently, dV = 2πrhdr and A = dV = 2πrh, hence: dr 2πrkh dP q= (4.25) µ(P, T ) dr 26
The formation volume factor B accounts for density changes with pressure and is defined as the ratio of fluid density at standard conditions (Psc = 14.696 psia and Tsc = 60°F ) to density at actual conditions (P and T ). This definition can be expressed in terms of volume as mass must be the same at both standard and actual conditions, as: B=
V (P, T ) V (Psc , Tsc )
(4.26)
Diving the right-hand side of Eq. 4.25 by B gives the volumetric flow rate at standard conditions: 2πkhr dP qsc = (4.27) µ(P, T )B(P, T ) dr The solution to Eq. 4.27 depends on the type of fluid being produced from the reservoir as well as the analytical definition of both formation volume factor (using an EOS) and viscosity (using a correlation or theoretical model). These two conditions are the key factors on finding an adequate solution to the well model for a given reservoir.
4.4.2
Compressible Flow Well Model
In gases, both the isothermal gas compressibility factor (cg ) and gas formation volume factor (Bg ) are strong functions of pressure and temperature. The isothermal gas compressibility factor (cg ) is defined by � � 1 ∂z 1 (4.28) cg (P, T ) = − P z ∂P T Similarly, the gas formation volume factor is given by: � Bg (P, T ) =
Psc Tsc
��
zT P
� (4.29)
Not only gas isothermal compressibility and formation volume factor are strong functions of both pressure and temperature but also gas viscosity µg = µg (P, T ). Replacing Bg (P, T ) and µg (P, T ) into Eq. 4.27 and performing the integration between P (re ) = Pe and P (rw ) = Pwf , yields the steady-state well model for compressible flow: qsc ln 2πkh
�
re rw
�
Tsc = Psc T
ˆ
Pe
Pwf
P dP µg (P, T )z(P, T )
(4.30)
Unlike liquids for which formation volume factor could be averaged and viscosity assumed constant, Eq. 4.30 cannot be integrated explicitly unless pressure-explicit functions for µg (P, T ) and z(P, T ) are readily available. However, several approximation approaches 27
to solve Eq. 4.30 analytically have been developed. On one hand, the low-pressure approximation establishes that the product µz is nearly constant for P ≤ 1, 500 psia; on the other hand, the high-pressure approximation assumes that p/µz is near constant for P ≥ 4, 000 psia. Applying either approach would allow to explicitly integrate Eq. 4.30 to obtain a suitable approximate solution for a specific model.
4.4.3
Well Completion Performance and NODAL Analysis
Unfortunately, Eqs. 4.27 and 4.30 are constructed upon the conjecture of purely radial, one-dimensional flow. Another drawback is that the studied well model is based on Darcy’s law, so that it needs to be adjusted to account for non-Darcy effects. Not only that but also the introduction of a completion scheme into the near-wellbore region bring these equations inaccurate and unsuitable, in the sense that the flow is no longer one-dimensional but threedimensional due to the completion geometry itself unless the completion scheme is modeled as a cylindrical region contained within the near-wellbore model. Therefore, measuring well completion performance by analytical methods was a difficult approach to follow. In this study, CFD simulations were pressure-driven, i.e. the pressure drawdown ∆P = Pe − Po was fixed, as explained in Section 6.3.1.1. Hence, well completion performance was computed using the definition of productivity index J (Economides et al., 2000): J=
qsc ∆P
(4.31)
for which gas flow rate at standard conditions qsc was obtained from the simulation results. Letting J1 and J2 be the productivity index at the initial and final completion scheme, respectively, the well completion performance was calculated as the fractional increase in gas production rate for a fixed ∆P , using the following equation: ηc =
J2 −1 J1
(4.32)
The well completion performance was computed on an individual basis or per simulation scenario and the arithmetic average of all the resulting values for ηc was considered as the average well completion performance. Basically, this concept was implemented on this research to gauge the level of enhancement in gas production rate achieved after elongating perforation tunnels in a gravel-pack completion scheme and then switching from the enhanced completion to a frac-packing job. In addition, the complete set of simulation results was presented implementing an inflow-performance-relationship-like plot as exemplified by Figure 4.4. 28
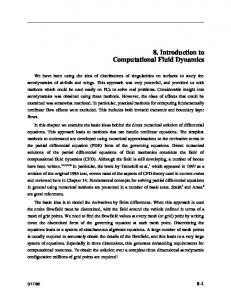
Figure 4.4: Inflow performance relationships (adapted from Economides et al., 2000) Another relevant performance analysis based on pressure losses versus production rates, implemented on this research study on well completions, was the application of a NODAL analysis to the near-wellbore region (Gilbert, 1954; Mach et al., 1979; Greene, 1983; Brown and Lea, 1985) [26, 37, 28, 6]. To apply this methodology, two main assumptions were made: 1. Due to the geometric complexity of the reservoir/completion interface, an average pressure at this interface (P¯comp ) is calculated; therefore, the pressure drop inside the formation rock was calculated as ∆Pres = Pe − P¯comp . 2. The pressure gradient of gas between the wellbore and two (2) feet above the packerdepth level was insignificant; thus Po ≈ Pwf and the pressure drop across the completion, either gravel pack or frac pack, and the wellbore is ∆Pcomp = P¯comp − Po . As mentioned before, the value of ∆P was fixed on each simulation scenario, so that both Pe and Po were known, while P¯comp was calculated from the numerical simulation results. Figure 4.5 illustrates the application of NODAL analysis to the near-wellbore region.
29
Figure 4.5: NODAL analysis of the near-wellbore region
4.5 4.5.1
Fines Migration Analysis Particle Transport Theory
According to the ANSYS CFX Solver Theory Guide (2014), the particle transport modeling is a multiphase flow model where particles are tracked separately rather than considering them an additional fluid phase. The tracking consists of solving a set of equations in time for each individual particle as they move through the fluid phase. These equations are: • Position vector • Velocity vector • Temperature • Mass of species Equations are integrated using a simple integration method this way predicting particles behavior as they flow throughout the simulation domain.
4.5.2
Momentum Transfer
The forces acting on a particle that affect the particle acceleration are due to the difference between fluid velocity field and actual particle velocity. The equation describing such interactions on a particle was derived by Basset, Boussinesq and Oseen for a rotating reference frame (ANSYS CFX Solver Theory Guide, 2014): mP
dUP = FD + FB + FR + FVM + FP + FBA dt
30
(4.33)
where UP is the particle velocity vector, FD = drag force acting on the particle, FB = buoyancy force due to gravity, FR = forces due to domain rotation (Corilis and centripetal forces), FVM = virtual mass force, FP = pressure gradient force, and FBA = Basset force (this term is not implemented on ANSYS CFX).
4.5.3
Wentworth Scale
The Wentworth scale (or Udden-Wentworth) is used in the United States to classify granular particles according to their size (ISO 14688-1:2002). Table 4.1 is a reduced version of the original Wentworth scale that summarizes the particles sizes most commonly used in surface equipment design. Table 4.1: Classification of Common Grain Sizes
4.5.4
Size range
Wentworth Class
500 to 1000 µm 250 to 500 µm 125 to 250 µm 62.5 to 125 µm 3.9 to 62.5 µm
Coarse sand Medium sand Fine sand Very fine sand Silt (mud)
Variations on Permeability and β Factor
Based on pore-scale modeling and simulation of sanding processes on near-wellbore models for frac packed gas wells, Anbar (2014) [2] proposed a variety of directional correlations to predict permeability decrease and β factor increase as functions of the sand concentration build-up (cs ) due to the effect of sand particles getting trapped within the porous medium. The correlations for k(cs ) and β(cs ) in the x-direction are the following: kx = kx0 (1 − 0.00358cs1.134 )
(4.34)
βx = βx0 (1 + 0.00846c1.093 ) s
(4.35)
where kx0 and βx0 are the initial permeability and inertial coefficient, i.e. no sand production, respectively. For the case of radial flow, assuming that the change in both permeability and β factor is the same in all directions, the terms kx , kx0 , βx and βx0 reduce to the general forms k, k0 , β and β0 .
31
4.5.5
Finnie Model for Erosive Wear
According to the ANSYS CFX Solver Theory Guide (2014), for nearly all metals, erosion is found to attach to the equation: E = kVPn f (γ)
(4.36)
where E is a dimensionless mass, VP is the particle impact velocity and f (γ) is a dimensionless function of the impact angle. The value of n is generally 2.3 ≤ n ≤ 2.5 for metals. Finnie’s model for erosive wear uses n = 2, and the closure relationships: f (γ) =
1 cos2 γ 3
1 3 1 if tan γ ≤ 3
if tan γ >
f (γ) = sin 2γ − 3 sin2 γ
(4.37a) (4.37b)
In order to deliver a non–dimensionless erosion factor, ANSYS CFX uses the following formulation of Finnie’s model (Finnie and McFadden, 1978) [19]: � E=
VP V0
�n f (γ)
where V0 = k −1/n . Typical values for steel are 590 m/s.
32
(4.38)
5
Description of Simulation Case Studies
This chapter gives a general description of each of the case studies analyzed in the frame of this research study. One of the most important factors investigated in this thesis research was the well completion performance. In this regard, the following three well completion case studies were thoroughly analyzed: 1. Gravel pack with Lp = 0.5 ft 2. Gravel pack with Lp = 1 ft 3. Frac-pack with xf = 1 ft Simulation results were organized in such a way that Figure 4.4 could be constructed out of the numerical data obtained after solving each CFD scenario. In addition, relevant analysis, such as the comparison of predicted gas production rates given by Darcy’s law and Forchheimer formulation and sand production analysis, including erosional damage, were performed based on F&P completion scheme model.
5.1
Verification Case Study
The purpose of this preliminary case was to run a CFD simulation case for which an analytic solution exists. Then, a comparison between the numerical results and the exact solution was performed. This served as a measure of the level of accuracy and quality expected out of the subsequent CFD simulation scenarios. Thus, based on the result out of the verification case, a decision to either accept or reject forthcoming simulation results could be made. Detailed information about the geometry and CFD model general setup can be found in Section 7.1.
33
5.2
Post-Processing of Well Completion Simulations
This part of the research dealt with the CFD modeling of a gas producing well with three different completion schemes (two gravel pack and one frac pack). The definition of the geometry of each CFD model is given in Section 6.1. Likewise, the general model setup process is discussed in detail in Section 6.3. The procedure to perform the analysis of the numerical simulation results was the same for either case study, and consisted of three basic result post–processing approaches: 1. Pressure contour plots: diverse 3-D pressure contour plots were generated so that the cross-sectional and radial pressure distribution at different pressure drawdowns could be visually approached. Likewise, a 2-D pressure contour plot was created on the axisymmetric plane in order to observe pressure distribution inside perforation tunnels and get a general perspective about the pressure behavior inside the completion region. 2. Flow patterns, velocity field, and velocity magnitude contour plots: streamlines plots were created at different depths in the r–direction aiming to identify the kind of known flow pattern (radial, linear, bi-linear, spherical, etc.) that may apply to a certain case study. In the same line, a cross-sectional surface streamlines plot was generated on the axisymmetric plane to observe flow behavior near the wellbore. Finally, 2-D plots of velocity magnitude (||v||) and velocity field (v) were generated not only to illustrate flow behavior but to identify the locations where high velocity is occurring. 3. Turbulence kinetic energy and turbulence eddy frequency: the concept of turbulence and turbulence kinetic energy (TKE) was used in this part of the analysis to predict the zones where turbulent effects may occur, using the levels of turbulence kinetic energy production as an indicator. The objective was to verify whether turbulence can occur within the porous media, from a theoretical perspective, and, if so, at what level in reference to that occurring inside the wellbore and tubing string, where the most of the TKE is dissipated. This technique is exploited by several authors to identify turbulent regions, like inside choke valves and downhole equipment (Peri and ˇ Rogers, 2007; Savli, 2012). In addition, the turbulence eddy frequency plot allowed the identification of the kinds of eddies that were forming at certain locations of interest within the domain.
34
5.3
Darcy versus Forchheimer Formulation
The CFD model of the frac pack completion scheme was run for the case β = 0 in all porous media as to neglect energy loss due to inertial effects. Numerical simulation results were compared against those previously obtained for the same simulation using Forchheimer formulation (β > 0). This comparison was tabulated and the respective outlet pressure versus gas volumetric flow rate at standard conditions plot was generated.
5.4
Well Completion Performance
The objective of this study was to quantify the improvement of running an specific well completion scheme with respect to the previous scheme. For instance, the gravel pack completion performance, case 2 (Lp = 1 ft), was compared against the gravel pack completion performance, case 1 (Lp = 0.5 ft). Following this logic, the frac pack completion model was compared against the most efficient gravel pack completion scheme.
5.5
Fines Migration Analysis
The fines migration case study evaluated on this research was based on the observation that permeability reduces and β factor increases as fines are being produced and its volumetric concentration inside the reservoir increases. Basically, sand grains are likely to get clogged inside the porous media, more specifically in the near-wellbore region where a high velocity field occurs, thus reducing the permeability of this region and consequently inertial effects should increase accordingly. In this regard, Anbar’s permeability and β factor correlations were implemented on the F&P completion model through CFX Expression Language (CEL) functions for the case Po = 200 psia or ∆P = 1, 000 psia. To model this scenario, a typical sand particle size distribution was used, sand grain density was assumed ρsand = 2.65 g/cm3 , and the total sand production rate was 1 ≤ m ˙ sand ≤ 20 lbm /s. Isothermal conditions were assumed (150° F). Sand grain density was defined as ρsand = 2.65 g/cm3 and the produced sand had the hypothetical normalized particle size distribution show in Table 5.1. CFX-Solver automatically calculated the number of particles of certain size required to meet the required fines mass flow rate.
35
Table 5.1: Produced Sand Grain Size Distribution Particle Diameter
Size (µm)
Maximum Minimum Mean Standard deviation
80 10 50 25
Finally, different particle tracking plots were generated in order to observe flowing sand behavior inside perforation tunnels and wellbore. Also, erosional effects on the tubing string were analyzed.
36
6
6.1
Methodology
Geometry and CAD Models
CAD models were built using SolidWorks 2013. Axisymmetric condition was assumed with respect to the front plane (r-z), hence only half of the original near the wellbore model was simulated. Final assemblies were exported in Parasolid format to import them directly onto the ANSYS Meshing environment. In total four different CAD models were built, one per case study. All of these models (except the verification case model) had common dimensions as listed in Table 6.1. Table 6.1: Common Near-Wellbore Geometry Dimensions Top layer height Bottom layer height External reservoir radius Wellbore radius Production casing ID Production casing OD Cement sheath thickness Production tubing string ID
htop hbottom re rw di do – –
1 1 3.5 0.5 6 65/8 13/16 3
ft ft ft ft in in in in
Likewise, the case studies corresponding to the gravel pack completion had shared properties as well, such as shot density (6 spf), perforation tunnel diameter (0.75 in), and phase angle (180°). The distance between perforation tunnels was 2 in (center-to-center). Perforation tunnel length (lp ), however, was measured from the sand face and had a different value for each study (0.5 ft for case 1 and 1 ft for case 2).
37
Figure 6.1: Geometry of the gravel pack model The half-fracture length of each bi-wing fracture of the frac pack completion case study was xf = 1 ft measured from sand face. The maximum fracture height and width, hf max = 2 ft and wf max = 2.5 in, respectively, were both measured at the centerline of the wellbore. Perforation tunnels geometry had the same dimension and configuration as for the gravelpack completion scheme.
Figure 6.2: Geometry of the frac pack model 38
Finally, the verification case model was based on a hollow cylinder with external radius re = 3.5 ft and wellbore radius rw = 0.125 ft. The total height of the model was h = 2 ft.
6.2
Meshing and Mesh Statistics
The software used to generate the mesh files was ANSYS Meshing Tool. A general mesh refinement was applied to all the CAD models by setting the mesh generation option relevance factor to 25%. Other than that, the meshing process was done automatically, letting the software decide whether meshing method to employ over convoluted geometric features, such as perforation tunnels, fractures, and domain interfaces interfaces. The resulting volume meshes can be seen in Figures 6.3 and 6.4. Notice that the finest mesh refinement was done over the reservoir/completion interface, either for perforation tunnels or frac pack completion fractures. In other words, the meshing software anticipated possible convergence issues due to poor mesh quality in this particular region, and fixed it beforehand. One important drawback with respect to the mesh generation is that the current ANSYS CFX License installed on Louisiana State University High-Performance Computing system restricts the maximum number of nodes to 512,000 for parallel solver runs. This was a very deterring constraint that reduced the chances of implementing more realistic completion geometries, as well as the use of larger dimensions for the near the wellbore region.
(a) Gravel-pack (Lp = 0.5 ft)
(b) Gravel-pack (Lp = 1 ft)
Figure 6.3: Detailed mesh view of the gravel-pack completion models
39
(a) Isometric view of the model
(b) Mesh at the F&P fracture/reservoir interface
Figure 6.4: Mesh definition for the F&P completion model
Table 6.2: Global Simulation Case Studies Mesh Statistics
6.3 6.3.1
Simulation Case Study
Nodes
Elements
Number
Verification
7,650
. Tetrahedrons
6,528
Gravel pack (Lp = 0.5 ft)
201,767
. Tetrahedrons . Prisms . Hexahedrons
877,428 642 25,551
Gravel pack (Lp = 1.0 ft)
335,444
. Tetrahedrons . Prisms . Hexahedrons
1,463,426 502 44,590
Frac pack
163,606
. Tetrahedrons
805,715
Computational Fluid Dynamics Modeling Simulation Pre-Processing
Simulations were setup in ANSYS CFX-Pre. This CFD pre-processor features a variety of turbulence models, from laminar model to the complex Detached Eddy Simulation (DES) and Large Eddy Simulation (LES). CFX also features the widely known two-equation turbulence models: Standard and Renormalized Group (RNG) k − ε model, Wilcox and Baseline (BSL) k − ω model, and Shear Stress Transport (SST) model. The turbulence model chosen for this research study was shear stress transport (SST). According to the CFX Solver Theory Guide (2014), the k − ω based SST model accounts 40
for the transport of the turbulence shear stress and gives highly accurate predictions of the onset and the amount of flow separation under adverse pressure gradients. In addition, Darcy’s Law and Forchheimer formulation are featured as built-in models to simulate fluid flow in porous media. The main reason for having chosen CFX for this project is its ability to couple porous media with free-stream flow models. CFX includes a built-in list of common dry and wet hydrocarbons modeled with different equations of state, including the SRK-EOS. All simulation scenarios were setup using the SRK-EOS material library for methane. 6.3.1.1
Domain generation and setting of boundary conditions
Table 6.3 presents the set of general simulation conditions that applied to all simulation case studies. Buoyancy effects were neglected and the reference pressure was set to 0 psi so that the resulting pressure data would be computed in absoulte pressure values, more specifically in psia. Table 6.3: General CFD Simulation Conditions Condition Simulation type Fluid Equation of state Heat transfer model Fluid temperature Porous media model
Turbulence model
Description Steady state Methane (CH4 ) (liquid water, verification case only) Soave-Redlich-Kwong Isothermal 150° F (25° C for verification case only) . Loss model: Isotropic . Loss velocity type: Superficial . Isotropic loss: Permeability and loss coefficient Shear Stress Transport (SST)
Given that the near-wellbore model was made up of different regions, each using a different mathematical model, several subdomains were created to describe each zone and assign its simulation properties. Forchheimer formulation was chosen as the porous media flow model and the corresponding values of β factor for each subdomain were calculated using a correlation proposed by Khaniaminjan (2008). The summary of this stage of the simulation setup can be found in Table 6.4. Domain interface boundary conditions were implemented to glue the different subdomains: upper and bottom formation layers, formation to completion region, and completion to wellbore. External boundary was given an inlet boundary condition with fixed pressure (Pe = 1, 200 psia). Likewise, the top-most surface of the tubing string segment was described by 41
an outlet boundary condition whose pressure was constant for each simulation scenario, as well. This confirms that all CFD simulations were pressure-driven flow. Table 6.4: Domain Definition of Porous Media subdomains Subdomain Top layer Bottom layer Gravel-pack F&P completion
Permeability
Porosity β =
17.2×10¹⁰ k1.76
(k, mD)
(φ)
(ft−1 )
5 300 45,000 45,000
0.11 0.25 0.32 0.32
1.01 × 10¹⁰ 7.51 × 10⁶ 3.13 × 10³ 1,111.41
In order to generate simulation scenarios with different pressure drawdown, outlet pressure Po was changed at the end of a simulation run. This pressure ranged from 1,100 to 200 psia, decreasing 100 psi per simulation. Two additional cases were run to better describe flow behavior at low pressure drawdown (1,150 and 1,050 psia). Additionally, as mentioned earlier, a symmetry boundary condition was setup over the front plane of each CFD model. Moreover, any remaining surface was assigned a wall, or no-flow, boundary condition. 6.3.1.2
Additional simulation conditions for the fines migration case study
This case study used the same CFD model as for the frac pack completion case for ∆P = 1, 000 psi. Sand particles were injected into the simulation domain through the inlet boundaries (on each formation layer), by assigning a mass flow rate of sand on each layer whose sum added up to half the intended total mass flow rate (because the symmetry condition of the model). In total, nine sand production scenarios were simulated, where m ˙ sand = 0.5, 1, 1.5, 2, 3, 5, 7.5, and 10 lbm /s. With respect to momentum transfer modeling, the only force considered to be acting on migration particles was the drag force, using the Schiller-Naumann model (ANSYS CFX Solver Theory Guide, 2014). All other forces were neglected for simplicity purposes. Five hundred particles were tracked from each inlet outwards. The Lagrangian approach was implemented by the numerical CFD solver (CFX-Solver) to track particles inside the near-wellbore model and to calculate their velocity and residence time, this way being able to compute the amount of particles that entered and left the domain after certain time. Because in reality it takes a finite amount of time for the particles to enter and leave a container, sand concentration increases during the migration process.
42
Anbar’s correlations were implemented through CFX Expression Language (CEL) functions in CFX-Pre to account for both decrease in permeability and increase in β factor due to the sand concentration buildup. Finally, Finnie’s erosion model was also implemented to capture the effect of migrating sand on erosion rates inside the tubing string.
6.3.2
Numerical Solving Process
CFX-Solver was used to solve all CFD simulations. Simulations were solved on the LSU HPC using the CFX-Solver in parallel mode through a batch job submission file. Also, diverse solver options, such as multi-grid and double precision solver were setup. Convergence criteria for mass and momentum equations were set to ≤ 1 × 10⁻⁸ and 1 × 10⁻⁵ , respectively. As a final remark, it is worthwhile to mention that all CFD simulations achieved the imposed convergence condition.
6.3.3
Simulation Post-Processing
CFD-Post was used to post-process simulation results. Diverse pressure and velocity contour plots were generated at various locations, mainly over regions of high importance within the simulation domain, like near perforation tunnels and F&P completion fractures as well as reservoir/completion interface. In addition, flow behavior was described by the aid of 2-D and 3-D streamlines plots. Also, the function calculation tool was used to get numerical data from the simulation results file, such as average pressure at the reservoir/completion interface (complex geometry), maximum velocity, and average velocity at packer-depth level, as well as mass flow rate at inlet(s) and outlet. The gathered numerical data was tabulated and classified per case study in Microsoft Excel, this way being able to compare the ultimate completion performance between models. In reference to the material balance analysis, as CFX solves the mass conservation equation in terms of mass flow rate [MT−1 ], it was necessary to determine a conversion factor from gas mass flow rate to standard volumetric flow rate: qsc = 2.044918m ˙ with qsc in MMscf/d and m ˙ in lbm /s.
43
(6.1)
7
7.1
Results and Discussion
Verification Case
The verification case was based on the incompressible flow through isotropic porous media model. The exact solution to this model is given by: P (r) = Pwf + 141.22
� qµ � kh
� ln
r rw
� (7.1)
The former equation uses oilfield units (P in psi, q in STB/d, k in mD, h ft, and µ in cP). As established earlier, h = 2 ft and rw = 0.125 ft. Water density and viscosity were ρ = 997 kg/m3 and µ = 0.89 cP, respectively. Permeability and porosity of the reservoir were 250 mD and 0.25. Isothermal conditions and negligible inertial effects were also assumed. Furthermore, Eq. 7.1 can be rearranged as: � q = 0.00708
kh µ
�
∆P � � ln rrwe
(7.2)
where ∆P = Pe − Pwf is the pressure drawdown of the system. Using Eq. 7.2 resulted in a water flow rate of q = 477.54 STB/d. The CFD simulation of the model calculated a mass flow rate of m ˙ = 1.9236 lbm /s, equivalent to 475.78 STB/d under the assumption of constant density. Table 7.1 summarizes the comparison between numerical and analytical results for pressure. The maximum error between cases was 0.23%. Likewise, the relative error in the prediction of flow rate was 0.37%. Figure 7.1 displays both the simulated and analytical results. In conclusion, as relative errors were considerably small, subsequent CFD simulations were deemed numerically reliable. Nevetheless, it is important to mention that the ultimate criterion to accept any numerical result as accurate was based on convergence and tolerance values for each of the equations solved.
44
Table 7.1: Numerical Comparison Between Analytical Model and CFD Simulation Radial
Predicted
Analytical
Relative
Distance
P (r)
P (r)
Error
(ft)
(psig)
(psig)
(%)
0.125
800.36
800.00
0.05
0.263
889.15
888.58
0.06
0.538
975.34
974.09
0.13
0.745
1,014.37
1,012.84
0.15
1.020
1,052.24
1,050.36
0.18
1.227
1,074.26
1,072.35
0.18
1.503
1,098.62
1,096.50
0.19
1.778
1,118.85
1,116.58
0.20
2.054
1,136.20
1,133.76
0.22
2.260
1,147.76
1,145.19
0.22
2.536
1,161.46
1,158.90
0.22
2.742
1,170.87
1,168.24
0.22
3.018
1,182.31
1,176.66
0.22
3.224
1,190.21
1,187.56
0.22
3.500
1,200.03
1,197.33
0.23
Figure 7.1: Simulated and analytical pressure distribution
45
7.2
Gravel Pack Completion
7.2.1
Case Study 1 (Lp = 0.5 ft)
Table 7.2 condenses simulation results for gas volumetric flow rate (qsc ), velocity at packerdepth level (||vpacker ||), maximum velocity inside the completion region (||vmax ||), mass flow rate through inlet(s) and outlet (m ˙ bottom , m ˙ top , and m ˙ outlet ), and material imbalance. The later returned a maximum imbalance of 0.0017% for Po = 500 psia (∆P = 700 psi). Equally important is the fact that the bottom formation layer contributed to approximately 98.20% of the total gas production. On the contrary, the top formation layer was only accounted for near 1.80% of the total production. This examination led to the conclusion that would the imbalance be higher than 1.80% then production from the top layer would be neglected; under those circumstances, the upper mass imbalance limit was 1.80%. Table 7.2: Simulation Results for Gravel Pack (Case 1)
7.2.1.1
Po
qsc × 106
||vpacker ||
||vmax ||
m ˙ bottom
m ˙ top
(psia)
(scf/d)
(ft/s)
(ft/s)
(lbm /s)
(lbm /s)
1,150
0.86
2.72
29.35
0.4123
0.0072
0.9829
0.0002
1,100
1.46
4.83
50.91
0.6992
0.0123
0.9826
0.0001
1,050
1.93
6.72
70.05
0.9272
0.0166
0.9825
0.0003
1,000
2.33
8.53
88.19
1.1183
0.0201
0.9823
0.0000
900
2.97
12.15
124.15
1.4271
0.0260
0.9821
0.0010
800
3.47
16.05
162.44
1.6683
0.0307
0.9819
0.0010
700
3.88
20.56
206.52
1.8611
0.0344
0.9818
0.0011
600
4.20
26.10
258.24
2.0154
0.0375
0.9817
0.0016
500
4.45
33.40
324.00
2.1375
0.0399
0.9817
0.0017
400
4.65
43.83
410.96
2.2312
0.0418
0.9816
0.0011
300
4.79
60.58
530.43
2.2991
0.0432
0.9816
0.0011
200
4.88
93.19
695.04
2.3429
0.0441
0.9815
0.0004
m ˙ bottom m ˙ outlet
Imbal. (%)
Pressure distribution
Pressure distribution in the near-wellbore shows that the pressure gradient was adverse in those regions surrounding perforation tunnels, indicating sudden changes in velocity (Figure 7.2). In like manner, Table 7.3 summarizes the nodal analysis results for the model, including pressure drop inside the formation (∆Pres ) and completion/wellbore region (∆Pcomp ), and well productivity index at each simulation scenario.
46
(a) Po = 1, 150 psig
(b) Po = 1, 000 psig
(c) Po = 900 psig
(d) Po = 800 psig
(e) Po = 600 psig
(f) Po = 500 psig
(g) Po = 400 psig
(h) Po = 300 psig
(i) Po = 200 psig
Figure 7.2: Pressure distribution at various pressure drawdowns (Lp = 0.5 ft) In the light of Figure 7.2, it seems that the pressure distributes almost uniformly right after the perforation tunnels tips. Nevertheless, pressure distribution is nonuniform inside the completion region; this is mainly because the uneven number of perforations on either side of the wellbore as well as the fact that the reservoir is made up by two formation layers, both producing through the same completion scheme.
47
Table 7.3: NODAL Analysis of the Near-Wellbore Region (Gravel Pack, Case 1) Layer Bottom Top Bottom Top Bottom Top Bottom Top Bottom Top Bottom Top Bottom Top Bottom Top Bottom Top Bottom Top Bottom Top Bottom Top
7.2.1.2
Pe
∆Pres
P¯comp
∆Pcomp
Po
qsc × 106
J × 103
(psia)
(psi)
(psia)
(psi)
(psia)
(scf/d)
(scf/d/psi)
35.63
1,164.37
14.37
48.79
1,151.21
1.21
1,150
0.86
17.15
68.09
1,131.91
31.91
97.43
1,102.57
2.57
1,100
1.46
14.55
98.78
1,101.22
51.22
145.97
1,054.03
4.03
1,050
1.93
12.87
128.14
1,071.86
71.86
194.41
1,005.59
5.59
1,000
2.33
11.64
183.45
1,016.55
116.55
290.93
909.07
9.07
900
2.97
9.90
234.46
965.54
165.54
386.84
813.16
13.16
800
3.47
8.69
281.00
919.00
219.00
481.88
718.12
18.12
700
3.88
7.74
322.68
877.32
277.32
575.55
624.45
24.45
600
4.20
6.97
358.88
841.12
341.12
666.90
533.10
33.10
500
4.45
6.33
388.92
811.08
411.08
754.25
445.75
45.75
400
4.65
5.78
412.02
787.98
487.98
834.41
365.59
65.59
300
4.79
5.29
427.59
772.41
572.41
902.37
297.63
97.63
200
4.88
4.85
1,200 1,200 1,200 1,200 1,200 1,200 1,200 1,200 1,200 1,200 1,200 1,200
Velocity profile and flow behavior
Figure 7.3 display the predicted 2-D flow patterns when ∆P = 500 psi using streamlines . Although actual flow pattern might be classified as radial, notice that flow swirls around the exterior part of the wellbore, leading to a nonuniform cross-sectional flow behavior (see Figure 7.4). However, flow behaves more radial-like away a certain distance from the perforation tunnels tip. Additionally, it must be taken into consideration that Lp = 0.5 ft is a very small length in comparison to the reservoir scale. This argumentation indicates that the assumption of radial flow for this completion scenario may be suitable.
48
(a) Top plane (D = 0 ft)
(b) Middle plane (D = −1 ft) (c) Bottom plane (D = −2 ft)
Figure 7.3: Streamlines in the r-direction at different depths (Lp = 0.5 ft) The cross-sectional flow behavior in the near-wellbore region, as shown in Figure 7.4, indicates that the majority of the gas enters the wellbore through the tunnels tip. Together with this, another important remark is that only a small portion of the available surface area of the tunnels is actually utilized to drive gas into the completion zone.
Figure 7.4: Cross-sectional flow pattern (Lp = 0.5 ft) Regarding the inner wellbore region, the resulting flow pattern is not symmetric. This is due to the uneven number of perforation tunnels on each side of the wellbore, as mentioned earlier. Figure 7.5 displays the velocity distribution inside the tunnels and wellbore along with its corresponding velocity field (vector plot). Notice that an increase in the gas velocity magnitude occurs inside the wellbore/tubing string due to gas expansion as pressure lowers, as expected.
49
(a) Velocity magnitude, ||v||
(b) Velocity vector field, v
Figure 7.5: Velocity inside the gravel pack region (Lp = 0.5 ft) The 3-D streamlines plot in Figure 7.6 shows that the flow pattern is highly turbulent inside the wellbore. Vorticity effects begin as soon as gas flows out of perforation tunnels. Nonetheless, those vortices are smoothed out as gas flows upwards, so that flow behavior can be considered laminar at and above packer-depth level.
Figure 7.6: Detailed streamlines plot inside the wellbore (Lp = 0.5 ft)
50
7.2.1.3
Turbulence kinetic energy and turbulence eddy frequency
Most of the turbulence kinetic energy losses occur inside perforation tunnels located in the bottom layer and inside the wellbore, as displayed in Figure 7.7. Likewise, the greencolored regions between tunnels indicate that it required more kinetic energy for the gas to flow vertically through these regions than enter the tunnels through their tips. Also, observe that a considerable amount of turbulence kinetic energy is dissipated inside the gravel-pack, which is a porous medium.
Figure 7.7: Turbulence kinetic energy (Lp = 0.5 ft) Analysis of the eddy frequency distribution of the turbulent zones (Figure 7.8) shows that the largest eddies are produced inside the wellbore and, to some extent, inside the gravel pack region, mostly near the perforations/wellbore interface.
Figure 7.8: Turbulence eddy frequency (Lp = 0.5 ft) 51
7.2.2
Case Study 2 (Lp = 1 ft)
Table 7.4 gives the synopsis of CFD simulation results corresponding to the scenario when Lp = 1 ft. Numerical results for gas volumetric flow rate (qsc ), velocity at packer-depth level (||vpacker ||), maximum velocity (||vmax ||), mass flow rate through inlet(s) and outlet (m ˙ bottom , m ˙ top , and m ˙ outlet ) are summarized. The maximum material imbalance was 0.0001%. Well completion performance (ηc ), measured as percentage increase on flow transport capacity with respect the the previous case study, is also presented. Table 7.4: Simulation Results for Gravel Pack (Case 2) Po
qsc × 106
||vpacker ||
||vmax ||
m ˙ bottom
m ˙ top
(psia)
(scf/d)
(ft/s)
(ft/s)
(lbm /s)
(lbm /s)
1,150
0.98
3.10
31.88
0.4696
0.0085
1,100
1.66
8.81
52.75
0.7959
1,050
2.20
7.53
75.89
1,000
2.65
9.71
900
3.38
800
Imbal.
Perform.
(%)
(ηc , %)
0.9822
0.0001
13.99
0.0147
0.9818
0.0001
13.92
1.0551
0.0198
0.9816
0.0000
13.89
95.47
1.2723
0.0241
0.9814
0.0000
13.87
13.61
134.24
1.6229
0.0312
0.9812
0.0001
13.83
3.95
18.26
175.47
1.8966
0.0368
0.9810
0.0000
13.80
700
4.41
23.39
222.16
2.1148
0.0414
0.9808
0.0001
13.75
600
4.77
29.69
277.85
2.2891
0.0450
0.9807
0.0001
13.71
500
5.06
37.98
347.52
2.4266
0.0480
0.9806
0.0001
13.65
400
5.28
49.82
438.64
2.5316
0.0502
0.9805
0.0001
13.59
300
5.44
67.75
561.21
2.6071
0.0519
0.9805
0.0001
13.52
200
5.54
104.17
730.67
2.6553
0.0529
0.9805
0.0000
13.46
m ˙ bottom m ˙ outlet
The productivity of the gas well increased an average of 13.75% after doubling up the length of all perforation tunnels (Lp = 0.5 ft for case study 1). The maximum production rate is 5.54 MMSCFD at Po = 200 psia compared to 4.88 MMSCFD in the previous case study for the same pressure drawdown. Bottom formation layer sustains 98.11% of the total gas production and, in despite flow rate from the top layer increases, production ratio remains almost constant (98.20% for case study 1). In general, elongating perforation tunnels had a overall positive impact on the well completion performance. 7.2.2.1
Pressure distribution
Pressure behavior for this case study shows that the pressure gradient rapidly increases as the outlet pressure is lowered (Figure 7.9). Therefore, the proposed completion scheme is driving gas more readily into the wellbore, in contrast to case study 1. However, the 52
enhancement in gas production is counterbalanced by a grow in kinetic energy losses or inertial effects inside the gravel pack completion region. This conclusion can also be drawn from the pressure gradient perspective, as in despite that the pressure gradient is higher than in case study 1, total production ratio scarcely decreases (0.08%). Furthermore, Table 7.5 summarizes the numerical results of the nodal analysis in the near-wellbore region and the well productivity index for this completion case study.
(a) Po = 1, 150 psia
(b) Po = 1, 000 psia
(c) Po = 900 psia
(d) Po = 800 psia
(e) Po = 600 psia
(f) Po = 500 psia
(g) Po = 400 psia
(h) Po = 300 psia
(i) Po = 200 psia
Figure 7.9: Pressure distribution at various pressure drawdowns (Lp = 1 ft)
53
Table 7.5: NODAL Analysis of the Near-Wellbore Region (Gravel Pack, Case 2) Layer Bottom Top Bottom Top Bottom Top Bottom Top Bottom Top Bottom Top Bottom Top Bottom Top Bottom Top Bottom Top Bottom Top Bottom Top
Pe
∆Pres
P¯comp
∆Pcomp
Po
qsc × 106
J × 103
(psia)
(psi)
(psia)
(psi)
(psia)
(scf/d)
(scf/d/psi)
28.10
1,171.90
21.90
47.54
1,152.46
2.46
1,150
0.98
19.55
51.80
1,148.20
48.20
97.43
1,105.24
5.24
1,100
1.66
16.58
73.26
1,126.74
76.74
141.80
1,058.20
8.20
1,050
2.20
14.65
93.15
1,106.85
106.85
118.68
1,011.32
11.32
1,000
2.65
13.25
129.28
1,070.72
170.72
281.95
918.05
18.05
900
3.38
11.27
161.31
1,038.69
238.69
374.50
825.50
25.50
800
3.95
9.88
189.57
1,010.43
310.43
466.09
733.91
33.91
700
4.41
8.80
214.10
985.90
385.90
556.30
643.70
43.70
600
4.77
7.93
234.80
965.20
465.20
644.36
555.64
55.64
500
5.06
7.20
251.50
948.50
548.50
728.77
471.23
71.23
400
5.28
6.57
264.00
936.00
636.00
806.66
393.34
93.34
300
5.44
6.01
272.18
927.82
727.82
872.93
327.07
127.07
200
5.54
5.51
1,200 1,200 1,200 1,200 1,200 1,200 1,200 1,200 1,200 1,200 1,200 1,200
Figure 7.10 shows the pressure distribution inside perforation tunnels for both gravelpack completion cases (Lp = 0.5 and 1 ft). From there, the absence of a pressure gradient inside upper tunnels might indicate either a very efficient or a poor pathway to drive gas into the wellbore. The latter is the actual case. In fact, Figures 7.5 and 7.13 confirm that gas transportation through the upper perforation tunnels is very low compared to the bottom tunnels given that velocity magnitude is very low.
54
(a) Lp = 0.5 ft
(b) Lp = 1 ft
Figure 7.10: Pressure distribution inside perforation tunnels 7.2.2.2
Velocity profile and flow behavior
The gas flow behavior exhibits the swirling effect around the wellbore seen in the previous case studied. Also, it can be seen that increasing perforation tunnels length lead to a more bi-linear flow pattern nearby the completion region. Figure 7.11 displays streamlines plot at different depths.
(a) Top plane (D = 0 ft)
(b) Middle plane (D = −1 ft) (c) Bottom plane (D = −2 ft)
Figure 7.11: Streamlines in the r-direction at different depths (Lp = 1 ft) The surface area on the gravel-pack/reservoir interface zone is utilized more efficiently, compared to the previous case study, to transport gas through perforation tunnels, as stated earlier. 55
As a final comment, it is quite intriguing that gas located in the bottom of the top layer tends to flow more readily towards the top-most tunnels (Figure 7.12). This characteristic might be produced due to the three-dimensional nature of flow, as perforations are only featured at 180°.
Figure 7.12: Cross-sectional flow pattern (Lp = 1 ft) Regarding gas velocity magnitude and flow pattern inside the wellbore, it can be highlighted that the higher velocities occur inside the perforation tunnels located in the bottom formation layer, as shown in Figure 7.13a. Furthermore, the velocity field plot (Figure 7.13b) confirms that the surface area of perforation tunnels is being used more efficiently to produce gas through the completion region.
(a) Velocity magnitude, ||v||
(b) Velocity vector field, v
Figure 7.13: Velocity inside the gravel pack region (Lp = 1 ft) 56
Similar to the previous case study, flow behavior inside the wellbore is heavily influenced by turbulence, as shown in Figure 7.14. However, fluid behaves more laminar-like and vortices vanish as gas flows upwards the tubing string.
Figure 7.14: Detailed streamlines plot inside the wellbore (Lp = 1 ft) 7.2.2.3
Turbulence kinetic energy and turbulence eddy frequency
Turbulence kinetic energy distribution indicates regions where gas is actively flowing, thus giving certain details about how the gas is being extracted from each formation layer of the reservoir. Figure 7.15 shows increased fluid activity in the bottom of the reservoir, more precisely, around the two bottom-most perforation tunnels. Similarly, gas kinetic energy increases between tunnels located in the top formation layer, with respect to the previous case, indicating that the completion scheme is performing more efficiently in the top layer. Similarly to the case study 1, most of the turbulent activity takes place inside the wellbore and, to some extent, inside the gravel-pack, as seen for the previous case. Regarding turbulence eddy frequency plot, it can be said that the largest eddies are generated in the transition zone between the wellbore and the tubing string, specifically in the bottom layer. Still there is turbulent activity inside the gravel pack, where gas experiences the highest change in velocity magnitude (Figure 7.16).
57
Figure 7.15: Turbulence kinetic energy (Lp = 1 ft)
Figure 7.16: Turbulence eddy frequency (Lp = 1 ft)
7.3
Frac Pack Completion
Table 7.7 summarizes the numerical results corresponding to the F&P completion scheme. This results summary includes gas volumetric flow rate (qsc ), velocity at packer-depth level (||vpacker ||), maximum velocity (||vmax ||), mass flow rate through inlet(s) and outlet (m ˙ bottom , m ˙ top , and m ˙ outlet ) are summarized. The maximum material imbalance was 0.0004% for the case Po = 1, 150 psia. Well completion performance (ηc ), measured as the percentage increase on flow transport capacity with respect the the gravel-pack case study 2, is presented as well.
58
Table 7.6: Simulation Results for the F&P Completion Case Po
qsc × 106
||vpacker ||
||vmax ||
m ˙ bottom
m ˙ top
(psia)
(scf/d)
(ft/s)
(ft/s)
(lbm /s)
(lbm /s)
1,150
1.40
4.37
30.18
0.6718
0.0115
1,100
2.43
7.97
53.65
1.1700
1,050
3.28
11.27
74.87
1,000
4.00
14.45
900
5.16
800
Imbal.
Perform.
(%)
(ηc , %)
0.9831
0.0004
42.93
0.0206
0.9827
0.0000
46.88
1.5753
0.0282
0.9824
0.0000
49.17
95.13
1.9190
0.0347
0.9822
0.0001
50.71
20.74
135.36
2.4798
0.0458
0.9819
0.0001
52.69
6.09
27.76
178.26
2.9213
0.0547
0.9816
0.0003
53.92
700
6.82
35.75
226.89
3.2750
0.0620
0.9814
0.0000
54.76
600
7.42
45.56
284.57
3.5586
0.0679
0.9813
0.0002
55.37
500
7.88
58.43
356.12
3.7827
0.0726
0.9812
0.0001
55.80
400
8.24
76.79
448.42
3.9540
0.0762
0.9811
0.0001
56.10
300
8.50
106.20
570.00
4.0769
0.0788
0.9810
0.0003
56.29
200
8.66
162.59
742.31
4.1549
0.0805
0.9810
0.0000
56.39
m ˙ bottom m ˙ outlet
The productivity of the gas well increased an average of 52.58% and 73.56% with respect to the case studies 2 and 1, respectively, after stimulating the well to create the bi-wing fractures scheme. The maximum gas production rate is 8.86 MMSCFD at Po = 200 psia compared to 5.54 MMSCFD in the previous case study for the same ∆P . Bottom formation layer contributes with 98.17% of the total gas production and the total production ratio is akin to the previous case studies. As a conclusion, the frac pack completion scheme had the greatest impact on the improvement of well productivity.
7.3.1
Pressure Distribution
Pressure distribution is definitely more uniform than for either gravel pack completion cases. From Figure 7.17 it can be seen that the pressure gradient is more evenly distributed over the near-wellbore region given that both gas is produced simultaneously from formation layers through a common reservoir/completion interface. In addition, a similar pressure distribution is present inside all perforation tunnels, indicating that the whole completion region is being utilized to transport gas into the wellbore. Finally, a bi-linear flow pattern in the near wellbore can be anticipated by tracking the pressure distribution on the top of the reservoir.
59
(a) Po = 1, 150 psia
(b) Po = 1, 000 psia
(c) Po = 900 psia
(d) Po = 800 psia
(e) Po = 600 psia
(f) Po = 500 psia
(g) Po = 400 psia
(h) Po = 300 psia
(i) Po = 200 psia
Figure 7.17: Pressure distribution at different pressure drawdowns (xf = 1 ft) In contrast to the previous analyzed completion jobs, the pressure drop at the F&P completion/reservoir interface is shared between the two formation layers, meaning that kinetic energy losses are distributed among layers. However, it is still very likely that the largest energy loss occurs within the top formation layer due to its low permeability. Table 7.7 summarizes both nodal analysis in the near-wellbore region and the well productivity index calculations, corresponding to the frac pack completion case study.
60
Table 7.7: NODAL Analysis of the Near-Wellbore Region (Frac-Pack) Layer Bottom Top Bottom Top Bottom Top Bottom Top Bottom Top Bottom Top Bottom Top Bottom Top Bottom Top Bottom Top Bottom Top Bottom Top
7.3.2
Pe
∆Pres
P¯comp
∆Pcomp
Po
qsc × 106
J × 103
(psia)
(psi)
(psia)
(psi)
(psia)
(scf/d)
(scf/d/psi)
40.17
1,159.83
9.83
41.53
1,158.47
8.47
1,150
1.40
27.95
77.51
1,122.49
22.49
80.11
1,119.89
19.89
1,100
2.43
24.35
113.10
1,086.90
36.90
116.87
1,083.13
33.13
1,050
3.28
21.86
147.33
1,052.67
52.67
152.23
1,047.77
47.77
1,000
4.00
19.98
212.24
987.76
87.76
219.34
980.66
80.66
900
5.16
17.22
272.60
927.40
127.40
281.87
918.13
118.13
800
6.09
15.21
382.12
871.88
171.88
339.54
860.46
160.46
700
6.82
13.62
378.19
821.81
221.81
391.70
808.30
208.30
600
7.42
12.32
421.92
778.08
278.08
437.42
762.58
262.58
500
7.88
11.21
458.27
741.73
341.73
475.57
724.43
324.43
400
8.24
10.25
486.15
713.85
413.85
504.94
695.06
395.06
300
8.50
9.39
504.71
695.29
495.29
524.56
675.44
475.44
200
8.66
8.61
1,200 1,200 1,200 1,200 1,200 1,200 1,200 1,200 1,200 1,200 1,200 1,200
Velocity Profile and Flow Behavior
As anticipated, flow behavior in the r-direction exhibits a bi-linear pattern in the vicinity of the fractures while radial flow is seen at a moderate distance away from the wellbore. Likewise, the swirling effect around the wellbore is still present as for the previous case studies. Figure 7.18 shows 2-D streamlines plots at various depths.
61
(a) Top plane (D = 0 ft)
(b) Middle plane (D = −1 ft) (c) Bottom plane (D = −2 ft)
Figure 7.18: Streamlines in the r-direction at different depths (xf = 1 ft) Figure 7.19 shows the cross-sectional streamlines plot. From there, it can be inferred that flow behavior is less chaotic than for the gravel pack completion case studies. Also, this plot confirms that flow pattern can be considered radial at a certain distance away from the reservoir/completion interfaces. Furthermore, fluid flow is more evenly distributed inside the perforation tunnels given that pressure profile inside each tunnel is very similar to each other in both distribution and magnitude (Figure 7.17).
Figure 7.19: Cross–sectional flow pattern (xf = 1 ft) In addition, fluid velocity inside the fractures is more uniform than for a gravel-pack completion. Velocity field (Figure 7.20a) shows that gas tends to bend over the right side of the bottom of the wellbore, but this deflection is soon palliated as fluid flows towards the tubing string. In general, it can be concluded that flow pattern is uniform inside the wellbore. 62
(a) Velocity magnitude, ||v||
(b) Velocity vector field, v
Figure 7.20: Velocity inside the fractures (xf = 1 ft) Although the flow behavior is turbulent, it is less affected by inertial effects than for the previous gravel pack cases. As velocity is distributed throughout perforation tunnels more uniformly, consequently gas flows into the wellbore almost equally distributed, thus turbulence effects inside the wellbore are lesser in comparison to the gravel-pack completion, as shown in Figure 7.21.
Figure 7.21: Detailed streamlines plot inside the wellbore (xf = 1 ft) 63
7.3.3
Turbulence Kinetic Energy and Turbulence Eddy Frequency
Turbulence kinetic energy plot (Figure 7.22) shows that the kinetic energy inside the fractures is higher over the top of the completion region, more specifically around the top layer/completion interface. This plot also displays that the higher turbulence kinetic energy occurs near the packer-depth level. Further, turbulent eddies with the largest frequency occur as soon as the gas exits perforation tunnels.
Figure 7.22: Turbulence kinetic energy (xf = 1 ft)
Figure 7.23: Turbulenc eddy frequency (xf = 1 ft) In general, it can be concluded that the flow pattern is overall symmetric, with turbulent activity in the near-wellbore region, more specifically in the vicinity of perforation tunnels; however, gas behaves laminar-like inside the wellbore with low turbulence effects in the bottom of that region. 64
7.3.4
Darcy’s Law versus Forchheimer Formulation
This case study was based on the original frac pack completion model with setting β = 0 in all porous media. Simulation conditions were held the same as for the original case study, as well as the number of simulation jobs. The predicted well productivity curve became prominently non-linear in the region 200 < Po < 700 psia, as shown in Figure 7.24. This effect could be mainly attributed to the compressible fluid and to the geometry of the completion zone. An important observation is that overestimation in gas production could be as high as 96.65%, as shown in Table 7.8. Therefore, applying Darcy’s law concept to model well completions would lead to a very optimistic gas production forecasting, as anticipated in Section 3. Furthermore, special attention should be paid to the economic analysis of any project that may use Darcy’s approach to estimate well productivity. Table 7.8: Simulation Results for the F&P Completion Case—Darcy’s Law Po
qsc × 106
||vpacker ||
||vmax ||
m ˙ bottom
m ˙ top
(psia)
(scf/d)
(ft/s)
(ft/s)
(lbm /s)
(lbm /s)
1,150
1.67
5.24
38.66
0.8034
0.0133
1,100
3.25
15.09
79.07
1.5625
1,050
4.73
23.00
122.80
1,000
6.13
31.20
900
8.65
800
Imbalance
Diff.
(%)
(%)
0.9837
0.0001
19.53
0.0260
0.9837
0.0002
33.42
2.2773
0.0378
0.9837
0.0005
44.38
167.86
2.9484
0.0490
0.9837
0.0000
53.42
48.73
262.04
4.1622
0.0691
0.9837
0.0002
67.54
10.83
68.40
362.78
5.2111
0.0866
0.9837
0.0000
78.02
700
12.68
91.47
471.71
6.1000
0.1013
0.9837
0.0001
85.84
600
14.20
120.05
591.37
6.8302
0.1135
0.9837
0.0000
91.47
500
15.38
157.09
723.64
7.3985
0.1229
0.9837
0.0002
95.09
400
16.21
208.12
913.92
7.7960
0.1295
0.9837
0.0001
96.65
300
16.66
287.01
1,170.40
8.0142
0.1331
0.9837
0.0000
96.05
200
16.81
437.26
1,502.65
8.0870
0.1343
0.9837
0.0001
94.11
65
m ˙ bottom m ˙ total
Figure 7.24: Comparison between Darcy’s and Forchheimer models
7.3.5
Analysis of Well Completion Schemes Performance
Figure 7.25 summarizes the predicted well productivity of each completion. As discussed earlier in Section 7.2.2 and 7.3, doubling up perforation tunnels length in the gravel-pack case study would lead to an average 13.75% increase in production rate whereas the frac pack scheme represented an average 52.58% and 73.56% increase in production with respect to the gravel pack case studies 1 and 2, respectively.
Figure 7.25: Well productivity for the simulated completion schemes
66
7.3.6
Fines Migration Simulation Analysis
Because simulation results for the present analyses were obtained by using a porous fluid flow model, rather than a pore-scale model of Navier-Stokes equations, then the effect of sand concentration build-up inside the domain, due to fines migration and plugging in the pore space, could not be simulated using CFX. Rather, once particles entered the simulation domain, they were tracked for 10 minutes (residence time). During this time sand concentration is allowed to build up, since not all the loose material that entered the domain will be able to leave through the outlet in 10 minutes or less. Simulation results delivered an average reduction in gas production of 0.27%. Figure 7.26a shows the variation in gas production rates as fines are produced at different rates. The resulting values were correlated with a linear regression, yielding a coefficient of determination R = 0.9981. Additionally, Figure 7.26b illustrates the increase in volumetric concentration of sand in each of the subdomains of the near-wellbore region.
(a) Decrease in gas production
(b) Increase in sand concentration
Figure 7.26: Gas production and concentration build-up versus sand production On the other hand, Anbar’s correlations were used to adjust for changes on both permeability and β factor due to volumetric sand concentration build-up. Table 7.9 summarizes the results for the top and bottom layer (formation) whereas Table 7.10 recap numerical results for the frac pack completion case study. The relationship between permeability and β factor versus sand production for each subdomain (formation layers and completion) are shown from Figure 7.31 to 7.33.
67
Table 7.9: Fines Migration Analysis Results (Top/Bottom Layer) m ˙ sand
Bottom layer csand
Top layer
k
β (106
(lbm /s)
(vol/vol, %)
(mD)
0
0.00
300.00
1
1.03
2
csand
ft−1 )
k
β (108
ft−1 )
(vol/vol)
(mD)
7.5100
0.00
5.000
1.0100
299.99
7.5104
1.84
5.000
1.0101
2.07
299.99
7.5109
1.34
5.000
1.0101
3
3.12
299.98
7.5114
7.56
4.999
1.0105
4
4.18
299.97
7.5120
8.36
4.999
1.0106
6
6.32
299.95
7.5131
6.13
4.999
1.0104
10
10.71
299.91
7.5155
8.07
4.999
1.0106
15
16.37
299.86
7.5188
19.43
4.997
1.0114
20
22.20
299.81
7.5223
16.18
4.998
1.0112
According to Table 7.9, permeability decreases an average of 0.02% in both bottom and top layer. Finally, β factor increases an average of 0.06% in both layers, as well. In respect to the frac pack region, Table 7.10 summarizes the simulation results for this case study. Permeability decreased an average of 0.01% and β factor increased 0.02%. Table 7.10: Fines Migration Analysis Results (Frac Pack) m ˙ sand
csand
k
β
(lbm /s)
(vol/vol, %)
(mD)
(ft−1 )
0
0.00
45.00
1,111.41
1
0.25
45.00
1,111.42
2
0.44
45.00
1,111.43
3
0.84
45.00
1,111.46
4
1.20
45.00
1,111.48
6
1.57
45.00
1,111.51
10
2.74
45.00
1,111.59
15
5.11
44.99
1,111.77
20
10.05
44.99
1,112.17
Figure 7.27 illustrates the CFD simulation results for sand particles tracking when m ˙ sand = 1 lbm /s. On one hand, it is evident that the majority of sand grains are mobilized through the bottom layer. On the other hand, fines scarcely move within the top formation layer. Furthermore, Figure 7.27c shows that sand migrates more readily through a preferential pathway than in other sectors of the bottom layer. 68
(a) Isometric view
(b) Cross-sectional view
(c) Map view
Figure 7.27: Sand particle tracking for m ˙ sand = 1 lbm /s after 10 minutes Figure 7.28 shows the normal and cumulative particle distribution for the case m ˙ sand = 1 lbm /s. From the data presented it can be concluded that the size of >95% of the particles that eft the near-wellbore region during the residence time (10 minutes) is 4 ≤ dp ≤ 12 micron (µm). This means that the volumetric sand concentration build-up is mainly due to the fact that it takes longer for the largest particles (dp > 25 µm) to leave the domain.
Figure 7.28: Sand particle diameter distribution inside the frac pack (m ˙ sand = 1 lbm /s) Same situation occurs when m ˙ sand = 10 lbm /s. Figure 7.29c shows that loose sand grains are being mobilized in the bottom layer while very few grain are moving in the top layer. Similarly, as for the previous case, sand particles migrates the reservoir more readily through a preferential path that points directly to the tip of each fracture. Notice that the sand grains flow pattern can be assumed as radial right before the flow reaches the completion/reservoir interface.
69
(a) Isometric view
(b) Cross-sectional view
(c) Map view
Figure 7.29: Sand particle tracking for m ˙ sand = 10 lbm /s after 10 minutes The particle size normal and cumulative probability plot shows that almost 100% of the particles that flow across the near-wellbore region have a particle diameter size of dp ≤ 20 µm (Figure 7.30). As for the previous case, sand concentration build-up can be attributed to the low mobility of the largest sand particles (dp > 25 µm).
Figure 7.30: Sand particle diameter distribution inside the frac pack (m ˙ sand = 10 lbm /s)
70
Figure 7.31: Permeability and β factor versus sand concentration (top layer)
Figure 7.32: Permeability and β factor versus sand concentration (bottom layer)
71
Figure 7.33: Permeability and β factor versus sand concentration (F&P) The correlation permeability versus sand production yielded R2 = 0.8132 corresponding to the linear regression for the top layer, R2 = 0.9899 for the linear regression for the bottom layer, and R2 = 0.9871 for the second-order polynomial regression for the F&P completion. Similarly, the same type of correlation for the β factor yielded R2 = 0.8144, 0.9972, and 0.9880 for the top layer, bottom layer, and frac pack completion, respectively. With respect to erosional effects, Figure 7.34 illustrates the erosional effects on tubing string for the case m ˙ sand = 10 lbm /s. Notice that the location of the erosive damage spots are randomly located throughout the tubing string.
Figure 7.34: Predicted erosion damage in the tubing string (m ˙ sand = 10 lbm /s) 72
Additionally, Figure 7.35 illustrate how fines behave in the perforation tunnel/wellbore interface for the case m ˙ sand = 10 lbm /s. From there, it is clear that a Venturi-type effect speeds up migrating sand grains. When these particles reach the wellbore, a sand jet is formed at the end of the tunnel and flow pattern of grains inside the wellbore is erratic. This kind of behavior could explain the kind of screen damage shown in Figure 1.2b.
Figure 7.35: Detail of sand particles behavior inside the wellbore Sand grains were scaled up five times (5x) in Figure 7.35 in order to make them visible. Finally, Figure 7.36 displays a cross-sectional view of the sand flow pattern inside the bi-wing fracture and wellbore. As explained above, migrating sand grains are accelerated inside perforation tunnels due to the Venturi effect, leading to a very complex fines behavior inside the wellbore, greatly influenced by turbulence effects.
73
Figure 7.36: Detail of sand particles behavior inside the wellbore
74
8
8.1
Summary, Conclusions and Future Work
Summary
Table 8.1 shows the summary of CFD simulation runs made for this research project. Table 8.1: Summary of CFD Simulation Runs Case Studies per
Run(s)
Completion Scheme
8.2
Press. Drawdown
Max. Flowrate
(psi)
(MMSCFD)
Gravel pack (Lp = 0.5 ft)
12
50 ≤ ∆P ≤ 1, 000
4.88
Gravel pack (Lp = 1 ft)
12
50 ≤ ∆P ≤ 1, 000
5.54
Frac pack (F&P)
12
50 ≤ ∆P ≤ 1, 000
8.66
Frac pack (F&P) (Darcy’s law)
12
50 ≤ ∆P ≤ 1, 000
16.81
Sand production and erosion analysis
9
1,000
20 lbm /s (sand)
Conclusions • Coupled geomechanics-hydrodynamics modeling of a compressible fluid flow process inside the near-wellbore region is a very challenging problem that involves nonlinear equations strongly coupled to the real gas equation of state that, in turn, is nonlinear as well. In addition, geometry of the completion scheme increase the overall complexity of the model. • The implementation of a computational fluid dynamics (CFD) approach to solve hydrodynamics and Forchheimer porous media models was successful in such a way that the wellbore could be integrated as an integral part of the near-wellbore model. • The adoption of the Soave-Redlich-Kwong equation of state into the CFD simulations allowing to predict a more realistic gas behavior in the near-wellbore model, especially in those regions of high interest, such as inside perforation tunnels and wellbore. • ANSYS CFX can easily integrate the turbulence-porous media coupled model into the near-wellbore simulation, hence the CFD model is capable of predicting turbulence 75
kinetic energy losses near the completion zone. Also, simulation results show that although some turbulence energy dissipation occurs inside the porous media, more specifically near the gravel pack-wellbore interface, most of the turbulence effects indeed happen inside the wellbore, as expected. • Pressure and velocity contour plots as well as streamlines plot were obtained for each simulation case, allowing to observe the complexity of a three-dimensional flow in the near wellbore region when a realistic completion geometry is considered into the CFD model. • The importance of considering a nonlinear porous media flow over a linear model was made evident, as using Darcy’s law to simulate the model while neglecting inertial effects lead to a overestimation in gas production rates of 96.65%. • Although the geomechanics process of sanding was decoupled to the main hydrodynamic module in the CFD simulation, the sand production modeling allowed to have a sense of how CFD simulations can predict the existence of preferential paths for the migrating sand to flow into the wellbore and the erosive potential this particles possess.
8.3
Future Work • Incorporation of a pressure-dependent viscosity correlation into the CFD model as to predict changes in transport properties as pressure drawdown varies in time. • Simulation of multiphase fluid flow that could include up to four phases: oil, water, gas and sand particles. • Use a more realistic completion geometry that could be pressure-dependent. This can also include implementing different completion configuration, varying perforations phase angles, shot density. In conjunction with this, different types of well settings could be also simulated (slanted, horizontal, side-track wells). • Implementation of a coupled CFD-geomechanics approach that would let the simulator to predict rock failure with changes in the rock strength properties thus releasing sand particles. Even more powerful would be to add a filtration model in which sand particles could build up inside the frac pack. • Simulation of non-isothermal systems where energy-related changes, such as JouleThomson effect due to fluid expansion at the end of perforation tunnels, are accounted for into the CFD model. This would lead to advanced fluid behavior studies in the near wellbore region, such as formation of gas hydrates and wax and asphaltenes deposition. 76
Bibliography [1] Abbott, M., Smith, J., and Van Ness, H. Introduction to Chemical Engineering Thermodynamics. McGraw-Hill, 2001. [2] Anbar, S. Multi-scale Estimation of Inertial Effects for Frac-Pack Completed Gas Reservoirs. PhD thesis, Louisiana State University, December 2014. [3] ANSYS. CFX Solver Theory Guide, Release 15.0. Ansys Inc., Canonsburg, 2014. [4] Ashour, I., Fatemi, A., Vakili-Nezhaad, G., and Al-Rawahi, N. Applications of Equations of State in the Oil and Gas Industry. INTECH Open Access Publisher, 2011. [5] Belhaj, H., Agha, K., Nouri, A., Butt, S., Vaziri, H., Islam, M., et al. Numerical Modeling of Forchheimer’s Equation to Describe Darcy and Non-Darcy Flow in Porous Media. In SPE Asia Pacific Oil and Gas Conference and Exhibition (2003), Society of Petroleum Engineers. [6] Brown, K. E., and Lea, J. F. Nodal Systems Analysis of Oil and Gas Wells. Journal of petroleum technology 37, 10 (1985), 1–751. [7] Carlson, J., Gurley, D., King, G., Price-Smith, C., and Waters, F. Sand Control: Why and How? Oilfield Review 4, 4 (1992), 41–53. [8] Chalmers, F., Katoozi, K., Mokdad, B., J. Tovar, O., Ibukun, and Jimoh, S. Reservoir Permeability Evolution in Sand Producing Wells. In Sand Management Forum, Aberdeen, UK (2014), Society of Petroleum Engineers - UK. [9] Chryssakis, C., and Assanis, D. A Secondary Atomization Model for Liquid Droplet Deformation and Breakup Under High Weber Number Conditions. In ILASS Americas, 18th Annual Conference on Liquid Atomization and Spray Systems, Irvine, CA (2005).
77
[10] Chung, T. H., Ajlan, M., Lee, L. L., and Starling, K. E. Generalized Multiparameter Correlation for Nonpolar and Polar Fluid Transport Properties. Industrial & Engineering Chemistry Fundamentals 27, 4 (1988), 671–679. [11] Chung, T. H., Lee, L. L., and Starling, K. E. Applications of Kinetic Gas Theories and Multiparameter Correlation for Prediction of Dilute Gas Viscosity and Thermal Conductivity. Industrial & Engineering Chemistry Fundamentals 23, 1 (1984), 8–13. [12] Darcy, H. Les fontaines publiques de la ville de Dijon, Victor Dalmont, Paris. The Flow of Homogeneous Fluids Through Porous Media (1856). [13] Dranchuk, P., and Kolada, L. Steady Linear Gas Flow through Porous Media. ¨ nung, B. Eulerian and Lagrangian Pre[14] Durst, F., Miloievic, D., and Scho dictions of Particulate Two-Phase Flows: A Numerical Study. Applied Mathematical Modelling 8, 2 (1984), 101 – 115. [15] Economides, M. J., Nolte, K. G., and Ahmed, U. Reservoir Stimulation, vol. 18. Wiley Chichester, 2000. [16] Ergun, S., and Orning, A. A. Fluid Flow through Randomly Packed Columns and Fluidized Beds. Industrial & Engineering Chemistry 41, 6 (1949), 1179–1184. [17] Ertekin, T., Abou-Kassem, J. H., and King, G. R. Basic Applied Reservoir Simulation. Society of Petroleum Engineers Richardson, TX, 2001. [18] Finnemore, J. E., and Franzini, J. B. Fluid Mechanics. McGraw-Hill, 2002. [19] Finnie, I., and McFadden, D. On the Velocity Dependence of the Erosion of Ductile Metals by Solid Particles at Low Angles of Incidence. Wear 48, 1 (1978), 181–190. [20] Flores, J., Dranchuk, P., et al. Non-Darcy Transient Radial Gas Flow Through Porous Media. In Annual Technical Meeting (1980), Petroleum Society of Canada. [21] Forchheimer, P. Wasserbewegung durch boden. Z. Ver. Deutsch. Ing 45, 1782 (1901), 1788. [22] Furui, K. A Comprehensive Skin Factor Model for Well Completions Based on Finite Element Simulations. PhD thesis, University of Texas at Austin, May 2004.
78
[23] Garrouch, A., and Ali, L. Predicting the Onset of Inertial Effects in Sandstone Rocks. Transport in Porous Media 44, 3 (2001), 487–505. [24] Geertsma, J. Estimating the Coefficient of Inertial Resistance in Fluid Flow Through Porous Media. SPE Journal 14, 5 (1974), 445–450. [25] Geertsma, J., and De Klerk, F. Rapid Method of Predicting Width and Extent of Hydraulically Induced Fractures. Journal of Petroleum Technology (United States) 21 (1969). [26] Gilbert, W. Flowing and Gas-Lift Well Performance. In Drilling and production practice (1954), American Petroleum Institute. [27] Gouesbet, G., and Berlemont, A. Eulerian and Lagrangian Approaches for Predicting the Behaviour of Discrete Particles in Turbulent Flows. Progress in Energy and Combustion Science 25, 2 (1999), 133 – 159. [28] Greene, W. R. Analyzing the Performance of Gas Wells. Journal of Petroleum Technology 35, 07 (1983), 1–378. [29] Hirschfelder, J. O., Curtiss, C. F., Bird, R. B., and Mayer, M. G. Molecular Theory of Gases and Liquids, vol. 26. Wiley New York, 1954. [30] Huang, H., Ayoub, J., et al. Applicability of the Forchheimer Equation for Non-Darcy Flow in Porous Media. SPE Journal 13, 1 (2008), 112. [31] Jambhekar, V. A. Forchheimer Porous-Media Flow Models – Numerical Investigation and Comparison with Experimental Data. Master’s thesis, University of Stuttgart, 2011. [32] Karimi-Fard, M., Durlofsky, L. J., et al. Detailed Near-Well DarcyForchheimer Flow Modeling and Upscaling on Unstructured 3D Grids. In SPE Reservoir Simulation Symposium (2009), Society of Petroleum Engineers. [33] Khaniaminjan, A., and Goudarzi, A. Non-Darcy Fluid Flow through Porous Media. SPE 114019 (2008), 1–19. [34] King, G. E. Sand Control Methods. http://gekengineering.com/Downloads/ Free_Downloads/Sand_Control_Overview.pdf. (Visited on 04/22/2015). [35] Lee, A. L., Gonzalez, M. H., Eakin, B. E., et al. The Viscosity of Natural Gases. Journal of Petroleum Technology 18, 8 (1966), 997–1000. 79
[36] Lolon, E., Chipperfield, S., McVay, D., Schubarth, S., et al. The Significance of Non-Darcy and Multiphase Flow Effects in High-Rate, Frac-Pack Gas Completions. In SPE Annual Technical Conference and Exhibition (2004), Society of Petroleum Engineers. [37] Mach, J., Proano, E., and Brown, K. E. A Nodal Approach for Applying Systems Analysis to the Flowing and Artificial Lift Oil or Gas Well. [38] Mashayek, F., and Pandya, R. Analytical Description of Particle/Droplet-Laden Turbulent Flows. Progress in Energy and Combustion Science 29, 4 (2003), 329 – 378. ˘ ´, D., Cike ˘ [39] Matanovic s, M., and Moslavac, B. Sand Control in Well Construction and Operation. Springer Science & Business Media, 2012. [40] Mehta, D., and Hawley, M. Wall Effect in Packed Columns. Industrial & Engineering Chemistry Process Design and Development 8, 2 (1969), 280–282. [41] Melo, A. R. d., de Oliveira, T. J. L., et al. CFD as a Tool For Pumping Strategy Evaluation On Matrix Acidizing Treatments. In SPE European Formation Damage Conference & Exhibition (2013), Society of Petroleum Engineers. [42] Menter, F. R. Two-Equation Eddy-Viscosity Turbulence Models for Engineering Applications. AIAA journal 32, 8 (1994), 1598–1605. [43] Minier, J.-P., and Peirano, E. The PDF Approach to Turbulent Polydispersed Two-Phase Flows. Physics Reports 352, 1–3 (2001), 1 – 214. [44] Mokhatab, S., and Poe, W. A. Handbook of Natural Gas Transmission and Processing. Gulf Professional Publishing, 2012. [45] Morita, N., Whitfill, D., Massie, I., Knudsen, T., et al. Realistic SandProduction Prediction: Numerical Approach. SPE Production Engineering 4, 01 (1989), 15–24. [46] Nakayama, Y., and Boucher, R. Introduction to Fluid Mechanics (ButterworthHeineman Edition). Elsevier, 2000. [47] Nasri, Z., and Binous, H. Applications of the Soave–Redlich–Kwong Equation of State Using Mathematica®. Journal of Chemical Engineering of Japan 40, 6 (2007), 534–538.
80
[48] Nordgren, R., et al. Propagation of a Vertical Hydraulic Fracture. Society of Petroleum Engineers Journal 12, 04 (1972), 306–314. [49] Paggiaro, R., Friedemann, J. D., Gharaibah, E., Zhang, Y., et al. Prediction of Sand Erosion in Choke Valves-CFD model Development and Validation against Experiment. In OTC Brasil (2013), Offshore Technology Conference. [50] Peng, D.-Y., and Robinson, D. B. A New Two-Constant Equation of State. Industrial & Engineering Chemistry Fundamentals 15, 1 (1976), 59–64. [51] Peri, S., Rogers, B. M., et al. Computational fluid dynamics (cfd) erosion study. In SPE Annual Technical Conference and Exhibition (2007), Society of Petroleum Engineers. [52] Perkins, T., Kern, L., et al. Widths of Hydraulic Fractures. Journal of Petroleum Technology 13, 09 (1961), 937–949. [53] Pitzer, K. S. Origin of the Acentric Factor. Tech. rep., California Univ., Berkeley (USA). Lawrence Berkeley Lab., 1977. [54] Poling, B. E., Prausnitz, J. M., and O’connell, J. P. The Properties of Gases and Liquids, vol. 5. McGraw-Hill New York, 2001. [55] Prausnitz, J. M., Lichtenthaler, R. N., and de Azevedo, E. G. Molecular Thermodynamics of Fluid-Phase Equilibria. Pearson Education, 1998. [56] Ranade, V. V. Computational Flow Modeling for Chemical Reactor Engineering, vol. 5. Academic Press, 2001. [57] Redlich, O., and Kwong, J. On the Thermodynamics of Solutions. V. An Equation of State. Fugacities of Gaseous Solutions. Chemical Reviews 44, 1 (1949), 233–244. [58] Reynolds, O., Brightmore, A. W., and Moorby, W. H. Papers on Mechanical and Physical Subjects: 1869-1882, vol. 1. The University Press, 1900. [59] Salama, M. M. Sand Production Management. Journal of energy resources technology 122, 1 (2000), 29–33. ˇ [60] Savli, M. Turbulence Kinetic Energy-TKE. Tech. rep., University of Ljubljana, 2012. [61] Soave, G. Equilibrium Constants from a Modified Redlich-Kwong Equation of State. Chemical Engineering Science 27, 6 (1972), 1197–1203. 81
[62] Souza, G., Zacchi, A., Barretto, A., and Pires, A. P. Analysis of the Effect of Different Forchheimer’s Beta Correlations in the Results of Numerical Simulation of Gas Flow in Naturally Fractured Reservoir. In Paper SPE 139175 presented at the SPE Latin American & Caribbean Petroleum Enginnering Conference held in Lima, Peru (2010), pp. 1–3. [63] Stadalman, J., Novotny, R., and Houchin, L. Understanding Changing Wellbore Pressures Improves Sand Control Longevity. In SPE Annual Technical Conference and Exhibition (1985), Society of Petroleum Engineers. [64] Subramani, H. J., Rhyne, L. D., and Vedapuri, D. Sand Fines Erosion and Asset Integrity Management. In Offshore Technology Conference Asia (March 2014), Offshore Technology Conference. [65] Suri, A., and Sharma, M. M. A Model for Water Injection Into Frac-Packed Wells. SPE Reservoir Evaluation & Engineering 13, 03 (2010), 449–464. [66] Sutherland, W. LII. the Viscosity of Gases and Molecular Force. The London, Edinburgh, and Dublin Philosophical Magazine and Journal of Science 36, 223 (1893), 507–531. [67] Valsecchi, P., McDuff, D., Chang, D.-L., Huang, H., and Burdette, J. Simulation and Visualization of Near-Well Flow. In SPE International Production and Operations Conference and Exhibition, Doha, Qatar (May 2012), SPE, Inc. [68] Wang, J., Wan, R., Settari, A., and Walters, D. Prediction of Volumetric Sand production and Wellbore Stability Analysis of a Well at Different Completion Schemes. arma/usrms 05-842. In Proc. 40th Symposium on Rock Mechanics (USRMS): Rock Mechanics for Energy, Mineral and Infrastructure Development in the Northern Regions. Anchorage, Alaska, USA (2005), p. 12. [69] Wei, Y. S., and Sadus, R. J. Equations of State for the Calculation of Fluid-Phase Equilibria. AIChE Journal 46, 1 (2000), 169–196. [70] Whitaker, S. Flow in Porous Media i: A Theoretical Derivation of Darcy’s Law. Transport in Porous Media 1, 1 (1986), 3–25. [71] Wilcox, D. A Two-Equation Turbulence Model for Wall-Bounded and Free-Shear Flows. In 1993 AIAA 24 th Fluid Dynamics Conference (1993).
82
´ , P., and Russell, J. Effect of Rock Strength Criterion on the [72] Yi, X., Valko Predicted Onset of Sand Production. International Journal of Geomechanics 5, 1 (2005), 66–73. [73] Zeng, F., Zhao, G., et al. Semianalytical Model for Reservoirs with Forchheimer’s Non-Darcy Flow. SPE Reservoir Evaluation & Engineering 11, 02 (2008), 280–291. [74] Zeng, Z., and Grigg, R. A Criterion for Non-Darcy Flow in Porous Media. Transport in Porous Media 63, 1 (2006), 57–69.
83
Vita Oscar Mauricio Molina Ortiz was born in Barrancabermeja, Colombia (1984). He obtained his Bachelor of Science degree in Mechanical Engineering in 2007 from Universidad Pontificia Bolivariana (Colombia) and since then he has been actively involved with the oil and gas industry, where he joined diverse engineering-level positions as maintenance/production engineer, process engineer, as well as drilling fluids engineer. In fall 2013, Oscar accepted a research assistantship position from the Craft and Hawkins Department of Petroleum Engineering ins Louisiana State University where, after four semesters, he obtained his Master of Science degree in Petroleum Engineering.
84