REVIEW ARTICLES
Computational fluid dynamics modelling of solid suspension in stirred tanks Madhavi V. Sardeshpande and Vivek V. Ranade* Industrial Flow Modeling Group, Chemical Engineering and Process Development Division, National Chemical Laboratory, Pune 411 008, India
Solid suspension and mixing are crucial in many important processes, including multiphase catalytic reactions, crystallization, precipitation, etc. In recent years, various efforts have been made to numerically simulate solid–liquid flows in stirred vessels using computational fluid dynamics (CFD). In this article, we present a brief account of our group’s efforts at developing and using CFD models for simulating solid suspension in stirred tanks. Computational models were developed and evaluated by comparing model predictions with our data as well as published experimental data. A variety of experimental techniques ranging from torque and wall pressure fluctuations to ultrasound velocity profiler were used. Efforts were made to develop appropriate sub-models for capturing influence of the prevailing turbulence and solid volume fraction on effective inter-phase coupling terms. A hysteresis in variation of the height of the cloud of suspended solid with impeller rotational speed was observed. The hysteresis, besides having applications in realizing better suspension at lower effective power consumption, also offers an attractive evaluation test for CFD models. A new way to carry out dynamic settling of solid cloud by sudden impeller stoppage has been developed. The approach, models and results presented here will be useful for extending applications of CFD models for simulating industrial stirred slurry reactors as well as further research in the field. Keywords: Computational fluid dynamics, hysteresis, solid suspension, stirred tanks. SOLID suspension and mixing are crucial in many important processes, including multiphase catalytic reactions, crystallization, precipitation, leaching, dissolution, coagulation and water treatment. Stirred tanks are frequently used for these purposes in chemical, biochemical and mineral processing industries, because of their ability to provide excellent mixing and contact between the solid and liquid phases. Apart from providing a good suspension of solid, stirred vessels also offer excellent heat and mass transfer. Despite their widespread use, the design and operation of these tanks to ensure the desired quality of suspension has remained a challenging problem over the past decades. Suspension quality depends upon com*For correspondence. (e-mail:
[email protected]) CURRENT SCIENCE, VOL. 102, NO. 11, 10 JUNE 2012
plex interactions of impeller-generated flow, turbulence and solid loading. Conventionally, solid suspension in stirred reactors is characterized by impeller speed required for just off-bottom suspension. An important consideration in the design and operation of slurry reactors is the determination of the states of the solid suspension, at which point no particles reside on the vessel bottom for a long time. Such a determination is critical to enhance the performance of the reactor, because until such a condition is achieved, the catalyst is not effectively utilized. Clearly, it is important to understand these processes and the effect of hydrodynamics on them while designing such reactors. The design of stirred tanks requires the knowledge of the flow field (like velocity, turbulence intensity, hold-up, distribution of the dispersed phase, etc.) and the understanding of the effects of various system parameters like impeller type, power input, number of baffles, etc. on the desired process result. Over the past few decades, solid–liquid flows in stirred vessels have been studied using numerical simulations based on computational fluid dynamics (CFD) framework. Dispersed solid–liquid flows can be modelled using either the Eulerian–Eulerian approach or the Eulerian–Lagrangian approach. The former approach uses the concept of interpenetrating continua to formulate continuity and momentum balances for each phase separately1–5. Although CFD provides a platform that can be used to obtain significant insights into complex multiphase flow problems, it is necessary to validate the model predictions extensively with experimental data before they can be confidently used for the design and optimization of industrial reactors. The experimental studies reported in the literature mostly consist of axial measurement of concentration profiles in the vessel6–10, and ignore the radial gradients that exist in the reactor. As a result, the majority of CFD studies for solid–liquid stirred tanks are either devoted to the improved prediction of axial solid concentration profiles1,4,10,11–13, or are focused on the prediction of particle suspension height in a stirred vessel3. The predictions for the solid flow and distribution in the tank have not been extensively evaluated yet. Such evaluations are necessary to facilitate further improvements and applications of CFD models for the design and scale-up of solid–liquid stirred tank reactors. Overall, studies on solid suspension in stirred tanks can be schematically shown, as in Figure 1. 1539
REVIEW ARTICLES
Figure 1.
Studies of solid suspension in stirred tanks.
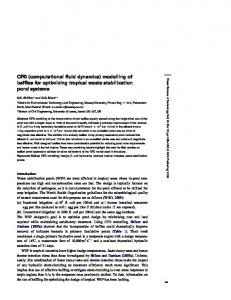
stirred tanks and the evaluation of these models with some conventional and a couple of new approaches. The current status of CFD models and their ability to simulate suspension quality, effective drag coefficient and liquid phase mixing are briefly discussed. Comparison of simulated results with new experiments such as hysteresis in cloud height and settling of solid at sudden ‘impellerstoppage’ is then presented followed by a summary. Figure 2. States of solid suspension. a, Partial suspension. b, Complete suspensions. c, Uniform suspension.
Critical analysis of the reported literature shows that there is significant uncertainty in the estimation of the inter-phase drag force on the solid particles in a turbulent fluid. The inter-phase drag force was found to affect the suspension of solid particles. Several correlations relating the inter-phase drag force with the solid volume fraction and the prevailing turbulence are available4,14–17. However adequate guidelines to select appropriate models of inter-phase drag force for the simulation of solid–liquid flows in the stirred reactors are not available. Therefore, it is essential to carry out development of CFD models for solid–liquid flows in stirred vessels and evaluate the model predictions by comparing with reliable experimental data. This article summarizes the work done by our group in recent years on the modelling of solid suspension in 1540
Suspension quality The process of solid suspension can be broadly divided into three regimes, i.e. on-bottom suspension regime, offbottom suspension regime (complete suspension) and homogeneous (uniform) suspension regime18, as shown in Figure 2. Complete suspension impeller speed (Njs) is the speed at which all particles are lifted up from bottom of the vessel such that particles do not spend more than 1–2 s at the bottom of the vessel19. Though the concept of Njs was introduced 60 years ago19, it is still used as a primary design parameter. Numerous correlations on ‘justsuspended’ speed for different operating and design conditions have been published20–22. These are all similar to the Zwietering correlation, except for variations in the exponents of different terms. From a physical standpoint, the state of suspension of solid particles in the reactor is completely governed by the hydrodynamics and turbulence prevailing in the reactor. The interaction of the CURRENT SCIENCE, VOL. 102, NO. 11, 10 JUNE 2012
REVIEW ARTICLES
Figure 3.
Figure 4.
Pictorial view of solid suspension.
Suspension quality with respect to impeller speed24.
particles with the liquid flow field and also the interactions with other particles (significant for dense systems) determine the motion of solid particles within the reactor. Sardeshpande et al.23 focused on developing correlations for ‘just-suspension speed’ and carried out systematic experimental study to characterize solid hydrodynamics in slurry reactors using various experimental techniques. Similarly, in a solid–liquid system, one can visually observe an interface that distinguishes two regions in the vessel: a region containing suspended solid (cloud region) and a clear liquid region, once the quasi steady state is achieved. At a particular impeller rotation, solid get lifted to maximum height within the fluid forming an interface between suspended solid and clear liquid. The height of this interface from the tank bottom is called the ‘cloud height’. This interface (i.e. cloud height) depends on the existing fluid and particle characteristics, vessel and impeller configuration and impeller speed. A pictorial view of cloud height in a stirred vessel is given in Figure 3. It is well known that the prevailing suspension quality controls the liquid-phase mixing in the reactor. Therefore, CURRENT SCIENCE, VOL. 102, NO. 11, 10 JUNE 2012
it becomes essential to first adequately predict the quality of the suspension for different impeller rotational speeds. Different criteria are available to characterize the suspension quality in the reactor. Kasat et al.24 used two criteria: one based on the standard deviation of the solid concentration (calculated using eq. (1)) and the other based on the cloud height to qualitatively quantify the suspension quality (Figure 4).
σ=
1 n
2
⎛ C ⎞ − 1⎟ . ⎜ ⎜C ⎟ ⎠ i =1 ⎝ avg n
∑
(1)
For uniform (homogeneous) suspensions, the value of the standard deviation is found to be smaller than 0.2 (σ < 0.2). However, for the ‘just-suspension condition’ the value of the standard deviation lies between 0.2 and 0.8 (0.2 < σ < 0.8), and for an incomplete suspension, σ > 0.8. Measurement of height of cloud within the stirred vessel provides qualitative indication of suspension quality. 1541
REVIEW ARTICLES
Figure 5.
States of solid suspension by Takenaka et al.28.
The literature provides extensive data on cloud height measurements25–28. Bittorf and Kresta29 developed a correlation for estimating cloud heights. Kraume25 observed that if cloud height reached up to 90% of tank height (which is equal to the tank diameter), the corresponding impeller speed will be the same as that required for just suspension speed, Njs. Kasat et al.24 compared suspension quality using standard deviation and cloud height (Figure 4) and their results agreed with Kraume’s criteria for justsuspension speed. Some discrepancies were observed in previously reported studies regarding cloud height. For example, Hicks et al.26 showed monotonic behaviour of increasing cloud height with increasing impeller speed. However, Bujalski et al.27 and Takenaka et al.28 observed five stages of solid suspension: (i) At lower impeller speed, small amounts of particles are lifted up and distributed throughout the vessel. (ii) With an increase in the stirring speed, an interface appears between the suspension and clear liquid layer in the upper portion of the vessel. (iii) The height of the interface reduces with stirring speed. (iv) Further increase in stirring speed resulted in an increase in the height of the interface and a decrease in the size of the upper clear layer. (v) The interface between the cloud and clear liquid layer disappears. The solid become fully suspended, i.e. Njs is achieved, typically at stage (iv), as shown in Figure 5. Our group’s work on the influence of impeller speed on cloud height is discussed in the next section.
Effective drag coefficient for solid particles in stirred tank During the last two decades, many studies have reported CFD simulations (single as well as multiphase) of flow field in a stirred reactor (see, for example, references cited in Chapter 10 of Ranade30). CFD models were shown to be successful in simulating single-phase flow generated by impeller(s) of any shape in complex reactors30. Several attempts have also been made to simulate the solid–liquid flows in stirred reactors (see for example, refs 4, 11 and 31). These efforts on developing CFD models of solid–liquid flows in a stirred tank mainly dif1542
fer from each other with respect to how the model treats impeller rotation, multiphase turbulence and effective drag coefficient, with the last parameter being the most crucial. Experimental measurements14,15 have demonstrated that the prevailing bulk turbulence modifies the particle drag coefficient to a substantial extent. In stirred tanks, prevailing turbulence levels are controlled by impeller rotation and therefore demand different correlations of effective drag coefficient than solid–liquid flows without an external turbulence controlling agency. Brucato et al.15 have developed a correlation for estimating effective drag coefficient based on the experimental data collected using the Taylor–Coutte-type apparatus. They attempted to correlate the ratio of effective drag coefficient in the presence of turbulence to effective drag coefficient of a single particle settling in a quiescent liquid with the ratio of particle diameter to Kolmogorov length scale of turbulence. The idea was reasonably successful and several correlations based on this were developed (see Appendix 1 for a list of representative correlations). Khopkar et al.4 developed a computational meso-scale model of flow over assembly of suspended particles with externally adjustable prevailing turbulence levels. They have carried out simulations based on a ‘unit cell’ concept shown schematically in Figure 6. Their simulations clearly indicate that the effective drag coefficient depends on a ratio of particle diameter to the Kolomogorov length scale. The simulated values of effective drag coefficient were reasonably described by the functional form of a correlation proposed by Brucato et al.15, albeit with a different proportionality constant (see Appendix 1). We carried out several steady-state simulations based on the effective drag coefficient developed from the ‘unit cell’ approach and observed reasonable agreement between simulated and published experimental results over a wide range of key parameters such as impeller types, particle diameter, particle loading and size of the stirred tank. The turbulent dispersion of dispersed/ suspended phase was modelled using the turbulent diffusivity, D12 (see eq. (1) in Appendix 1). It should be noted that the contribution of turbulent dispersion force is CURRENT SCIENCE, VOL. 102, NO. 11, 10 JUNE 2012
REVIEW ARTICLES
π l= dp
εs
4
d 2p
εs Diameter of cylindrical object Solid hold-up
Grid details: Total grid 199,809 x×y 447 × 447
Figure 6.
Figure 7.
Unit cell approach developed by Khopkar et al.4.
Comparative study of drag correlations using RT and PBTD by Khopkar et al.4.
significant only when the size of turbulent eddies is larger than the particle size. In the case of a solid–liquid stirred reactor, even for the laboratory scale, the ratio of the largest energy containing eddy (in mm) and the particle size was found to be around 10. Therefore, the contribution of the turbulent dispersion is likely to be significant. The previously reported numerical studies have also highlighted the importance of the modelling of turbulent dispersion force while simulating solid suspension in a stirred CURRENT SCIENCE, VOL. 102, NO. 11, 10 JUNE 2012
reactor32–34. Considering these results, the turbulent dispersion of the dispersed phase was considered in the present study. Also, the default value of the dispersion Prandtl number, 0.75, has been used here (the model equations used for these simulations are listed in Appendix 1). A sample of the comparisons of simulated results with the experimental data of Yamazaki et al.6, and GodFrey and Zhu9 was presented by Khopkar et al.4, as shown in Figure 7. It can be seen that the developed 1543
REVIEW ARTICLES Grid details: r×θ×z
: 57 × 93 × 57
Impeller blade : 14 × 1 × 14 Inner region
Figure 8.
Figure 9.
Computational grid and solution domain24.
Mixing time at various locations in solution domain24.
computational model describes the experimental data adequately.
Liquid-phase mixing It is important to understand liquid-phase mixing in the presence of solid suspension. Kasat et al.24 developed a comprehensive CFD model to gain insight into solid suspension and its implications on the liquid-phase mixing process in a solid–liquid stirred reactor. They used the approach proposed by Khopkar et al.4 to simulate the turbulent solid–liquid flows in a stirred reactor. The model predictions were compared with the experimental data of axial solid concentration profile reported by Yamazaki et al.6. The validated model was further extended to simulate the liquid-phase mixing. Completely converged flow results were used for simulating the liquid-phase mixing, assuming that the addition of tracer does not influence the fluid dynamics in the stirred reactor. The ‘mixing time’ is defined as the time required to achieve the specified degree of homogeneity from the time at which the tracer 1544
: 8 ≤ k ≤ 47 j ≤ 39
is added to the reactor. The species transport equation was solved till the desired mixing was achieved. The results indicated that adequate care needs to be taken to ensure that the simulated results are not sensitive to the time-step used. Typically low time-step of about 0.001 s needs to be used with an adequate number of internal iterations per time-step to ensure acceptable convergence at each time-step (~20 internal iterations per time-step). The tracer history recorded at different locations distributed over the reactor (Figure 8) was used to estimate mixing time for a specified degree of homogeneity. The maximum value of the mixing time obtained from all the right different locations was considered as the effective mixing time of the system. The simulated results indicated that mixing time values estimated from locations above the cloud and within the solid cloud showed significant difference. The simulated variation in mixing time values at four locations (1, 3, 5 and 6) – two are in the fastest mixing region (near the impeller discharge stream) and two are in slowest mixing region (near top surface) – for all the operating conditions is shown in Figure 9. The mixing time increases with increase in the impeller rotational speed, reaches a maximum and then drops gradually with further increase in the impeller rotational speed till the just off-bottom suspension condition is reached. The mixing time was then found to remain constant till the system approaches a complete suspension condition and then the mixing time slowly reduced with further increase in the impeller rotational speed. The computational model has predicted maxima in the mixing time at one-third of the complete suspension speed of the impeller. The maximum mixing time was found to be almost 10 times the minimum value of the mixing time obtained at N = 40 rps. It can be seen from Figure 9 that the difference between the predicted values of mixing time near the impeller discharge stream and near the top surface is dependent on the overall suspension quality in the reactor. It was observed that for incomplete as well as for just off-bottom suspension CURRENT SCIENCE, VOL. 102, NO. 11, 10 JUNE 2012
REVIEW ARTICLES regimes, the mixing time values in clear liquid layer were significantly higher (2–2.5 times) than those in the slurry region (within the cloud of suspended solid). However, the difference between the mixing time values of all the four locations decreased after the start of the complete suspension regime. The delayed mixing occurring in the top clear liquid is responsible for the significantly larger mixing time observed. The presence of very low liquid velocities in the top clear liquid layer is responsible for the delayed mixing. It will be useful to briefly comment on the influence of impeller shape and location on liquid-phase mixing. These aspects have been extensively studied earlier23,35. These, and many other studies, clearly indicate that the liquid-phase mixing time is essentially determined by the mean flow generated by the impeller. Therefore, the dimensionless mixing time can be estimated as: Nθ mix ∝
3
1 ⎛T ⎞ ⎜ ⎟ , NQ ⎝ D ⎠
where N is the impeller speed (rps), NQ the pumping number of the impeller, θmix the mixing time, T the vessel diameter and D is the impeller diameter. Pumping numbers of many of the commonly used impellers like Rushton turbine, pitched-blade turbine and hydrofoils are not very different from each other and therefore dimensionless mixing time for these impellers is more or less the same (though power consumption will be significantly different).
Hysteresis in cloud height The results discussed so far essentially use steady state experimental data and simulations for understanding solid suspension. Recently, Sardeshpande et al.36 explored the possible use of unsteady experiments and simulations for better understanding of solid–liquid flow in stirred tanks and for evaluation of CFD models. Experiments were conducted to visualize cloud height inside the stirred vessel, similar to those used by Takenaka et al.28. Cloud height depends on fluid and particle characteristics, vessel and impeller configuration, and impeller speed. At impeller speed of 150 rpm, it was observed that large amounts of solid particles settled at the bottom of the vessel. Only a small fraction of solid particles was suspended in the liquid. The effective suspended solid loading was, therefore, quite low, and solid were suspended up to higher levels resulting in higher cloud height (high axial gradient in solid hold-up). When impeller speed increased to 220–350 rpm, flow stream from the impeller impinged on the settled solid bed leading to the suspension of more solid particles. This resulted in the suspension of higher solid volume fraction from the CURRENT SCIENCE, VOL. 102, NO. 11, 10 JUNE 2012
bottom of the vessel affecting effective slurry density and flow near the impeller and lower cloud height than that observed at 150 rpm. With further increase in the impeller speed beyond 220 rpm, the bed region below the impeller which reduces the strength of impeller flow stream vanished, leading to unrestricted flow resulting in higher cloud height. At 445 rpm, most of solid were more or less uniformly suspended. Therefore, further increase in impeller speed does not affect the cloud height. Thus, the non-monotonic cloud height behaviour reported by Sardeshpande et al.36 was in agreement with that of Takenaka et al.28 for impeller PBTD-6. With this background, hysteresis in cloud height was studied. Preliminary visual observations of cloud height indicated that if different paths are followed in the operating conditions, such as increase in the impeller speed from lower to higher rpm, and vice versa then there is a possibility of ‘hysteresis’ in cloud height (Figure 10). At higher solid loadings, more energy is required to suspend particles from the bottom of a vessel and to keep them in suspended condition, compared to the energy required to prevent the already suspended particles from settling. Typical experimentally observed hysteresis in cloud height is shown in Figure 11 a. It is clear from the data that the observed cloud height at a specific impeller speed is different when it is reached by either increasing or decreasing the impeller speed. The observed ‘hysteresis’ in cloud height was dependant on impeller type, speed and solid loading. The hysteresis was observed because of differences in slurry density near the impeller and the formation of recirculation zones while increasing or decreasing the impeller speed. The observed differences in cloud height may be due to the unsteady nature of solid suspension. To ensure that the observed hysteresis is not just a transient effect, experiments were carried out for a amount of substantial time. The time history of cloud height measurements is shown in Figure 11 b. It was observed that with changes in operating conditions, there was a difference in the cloud height for the same impeller speed even after 30 min.
Figure 10.
Cloud height using two different paths.
1545
REVIEW ARTICLES
Figure 11.
Figure 12.
a, Hysteresis in cloud height with PBTD-6 at 7% v/v. b, Cloud height behaviour at different timescales.
Contour plots of cloud height. a, Two initial conditions. b, Five radial planes from impeller to wall.
Efforts were made to capture the observed hysteresis in cloud height using the developed CFD models. Simulations were carried out at four different impeller speeds (220, 275, 350 and 450 rpm). For each impeller speed, single-phase simulations were carried out and steadystate convergence was achieved, where complete development of axial flow pattern was observed. Simulations were then carried out with two different initial conditions: one with completely suspended solid by patching mean solid volume fraction in the solution domain (i.e. uniform patching) and the second with specified solid corresponding to the mean solid volume fraction as settled on the bed with maximum packing volume fraction (i.e. bottom patching). This was done by adopting two different approaches, and steady state and unsteady state simulations were carried out using drag correlations of 1546
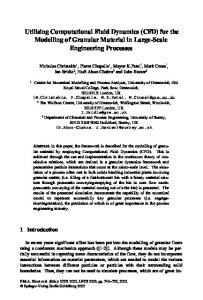
Brucato et al.15 and Khopkar et al.4. The contour plots of solid volume fractions with two initial conditions using the correlation of Brucato et al.15 are shown in Figure 12. Funnelling of solid explained the different axial and radial levels, i.e. uneven solid distribution inside the vessel. Therefore, an attempt was made here to adopt circumferential axial averages of solid volume fraction at five different radial locations (Figure 12). Different levels of solid volume fractions at five radial locations were observed. Averaged values of solid volume fraction from solid-rich region to clear liquid region helped quantify cloud height. A comparative study showed that the correlation of Brucato et al.15 was overpredicting the results, whereas that of Khopkar et al.4 predicted experimental data of hysteresis for PBTD-6 reasonably well, as shown in Figure 13. CURRENT SCIENCE, VOL. 102, NO. 11, 10 JUNE 2012
REVIEW ARTICLES Impeller location plays an important role in cloud height as well as hysteresis in cloud height. Generally lower impeller clearance (from the bottom) results in a better distribution of solid. Numerous data and reports on the influence of impeller location on solid suspension are available on cloud height26,27,37,38. These results are not discussed here for the sake of brevity and the cited papers may be referred for more information.
Dynamic settling of a cloud of particles at ‘sudden impeller’ stoppage
Figure 13. Prediction of hysteresis in cloud height using the correlation of Khopkar et al.4.
Figure 14. particles.
Schematic view for the dynamic settling of a cloud of
Figure 15.
Sample plot of solid settling time using PBTD-6.
CURRENT SCIENCE, VOL. 102, NO. 11, 10 JUNE 2012
Dynamic settling experiments were carried out by suddenly stopping the impeller when the particles were in suspended condition. The settling of the suspended cloud of particles was then monitored. The effective settling velocity of the cloud particles can provide useful information about the solid suspension in stirred tanks. The schematic of the experimental set-up is shown in Figure 14. Dynamic settling of suspended solid was characterized by using a high-speed camera. The height of solid bed being accumulated on the side wall of the vessel due to settling was recorded at a speed of 30 frames/s for a duration of 60 s (with the camera at a fixed position). A black-coloured cloth was used as a background and illumination (using halogen lamp) was arranged from the front. For every experiment, the impeller was rotated at a specific speed for at least 10 min to ensure that a quasisteady state of solid suspension corresponding to that impeller speed is achieved. The impeller speed was varied in the 220–445 rpm range. After achieving the quasisteady state of solid suspension, the power to the impeller was abruptly switched-off. It was observed that the impeller stopped completely within 1 s after switching-off the power. Images of settled bed and the bed height were recorded at the vessel wall. It should be noted that the bed settled at the vessel bottom is radially non-uniform. The bed height at the vessel wall may therefore change with impeller speed, even for the same volume fraction of solid in the vessel. Despite a non-uniform bed, the experimental methodology used in this study is adequately accurate for identifying solid settling time (since it depends on the temporal profile of the bed height at the vessel wall and not on its absolute value). Reproducibility of settling of the cloud of particles was verified by repeating all experiments at least three times. A sample plot of determination of settling time of the cloud of particles is shown in Figure 15. These settling experiments were simulated using the CFD models. The results obtained for solid volume fraction of 7% v/v and particle size of 250 μm in the impeller speed range 220–445 rpm are discussed below. After the converged pseudo-steady state simulation of solid suspension in stirred tanks, the impeller rotational 1547
REVIEW ARTICLES
Figure 16.
a, Transient simulations of settling of cloud at 350 rpm. b, Settling time at 350 rpm and 445 rpm.
Figure 17. Comparative study of settling velocity of cloud experiments and CFD modelling.
speed was suddenly set to zero to simulate sudden switchoff of the impeller. In reality, the impeller takes about 1 s to stop rotating. In order to simulate this, the impeller speed was linearly decreased from the initial value to zero within 1 s and thereafter kept at ‘no rotation’ condition. The simulated results for these two different ways of capturing the sudden switching off of the impeller did not show significant differences. Subsequent simulations were therefore carried out by suddenly setting the impeller rotational speed as zero. Unsteady-state simulations were carried out after setting this condition and a volumeweighted average of key parameters, including mean velocity of water, mean velocity of solid particles and turbulent dissipation rate were monitored/recorded as a function of time after the sudden switching off. A sample of the results is shown in Figure 16. It should be noted that when the impeller is not switched-off, flow in the stirred tank is fully turbulent. After setting the impeller speed to zero, gradually the tur1548
bulence decays and eventually the liquid becomes still. The rigorous model of decaying turbulence is quite complex. Fortunately, it is not necessary to model the decaying turbulence rigorously here. Instead, two asymptotes of fully developed turbulence and laminar flow (once the volume-averaged turbulence kinetic energy reduced below a certain threshold) give reasonable simulations. A sample of simulated results of settling velocity of the cloud of suspended solid is shown in Figure 17 along with the experimental data. Details of the model equations and effective drag coefficient correlation are discussed in Sardeshpande et al.36. The settling velocity of the cloud was calculated from a ratio of initial cloud height and solid settling time. The solid settling time was defined based on the decaying velocities of the solid particles. The settling time was defined as the time at which the volume-averaged solid particle velocity becomes less than 1% of the tip speed (tip speed before stopping the impeller). This was found to agree with the experimental data of settling time of the cloud of particles. CFD simulations using the model of Sardeshpande et al.33 were found to capture the key characteristics of solid suspension in stirred tank reasonably well.
Summary and path forward Here we have presented a brief account of our group’s efforts in developing and using CFD models for simulating solid suspension in stirred tanks. Hysteresis in cloud heights of suspended solid in stirred tanks and experimental data with sudden ‘impeller-stoppage’ have been reported. The key conclusions based on this work are as follows: • Cloud height of suspended solid in stirred tanks shows non-monotonic behaviour with impeller rotational speed. Contrary to the simple expectation, cloud height was found to decrease with increase in impeller CURRENT SCIENCE, VOL. 102, NO. 11, 10 JUNE 2012
REVIEW ARTICLES
•
•
•
•
•
rotational speed, till the latter crossed a certain critical value. Beyond this value, cloud height increased with impeller rotational speed. This behaviour occurred because of the complex interactions of the impeller stream and solid bed settled on the vessel bottom, and the influence of slurry density on impeller pumping. Cloud height of suspended solid exhibits hysteresis with respect to impeller rotational speed. It was observed that cloud height at a specific impeller speed, if approached by reducing the impeller speed, is generally higher than if approached by increasing the impeller speed. This observation may be used to make better solid suspension at a specific impeller speed by initially running the impeller at a higher rotational speed and then gradually reducing it to the specific target impeller speed. The mixing time was found to increase with impeller rotational speed initially till it reached a maximum value and then dropped gradually with further increase in the impeller rotational speed. Once the just offbottom suspension was achieved, the mixing time remained more or less constant till the system approached complete (uniform) suspension of solid. Beyond this stage, the mixing time slowly decreased with further increase in impeller rotational speed. A unit cell approach was useful in understanding the influence of the prevailing turbulence, solid volume fraction and particle Reynolds number on the effective drag coefficient. The influence of prevailing turbulence on the drag coefficient can be estimated by the functional form proposed by Brucato et al.15. The results obtained from the unit-cell approach and subsequent applications to solid suspension in stirred tanks indicate that for higher solid loading and larger particle Reynolds numbers, the proportionality constant appearing in the correlation of Brucato et al.15 needs to be reduced. CFD models along with appropriately modified correlation for estimating the effective drag coefficient were found to simulate solid suspension in stirred tanks reasonably well using the multiple reference frame approach and the standard k–ε turbulence model. The models were able to capture axial distribution of solid over a wide range of particle diameter, solid hold-up and tank size. The CFD models were also able to capture the observed hysteresis and dynamic settling of solid adequately despite some of the well-recognized issues associated with the models.
It should be noted that the models used in this work were primarily based on the Eulerian–Eulerian approach and two-equation turbulence models. In recent years, attempts at designing several more complex models based on large eddy simulations, lattice Boltzamnn simulations or direct numerical simulations have been made for simuCURRENT SCIENCE, VOL. 102, NO. 11, 10 JUNE 2012
lating solid suspension in stirred tanks (see for example Derksen39,40 and references cited therein). Though these recent models look theoretically more appealing, the model selection for solving industrial problems is often dictated by the cost-to-benefit ratio in practice. At this point of time, the approach based on multiple reference frame and two-equation turbulence models often provides adequate guidelines for solving industrial problems. Better-quality experimental data are needed to improve such models as well as to identify limitations of their applicability. The better quality experimental data and identified limitations of the current models will also provide renewed impetus for developing better models. Our group is currently working on establishing local solid measurement facilities as well as electric capacitance/resistivitybased tomography systems. These facilities will be used to archive new and better-quality experimental data. The models and results presented here can be further extended to enhance their application potential.
Nomenclature N Njs Di CD CD0 D12 dGp F12,i FDF H pl ps Qp R Rep Reimp g z
Impeller speed (rps) Critical impeller speed at just suspension (rps) Impeller diameter (m) Drag coefficient in turbulent liquid Drag coefficient in still liquid Turbulent diffusivity (m/s) Particle diameter (m) Interphase drag force (N) Turbulent dispersion force Height of tank Liquid pressure (N/m2) Solid pressure (N/m2) Pumping capacity of impeller (m3/s) Radius of impeller (m) Reynolds number of particle Reynolds number of impeller Acceleration due to gravity (m/s) Axial coordinate (m)
Greek letters ρl ρs ρm κ τ θmix ε λ μ μtm μtq τ
Density of water (kg/m3) Density of solid (kg/m3) Density of mixture (kg/m3) Turbulent kinetic energy (m2/s3) Cycle (circulation) time (s) Mixing time (s) Turbulent dissipation rate (m2/s3) Kolmogorov length scale (m) Viscosity (kg/ms) Turbulent viscosity of mixture (kg/ms) Viscosity of turbulence (kg/ms) Shear stress (N/m) 1549
REVIEW ARTICLES Subscripts 1 2 l s q t
G=
Liquid Solid Liquid Solid Phase number Turbulent
G G 1 μtm (∇U m,i + (∇U m,i )T ) 2 , 2
μtm =
ρm Cω k 2 . ε
(6)
n
ρm =
n
∑ α q ρq
∑α q ρqU q
G Um =
q =1 n
(7)
.
∑ α q ρq
q =1
q =1
Appendix 1.
Model equations
(A) The continuity equation for phase q without mass transfer between phases is written as ∂ (α q ρ q ) ∂t
G + ∇.(α q ρqU q,i − ρ q D12∇α q ) = 0.
(1) F12,i = −
Here α, ρ, U are the volume fraction, density and mean velocity of phase q respectively. The momentum balances for the liquid and solid phases respectively are G ∂ (α l ρlU l ,i )
3α1α 2 ρ1CD (∑(U 2,i − U1,i )2 )0.5 (U 2,i − U1,i )
G G + ∇.(α l ρlU l ,i × U l ,i )
(
) (
(
(2)
)
G G G G G G Fi = −2α i ρiω × U i − α i ρiω × (ω × r ).
Magelli14,
2 3
G
) T τ q(,tur ij = μtq ((∇U q ,i + (∇U q ,i )) ) − ( I (∇U q ,i )).
24 (1 + 0.15Re0.687 ) p Re p
Brucato et al. ,
⎛ dp CD ⎛⎜ = 1 + 8.76 × 10⁻⁴ ⎜⎜ ⎜ CD0 ⎝ λ ⎝
Pinelli et al.16,
⎛ 16λ ⎞ Us = 0.4 tanh ⎜ − 1⎟ + 0.6 ⎜ dp ⎟ Ut ⎝ ⎠
15
Khopkar et al. , (4)
⎛μ ⎞ G ∂ ( ρmφ ) + ∇.( ρ mU m,iφ ) = −∇. ⎜ tm ∇φ ⎟ + Sφ , ⎜ ⎟ ∂t ⎝ σφm ⎠ Sk = G − ρ mε ,
CD0 =
⎛ 16λ ⎞ Us = 0.4 tanh ⎜ − 1⎟ + 0.6 ⎜ dp ⎟ Ut ⎝ ⎠
4
The standard k–ε turbulence model with mixture properties was used.
ε
(9)
⎞ ⎟⎟ ⎠
3⎞
⎟ ⎟ ⎠
(3)
In this work, Boussinesq’s eddy viscosity hypothesis has been used to relate the Reynolds stresses with gradients of time-averaged velocity as G
(8)
3
⎛ dp ⎞ = K × ⎜⎜ ⎟⎟ . ⎝ λ ⎠
Schiller Naumann41,
The term Fi represents the Coriolis and centrifugal forces applied in the rotating reference frame and is written as
G
.
(B) List of drag correlations.
)
) (
4d p
CD − CD0 CD0
∂t G ) = −α l ∇p − ∇. α lτ l(,lam − ∇. α lτ l(,tij) + α l ρl gi ij G G G ∂ + F12,i (α s ρ sU s,i ) + ∇.(α s ρ sU s,i ) ∂t G G ) ) = −α s ∇p − α s ∇ps − ∇. α sτ s(,lam − ∇. α sτ s(,tur ij ij G G + α s ρ s gi − F12,i + Fi + FDF .
1550
Standard values of the k–ε model parameters have been used in the present simulations (C1 = 1.44, C2 = 1.92, Cϖ = 0.09, σk = 1.0 and σε = 1.3). The drag force termed as
Sε = [C1G − C2 ρ mε ]. k
(5)
⎛ dp CD ⎛⎜ = 1 + 8.76 × 10⁻⁵ ⎜⎜ CD0 ⎜ ⎝ λ ⎝
⎞ ⎟⎟ ⎠
3⎞
⎟ ⎟ ⎠
Fajner et al.17, ⎛ ⎛ Us λ = 0.32 tanh ⎜ 19 ⎜ ⎜ ⎜ Ut d ⎝ ⎝ p
⎞ ⎛ ρ p − ρl ⎟ ⎜⎜ ⎟ ⎠ ⎝ ρl
⎞ ⎟⎟ ⎠
0.5
⎞ − 1⎟ + 0.6 ⎟ ⎠
1. Montante, G. and Magelli, F., Modelling of solids distribution in stirred tanks: analysis of simulation strategies and comparison with experimental data. Int. J. Comput. Fluid Dyn., 2005, 19, 253– 262.
CURRENT SCIENCE, VOL. 102, NO. 11, 10 JUNE 2012
REVIEW ARTICLES 2. Sha, Z., Palosaari, S., Oinas, P. and Ogawa, K., CFD simulation of solid suspension in a stirred tank. J. Chem. Eng. Jpn. 2001, 34, 621. 3. Micale, G., Grisafi, F., Rizzuti, L. and Brucato, A., CFD simulation of particle suspension height in stirred vessels. Chem. Eng. Res. Des., 2004, 82, 1204. 4. Khopkar, A. R., Kasat, G. R., Pandit, A. B. and Ranade, V. V., Computational fluid dynamics simulation of the solid suspension in stirred slurry reactor. Ind. Chem. Res. Des., 2006, 45, 4416. 5. Khopkar, A. R. and Ranade, V. V., Computational modeling of multiphase flows in stirred vessels. In Chemical Engineering in Pharmaceutical Industry (ed. am Ende, D. J.), John Wiley, 2011. 6. Yamazaki, H., Tojo, K. and Miyanami, K., Concentration profiles of solids suspension in a stirred tank. Powder Technol., 1986, 48, 205–216. 7. Barresi, A. and Baldi, G., Solid dispersion in an agitated vessel. Chem. Eng. Sci., 1987, 42, 2949. 8. Shamlou, P. A. and Koutsakos, E., Solids suspension and distribution in liquids under turbulent agitation. Chem. Eng. Sci., 1989, 44, 529. 9. Godfrey, J. C. and Zhu, Z. M., Measurement of particle liquid profiles in agitated tanks. AIChE Symp. Ser., 1994, 299, 181. 10. Spidla, M., Mostek, M., Sinevic, V., Jahoda, M. and Machon, V., Experimental assessment and CFD simulations of local solid concentration profiles in a pilot-scale stirred tank. Chem. Pap., 2005, 59, 386. 11. Micale, G., Montante, G., Grisafi, F., Brucato, A. and Godfrey, J., CFD simulation of particle distribution in stirred reactors. Trans. IChemE. Part A, 2000, 78, 435. 12. Barrue, H., Xureb, C. and Bertrand, J., A computational study on solid suspension in stirred reactor. In Proceedings of ECCE1, Florence, Italy, 1997, p. 1843. 13. Altway, A., Setyavan, H. M. and Winardi, S., Effect of particle size on the simulation of three-dimensional solid dispersion in stirred tanks. Trans. Inst. Chem. Eng., 2001, 79, 1011. 14. Magelli, F., Fajner, D., Nocentini, M. and Pasquali, G., Solid distribution in reactors stirred with multiple impellers. Chem. Eng. Sci., 1990, 45, 615. 15. Brucato, A., Grisafi, F. and Montante, G., Particle drag coefficients in turbulent fluids. Chem. Eng. Sci., 1998, 53, 3295. 16. Pinelli, D., Nocentini, M. and Magelli, F., Solids distribution in stirred slurry reactors: influence of some mixer configurations and limits to the applicability of a simple model for predictions. Chem. Eng. Commun., 2001, 188, 91–107. 17. Fajner, D., Pinelli, D., Ghadge, R. S., Montante, G., Paglianti, A. and Magelli, F., Solids distribution and rising velocity of buoyant solid particles in a vessel stirred with multiple impellers. Chem. Eng. Sci., 2008, 63, 5876–5882. 18. Edward, P. L., Atiemo-Obeng, V. A. and Kresta, S. M., Handbook of Industrial Mixing – Science and Practice, Wiley Interscience, 2003, vol. 10, p. 556. 19. Zwietering, Th. N., Suspending of solid particles in liquid by agitators. Chem. Eng. Sci., 1958, 8, 244–253. 20. Nienow, A. W., Suspension of solid particles in turbine-agitated baffled vessels. Chem. Eng. Sci., 1968, 23, 1453. 21. Armenante, P. M. and Nagamine, E. U., Effect of low off-bottom impeller clearance on the minimum agitation speed for complete suspension in stirred tanks. Chem. Eng. Sci., 1998, 53, 1757–1775. 22. Sharma, R. N. and Shaikh, A. A., Solid suspension in stirred tanks with pitched blade turbines. Chem. Eng. Sci., 2003, 58, 2123– 2140.
CURRENT SCIENCE, VOL. 102, NO. 11, 10 JUNE 2012
23. Sardeshpande, M. V., Sagi, A. R., Juvekar, V. A. and Ranade, V. V., Solid suspension and liquid phase mixing in solid–liquid stirred tanks. Ind. Eng. Chem. Res., 2009, 48, 9713–9722. 24. Kasat, G. R., Khopkar, A. R., Pandit, A. B. and Ranade, V. V., CFD simulation of liquid phase mixing in solid–liquid stirred reactor. Chem. Eng. Sci., 2008, 64, 2272. 25. Kraume, M., Mixing times in stirred suspension. Chem. Eng. Technol., 1992, 15, 313. 26. Hicks, M. T., Mayers, K. J. and Bakker, A., Cloud height in solid suspension agitation. Chem. Eng. Commun., 1997, 160, 137– 155. 27. Bujalski, W. et al., Suspension and liquid homogenization in high solids concentration stirred chemical reactors. Trans. IChemE, 1999, 77, 241–247. 28. Takenaka, K., Takashi, K., Bujalski, W., Nienow, A. W., Paolini, S., Pagaltini, A. and Etchells, A., J. Chem. Eng. Jpn, 2005, 38, 309–315. 29. Bittorf, K. J. and Kresta, S. M., Prediction of cloud height for solid suspension in stirred tanks. In CHISA Conference Proceedings, Prague, 25–29 August 2003. 30. Ranade, V. V., Computational Flow Modelling for Chemical Reactor Engineering, Academic Press, New York, 2002. 31. Gosman, A. D., Lekakou, C., Politis, S., Issa, R. I. and Looney, M. K., Multi-dimensional modeling of turbulent two-phase flows in stirred reactors. AIChE J., 1992, 38, 1947. 32. Ljungqvist, M. and Rasmuson, A., Numerical simulation of the two-phase flow in an axially stirred reactor. Trans. IChemE., 2001, 79, 533. 33. Angst, R., Harnack, E., Singh, M. and Kraume, M., Grid and model dependency of the solid/liquid two-phase flow CFD simulation of stirred reactors. In Proceedings of the 11th European Conference of Mixing, Bamberg, Germany, 2003, p. 347. 34. Barrue, J., Bertrand, J., Cristol, B. and Xuereb, C., Eulerian simulation of dense solid–liquid suspension in multi-stage stirred reactor. J. Chem. Eng. Jpn, 2001, 34, 585. 35. Grenville, R. K., Blending of viscous Newtonian and pseudoplastic fluids. Ph D dissertation, Cranfield Institute of Technology, Cranfield, Bedfordshire, England, 1992. 36. Sardeshpande, M. V., Juvekar, V. A. and Ranade, V. V., Hysteresis in cloud heights during solid suspension in stirred tank reactor: Experiments and CFD simulations. AIChE J., 2010, 56, 2795– 2804. 37. Oshinow, L. M. and Bakker, A., CFD modelling of solid suspension in stirred tank. In Symposium on Computational Modeling of Metals, Minerals and Materials, Seattle, Washington, USA, 2002, pp. 205–215. 38. Ochieng, A. and Lewis, A. E., CFD simulations of solids offbottom suspension and cloud height. Hydrometallurgy, 2006, 82, 1–12. 39. Derksen, J., Numerical simulation of solids suspension in a stirred tank. AIChE J., 2003, 49, 2700–2714. 40. Derksen, J., Meso-scale simulations of solid–liquid flow and strategies for meso-macro coupling, Can. J. Chem. Eng., 2011, 9999, 1–9. 41. Schiller, L. and Neumann, A., Uber die grundlegenden berechungen bei der schwer kraftaufbereitung. Verein Deutscher Ingenieure, 1933, 77, 318.
Received 14 November 2011; revised accepted 13 April 2012
1551