Data mining techniques like decision trees (DT) and regression trees ... The processing of these data has been done using software ..... Comparison of results.
Application of Data Mining to Optimize Settings for Generator Tripping and Load Shedding System (RPTC) in Emergency Control at Hydro-Québec J.A. Huang*, S. Harrison**, G. Vanier*, A. Valette*, L. Wehenkel*** * IREQ, Hydro-Québec 1800 Lionel-Boulet Varennes, Québec Canada J3X 1S1
** TransEnergie, Hydro-Québec Case Postale 10000 Montreal, Québec Canada H5B 1H7
kV substations of the Hydro-Québec system. subsystems in a same corridor (or main axis) are com into an independent group. There are a total o shown in dark shaded areas in Figure 1. Each gr RPTC systems performs, associated with independent Protection Systems, the generation tripping scheme particular generation site while the remote load sh function is centralized. Figure 2 displays the fun diagram of RPTC. The RPTC system detects the loss o (LOD) or the bypass of series compensation banks (SC the transmission network. According to the severi location of the extreme contingencies, the Conti Classification Unit (CCU) sends the information initiat generation tripping, the remote load shedding a tripping of shunt reactors if required.
Abstract: This paper describes the on-going work done by Hydro-Québec to optimize the settings of automatic devices installed in its main power plants to maintain secure operation under extreme contingencies. The automatic generator tripping and load shedding system (RPTC) described in this paper is installed at the Churchill Falls hydroelectric power plant (5500 MW) in Labrador. Data mining techniques like decision trees (DT) and regression trees (RT) have been used. Real time snapshots of the Hydro-Québec power system collected over a 5 year period have been used to generate large amounts of results by transient stability simulations. The processing of these data has been done using software developed by the University of Liege. This approach gives the most relevant parameters and finds optimal settings for the RPTC system, minimizing the number of tripped generator units while maintaining the same performance in terms of security coverage. New operation rules can thus be established.
1
*** University of Liege Dept. of EE & CS Institut Montefiore B-4000 Liege, Belgium
INTRODUCTION
Table 1: Normal contingencies and extreme conting
Extreme Contingencies
Normal Contingencies
Operating criteria at Hydro-Québec[1] ensure that the transmission network can support normal contingencies (Table 1) without interruption of electricity and without any assistance of Special Protection Systems (SPS). This set of contingencies is used to determine the secure power transfer limits. They comply with the Northeast Power Coordinating Council (NPCC) criteria. In addition to these requirements, Hydro-Québec has judged that it is also important for the system to be stable after certain extreme contingencies (Table 1)[2]. The system stability is maintained by a scheme of generator tripping and load shedding, called RPTC, such that transfer limits are not affected. Figure 1 and Figure 2 give an overview of the basic structure and the general operation of the RPTC system. Figure 1 illustrates RPTC systems distributed in fifteen 735
Three phase fault with normal clearing Single line to ground fault with delayed clearing Breaker fault with normal clearing Loss of a bipolar dc line Loss of double-circuit line Loss of any element without fault Single line to ground fault with loss of two series or pa 735 kV line Loss of all 735 kV lines emanating from a substation Loss of all lines in a corridor
Loss of two parallel 735 kV lines and bypass of all s capacitors on the remaining line in the same corridor
The tuning of this Special Protection System (S complex: the proper level of generation tripping an shedding must be programmed. There are configurations to cover and the number of contingen large. Conventionally, the settings of these RPTC s were calculated using deterministic techniques, whic cover the worst-case scenarios. Thus, these settings m be optimized with respect to the number of units tripped. A probabilistic approach applied to this t study seems to be particularly interesting.
The study described in this paper covers the RPTC installed at the Churchill Falls hydroelectric powe (5500 MW) in Labrador. The purpose of this stud optimize the settings of generation tripping on a pa 1
event. In order to extract useful information from the database and to cover a sufficiently diverse set of situations, a large amount of data cases were retrieved from the database where real time power system snapshots are stored. Various network states were simulated using the power system analysis software developed by the Hydro-Québec Research Institute (IREQ). These cases represent actual operating states collected over a 5-year period. By using the data mining technique [3]-[6], the most relevant parameters for this automatic device will be identified and effective settings will be determined.
security and to avoid an unnecessary generation trippi number of generation units associated with the gen tripping scheme is adjusted to the loading an configuration of the Churchill Falls – Arnaud corridor Shore indicated in Figure 1). Table 2 presents the (rules) of the conventional approach. The margin rep the difference between the maximum power t considering normal contingencies and the measured transfer. The table gives the number of units to be based on the margin. For example, if the margin is 40 and less, then tripping of 8 units is required. If the ma above 2001 MW, then no unit tripping is required.
Figure 2: Functional diagram of RPTC
Table 2: Generator Unit Tripping Scheme
Figure 1: RPTC system
Modulation: 3 links at the Churchill Falls Margin At Churchill Falls: Units to be tripped
2
400 MW and less 401 to 700 MW 701 to 1000 MW 1001 to 1200 MW 1201 to 1400 MW 1401 to 1600 MW 1601 to 1800 MW 1801 to 2000 MW 2001 MW and more
DETAILED DESCRIPTION OF RPTC AT CHURCHILL FALLS
The event used for this study is detected by the RPTC at the Churchill Falls and is particularly severe for the network. The following describes the disturbances: o o o
Single line to ground fault at the Churchill Falls substation; Tripping of two parallel lines between the Churchill Falls and Montagnais substations; Bypass of the series compensation bank of the remaining line in the same corridor.
8 7 6 5 4 3 2 1 0
In this study, a method of analysis based o probabilistic approach will permit: o o
After detection of the event by the CCU system, generation tripping and load shedding are initiated. To ensure network
o 2
To establish the coverage of the current rules; To establish the most sensitive variable the network stability for this extreme event; To optimize the current rules;
o
Therefore, the second approach, which has been reta this work, seems more appropriate due to the fact operating cases used are real.
To suggest an algorithm to modulate the number of generation units to trip.
The methodology used is as follows: o o
o o o
3 3.1
3.2
Extraction of 10 000 network cases spread over a period of 5 years; Filtering of those cases to select only topologies with 3 links between Churchill Falls and Montagnais; Creation of each case with a random fault duration and a random time of bypassing a capacitor; Simulations to find the minimum number of units to be tripped to ensure system stability after this event; Optimization of the number of units to be tripped with a decision tree.
Data generation program
As shown in Figure 3, an extraction and a conver data is first accomplished. The data conversion is nee allow simulations of power system real snapshots st the control center database.
For this task, CILEX [7] software is used. This Québec in-house software is widely used to snapshots for planning and operation planning enginee
DATABASE GENERATION
Power system snapshots, 1997-2001
Methods for data base generation
The statistical approach used in this work requires the processing of a very large quantity of results generated by numerous scenario simulations. Each scenario is composed of a power flow snapshot of the network with the disturbances described in section 2. The simulations have a 10 second time frame and are performed on a PC network using a transient stability program (Hydro-Québec ST600 program). The approach has to generate pessimistic scenarios in order to cover adequately the critical situations where the RPTC automatic device operates with a good variance on the critical parameters and variables.
4600 cases remaining
ST600 (stability) 13000 stability simulations performed 236 pre-selected variables 500 hours CPU time (650 MHz PC)
Data Mining: • New rules for RPTC system • Identify important variables
Figure 3: Data Generation Program
A control software (pData) was developed to snapshot cases in order to keep just the relevan (cleaning process). For each filtered case, pData so builds the disturbance to be simulated as a function peculiarities of the studied case.
Two approaches have been envisioned:
o
pDATA load flow converge 3 lines at Churchill Falls • Modify disturbance to incorporat some probabilistic variables • Determine the minimum number generator units tripped for stabilit • Filter:
10000 cases converted
o
CILEX Extraction and Conversion
In the first approach, the generation of scenarios is done from a limited number of load flow base cases corresponding to real operating situations. These cases are then modified according to certain rules and the corresponding scenarios are simulated in order to create many critical situations for the RPTC system. In the second approach, the scenarios are generated from snapshots of real operating cases taken periodically over a long period of time (years) and disturbances critical for the RPTC system are simulated.
In this process, pData associates a random value to parameters of the disturbance in order to take into acco effects of these variations on the results. These para are the fault clearing time corresponding to the line re time (breaker operation) and the series compensation b time.
From transient stability simulations (Hydro-Québec program), pData determines, for each case, the mi number of units to be tripped by an iterative procedur respecting security criteria.
Particular care has to be taken in the generation process to avoid overrepresentation of non-relevant cases.
Finally, pData extracts results and saves some engin pre-selected relevant parameters, which will be used f mining analysis.
The results from the first approach are biased due to the overrepresentation of critical situations with in fact very low probability. This could be corrected only if probability data are available on disturbances and/or operating conditions. 3
3.3
Data coverage period and size of data case generated
4.2
From the 10000 extracted and converted snapshots, pData filter rejected more than half of the cases were, either because the resulting configuration did not have 3 lines connecting at Churchill Falls or data errors caused load flow nonconvergence. In the remaining 4600 cases, 13000 load flow and transient stability simulations were run to find the minimum number of units to be tripped. The total simulation duration of the 13000 cases is in the range of 500 CPU hours on a 650 MHz PC.
4 4.1
A decision tree (DT) is a map of the reasoning p This data mining technique is able to produce cla about a given problem in order to deduce informat new, unobserved cases. The DT has the hierarchical f a tree structured upside-down and is built on the bas Learning Set (LS). The LS comprises a number o (objects). Each case consists of pre-classified op states (described by a certain number of parameters candidate attributes), along with its correct classif (called the goal attribute). The candidate att characterize the pre-disturbance operating points in te parameters which can be used to make decisions. T building process seeks to build a set of rules relatin attributes to the goal attribute, so as to fit the learning s well enough without over-fitting this data. The resulti is tested on a different data set (test set) where the pre of the goal attribute by these rules is compared with t class (determined by simulation) for each test case classification error rate for the test set measures if the m is successful or not.
DATA MINING
Data mining techniques
Data mining refers to the extraction of high-level synthetic information (knowledge) from databases containing large amounts of low-level data. It is also called Knowledge Discovery in Databases (KDD). Data mining has received a wide range of applications in recent decades, for example in medical diagnosis, in character recognition, as well as in financial and marketing problems. The main reason for the important breakthrough is the tremendous increase in computing power. This makes possible the application of the often very computationally intensive data mining algorithms to practical large-scale problems. Nowadays, data mining techniques are also used in solving power system problems such as security assessment [3]-[5].
There are many reasons to use decision trees. The their interpretability. A tree structure provide information of how an output is arrived at. Anothe important asset is the ability of the method to identify the candidate attributes the most relevant parameters fo problem. A last characteristic of decision trees computational efficiency. The particular decision/reg tree induction method used in this paper is descri details in [8].
Table 3: Statistical Data of Unnecessary Tripped units from the Generated Database # Of Units to Trip
8 7 6 5 4 3 2 1 0 Total
Number Of Cases With Current Rules
2130 647 626 135 278 159 157 58 370 4560
5
Over-tripping
Of Matched Tripping
With Overtripping
205 93 15 0 0 0 0 0 370 683
1925 554 611 135 278 159 157 58 0 3877
# of Units
5643 1818 2288 625 1047 477 314 58 0 12270
Average per case
2.65 2.81 3.65 4.62 3.77 3 2 1 0 2.69
Decision (regression) trees
Rate (%)
5.1
33 40 61 93 94 100 100 100 0 44
RESULTS
Correlation studies
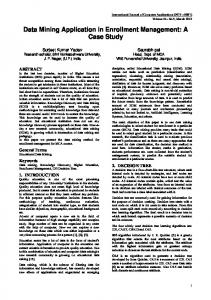
Using the generated database, correlation studie performed. Figure 4 shows the correlation of transf transfer margin on the Churchill Falls corridor vs mi generator unit tripping as determined by the time simulations. The dashed horizontal line in Figure for example, that the currently used-rules require to units if the transfer margin on the Churchill Falls cor less than 400 MW (see Table 2). From the ge database (4560 cases), there are about 2130 cases (see 3) in which the current rules require 8 units to be trip actually, we can see from Figure 4 that if the transfer Churchill Falls corridor is less than 3300 MW ( vertical line), there is no need to trip generator units at we count the number of cases for which the time d simulations found that it is necessary to trip 8 units, w only 205 cases. Thus, among the 2130 cases for wh
Data mining involves an integration of techniques from multiple disciplines such as database technology, statistics, machine learning, high-performance computing, pattern recognition, neural networks and so on. Many methods have been developed in the field of data mining. Here, this paper is focused on using the decision tree type methodology to optimize RPTC system settings for generator tripping in emergency control at Hydro-Québec. 4
Correlation of Transfer & Margin vs Minimum Group Rejected 3500
3000
3300 MW
Margin (MW)
2500
2000
1500
400 MW
1000
500
0 1000
1500
2000
2500
3000
3500
4000
4500
5000
Transfer (MW) Zero Unit Tripping
One-Eight Unit Tripping
Figure 4: Correlation of Transfer and Margin at Churchill Falls Corridor
circuit breaker configurations have no impact on the t limit for the event used in this study. Therefore, the m used in Table 2 are very conservative. To quickly ver impact of removing this restriction on the number of tripped in excess, we have rebuilt the table by takin account a margin computed on a maximum transfer, w 5200 MW. The obtained results are surprising: it r over-tripping to an average value of 1.72 per case ( from 2.69 with the current rules. However, this new cannot be used as it is because it doesn't take into a certain network configurations having an impact on th studied here. For these cases, the number of groups as to the tripping is not enough to maintain stable operatio
current rules tell us to trip 8 units, there are 1925 cases which need less than eight (down to zero) unit tripping. More synthetically, if we count among these 2130 cases the difference between the number of units required to trip by the current rules and the actual number of units necessary to be tripped according to the simulations, it is found that 33% of generator units (5643 units) are unnecessarily tripped with the currently used 8 units tripping rules. Table 3 shows some other statistical data from the generated database. It can be observed that among 4560 cases the average of generator units over-tripped is about 2.69 per case and 44% of generator units are over-tripped. From this, it can be seen that the current rules are highly conservative and could possibly be improved by taking into account not only the margin but also the total power transfer through the Churchill Falls corridor in their formulation. 5.2
5.3
Regression tree
Constructions of regression trees were carried out generated database using data mining software AT developed at the University of Liege. Among 4560 (cases), 2000 objects were selected as a learning set a remaining 2560 objects were comprised as a test se goal is to predict the minimum number of generator be tripped. Figure 5 Shows a constructed regressio The tree is to read top-down: each internal node corre to a test on one of the candidate attributes and the te nodes correspond to decisions about the number of unit
Applying a 5200 MW limit
Table 2 takes into account the transfer margin (maximum transfer minus measured transfer on the Churchill Falls corridors) to determine the number of units to be tripped. The maximum transfer considers many network configurations (lines, series compensation, synchronous condenser) as well as circuit breaker configurations, but 5
Figure 5: Regression Tree to Predict Number of Generator Unit Tripping tripped. These nodes are sorted left to right by increasing number of units to be tripped. For example the left-most terminal node (denoted T4) corresponds to 630 cases for which the expected number of units to be tripped is 0.04921. A case will be directed to this node if T_CHU_MONT < 3912.5 MW. On the other hand, the right-most terminal node (denoted T42) corresponds to an expected number of units to be tripped of 6.92, for the conditions of T_CHU_MONT > 4754.5 MW and KV_CHU735 > 739.5 KV. The parameter T_CHU_MONT represents the transfer on the Churchill Fall Corridors and KV_CHU735 is the voltage at the Churchill Falls.
value – ceiling function).
By construction, the predictions of the regression t unbiased estimates of the true values; this means tha errors are both negative and positive. In practice, it m preferable to have rules which have less negative erro few unit tripping – under-tripping) than positive on many – over-tripping) because the cost of instability i higher than the cost of unnecessarily tripping one or tw units. Such a bias can be introduced as a post-proces the regression tree output, for example by adding positive constant to its predictions before rounding nearest integer.
Table 4: Average of Over-tripped Units per Case Methods Used Current Rules Margin Based on 5200 MW limits Combination of Transfer and Margin Regression Tree with Post-processing
Average 2.69 1.72 1.48 1.01
5.4
Comparison of results
Table 4 lists the average of over-tripped units pe Although this value may not have a direct physical m it is used here as an indication of the improvement different methods tested. The first line of the table re the rules actually in use, and designed by the c deterministic method. The second line concer modification of these rules when a constant transfer l 5200MW is used to compute the margin. The third lin the performance of another rule designed by hand from into account both margin and transfer limit. Finally,
Notice that among the 236 candidate attributes proposed to the tree building software, only 7 attributes were identified as important variables to decide on the number of units to be tripped. Notice also that in order to translate the rules provided by the tree into decision rules it is obviously necessary to convert the fractional predictions into integer numbers (e.g. by rounding up to the nearest larger integer 6
line gives the results obtained by rules of a post-processing of the regression tree of Figure 5. This post-processing consists in adding a positive bias of 0.45 to the predictions of the tree and round up to the nearest integer (ceiling function). It can be seen that the regression tree has the least average value of over-tripped generator units per case. This means that if the regression tree rules are implemented, the number of generator unit tripping will be closest to their minimum among all other methods.
performance in terms of security coverage. New op rules can thus be established and will be implemented. Following these very encouraging results, applications of these methods are being considered at Québec in the coming years.
3000 2500
6
Number of Cases
Figure 6 shows the frequency diagram of mis-tripped generator units for different methods. The term of “mistripped” unit is defined as the difference between simulated optimal unit tripping and non-simulated unit tripping. A positive value means generator units are over-tripped while negative value means under-tripped. The distribution of mistripped units by the current rules is widely spread while that of the regression tree is concentrated. In most cases, the regression tree gives one generator unit over-tripping while the current rules sometimes gives 8 generator units overtripping. The reason that the regression tree mis-tripping is concentrated around one is, as mentioned previously, that the post-processing is applied to the regression tree of Figure 5. This post-processing adds a positive value of 0.45 to the predictions of the tree before applying the ceiling function in order to eliminate most of the generator unit under-tripping. Therefore, it appears that in most cases the regression tree settles on one generator unit over-tripping. The results from the regression tree are very promising, but more efforts have to be made to assess whether the risk of under-tripping is acceptable (with respect to other risks not taken into account in our study), and if not, to eliminate the few remaining cases of under-tripping.
2000 1500 1000 500 0 -2 -1
0
1
2
3
4
5
6
7
8
Number of Mis-tripped Units
Figure 6: Comparison of Results of Different Metho
7 [1]
J-P. Gingras, R. Mailhot, J. Lavergne, “Bilan de l’exploit réseau d’Hydro-Québec avec compensation série,” CIGRÉ session 2000.
[2]
G. Trudel, S. Bernard, G. Scott, “Hydro-Québec’s defence pla extreme contingencies,” IEEE, PE-211-PWRS -0-06-1998
[3]
L. Wehenkel, M. Pavella, “Advances in Decision Trees Ap Power System Security Assessment,” IEE 2nd International Co on Advances in Power System Control, Operation and Man December 1993, Hong Kong.
[4]
S. Rovnyak, S. Kretsinger, J. Thorp, D. Brown, “Decision T Real-Time Transient Stability Prediction,” IEEE Transactions Systems, Vol. 9, No.3, August 1994.
[5]
N.D. Hatziargyriou, S.A. Papathanassiou, M.P. Papad “Decision Trees For Fast Security Assessment of Autonomou Systems With a Large Penetration From Renewable,” IEEE Tra on Energy Conversion, Vol. 10, No.2, June 1995
[6]
Y. Schlumberger, C. Levrevelec, M. De Pasquale, “Power Security Analysis New Approaches Used at EDF,” IEEE Meeting, July 21, 1999, Edmonton, Canada.
[7]
L. Riverin, J.A. Huang, A. Valette, F. Lafrance, “Basic Requ a System of On-line Stability Limit Analysis at Hydro International Conference on Power System Technology, Octob 1994, Beijing, China.
[8]
L. Wehenkel, Automatic Learning Techniques in Power Kluwer Academic, 1998
CONCLUSIONS
The study described in this paper covers the RPTC automatic device installed at the Churchill Falls hydroelectric power station (5500 MW) in Labrador. The data mining technique was applied to the results of some 13000 network simulations. Various network states were taken from a realtime database and were simulated using the network analysis software developed by Hydro-Québec Research Institute (IREQ). The data cases represent actual operating states collected over a 5-year period. By using the data mining technique, the most relevant parameters for this automat were identified and effective settings were determined. A correlation analysis and the construction of regression trees were carried out on the results of these simulations using data mining software developed at the University of Liege. This analysis made it possible to minimize, in particular, the number of generators tripped by the RPTC system for a large number of network conditions, while maintaining the same
7
REFERENCES