Anupam Anant Kher et al. / International Journal of Engineering and Technology (IJET)
Application of Fuzzy Time Series Forecasting Model for Indian Underground Coal Mining Fatal Accident Data Anupam Anant Kher#1, Dr. Rajendra R. Yerpude*2 #1
Assistant Professor, Industrial Engineering Shri Ramdeobaba College of Engineering and Management, Nagpur, M.S. India 440013 Email:
[email protected] *2 Professor, Mining Engineering, Visvesvaraya National Institute of Technology, Nagpur, M. S. India 440010 Email:
[email protected] Abstract: Director General of Mines Safety under Ministry of Labour, Government of India, published several annual reports, which included safety statistics of Indian mines. A collective / integrated record is created from these reports in the form of mining accident database for detailed analysis. Yearly data on underground coal mining accidents was combined to obtain a unified database, which was utilised in the application of forecasting models based on time series modelling. Fuzzy time series forecasting model was applied in the present study. The predictions and forecasts are presented here with discussions on the results Keywords-Coal mining, underground safety, fatal accidents, forecasting, Fuzzy time series analysis I. INTRODUCTION India is the third biggest producer of coal after China and USA and is having the fifth largest reserves in the world. The country is also the third biggest consumer of coal after China and USA. It is expected that by 201617, the demand of coal will reach about 900 million tonnes; India is likely to be the second largest consumer of coal after China. Mining is one of the most hazardous occupations in the world and India is not an exception to this fact. Indian coal mines witnessed a slight dip in the coal production of underground mines from about 70 million tonnes in 1990 to 64.3 million tonnes in 2012. In addition, there is the steady decline in manpower for underground mines with 0.31 million persons employed in the year 1990 which is brought down to 0.172 million people employed in the year 2012. Eventually, there has been a considerable decline in fatal accidents in underground coal mines from 91 to 27 for the period 1990 – 2013. Director General of Mines Safety (Ministry of Labour, Government of India) has published annual reports [15, 16, 17, 18, 19, 20] with year wise fatal accidents and corresponding fatalities, serious injuries and seriously injured accident rates etc. The data for the period 1990 to 2013 related to underground coal mining was available for following parameters: • Underground Coal Mining Employment in 1000 • Underground Coal Mining Output (tonnes) in 1000 • Underground Coal Mining Number of Fatal Accidents • Underground Coal Mining Fatality Rate Per Thousand Employed • Underground Coal Mining Number of Serious Accidents • Underground Coal Mining Serious Injury Rate Per Thousand Employed In this study, fuzzy time series (FTS) modelling has been applied to the Indian underground coal mining accident data for forecasting accidents. The above parameters were considered for the application of Fuzzy time series modelling and out of these parameters application of Fuzzy time series with respect to the underground coal mining number of fatal accidents is presented here. II. FUZZY TIME SERIES Amid the most recent fifteen years, different Fuzzy Time Series (FTS) models have been proposed. [1, 2, 3, 4, 5, 6, 7, 8, 9] FTS models have been used to make predictions of stock exchanges, university enrolments, car crash, etc. Song and Chissom [1, 2, 15] introduced the concept of Fuzzy time series based on the fuzzy set theory [32]. Song and Chissom have presented forecasting of the enrolments of the University of Alabama using timeinvariant and time-variant Fuzzy time series [1, 2, 15]. After that, many fuzzy forecasting methods have been presented with an objective to find a better forecasting result or to do faster computations. After a literature review, it is observed that, generally higher order models [10, 11, 12, 14] are perceived to be more accurate. The increasing order of the model causes lesser utilisation of the data. Many authors have detailed about fuzzification of the data, but the only proper defuzzification approach was taken by Jens Poulsen [21]. Jens
ISSN : 0975-4024
Vol 7 No 2 Apr-May 2015
719
Anupam Anant Kher et al. / International Journal of Engineering and Technology (IJET)
Poulsen developed an algorithm of a forecast model based on FTS, which provides higher forecasting accuracy rates than its other high order counterparts as well suggested method of improved data utilisation. III.APPLICATION OF FUZZY TIME SERIES INDIAN UNDERGROUND COAL MINING FATAL ACCIDENTS The Fuzzy time series algorithm developed by Jens Paulsen’s is applied for forecasting Indian underground coal mining fatal accidents for the period 1990 to 2013. TABLE I: YEAR WISE NUMBER OF FATAL ACCIDENTS IN UNDERGROUND COAL MINES
Number of fatal accidents in underground coal mines 91 80 107 101 93 91 75 94 80 74 62 67
Year 1990 1991 1992 1993 1994 1995 1996 1997 1998 1999 2000 2001
Number of fatal accidents in underground coal mines 48 46 49 50 44 25 32 39 41 23 25 27
Year 2002 2003 2004 2005 2006 2007 2008 2009 2010 2011 2012 2013
The algorithm is applied through the following steps: (a) Define The Universe Of Discourse And Partition It Into Equally Lengthy Intervals The universe of discourse U is defined as [Xmin−X1, Xmax−X2] where Xmin and Xmax are the minimum and maximum historical values of underground fatal accidents, respectively. From table 1, we get Xmin =23and Xmax =107. The variables X1 and X2 are two positive numbers, appropriately selected according to the data limits. Considering maximum and minimum number of fatal accidents let X1 = 2 and X2= 5, we get U = [21, 112]. Chen used seven intervals which is the same number used in most cases observed in the literature. Dividing U into seven evenly lengthy intervals n1, n2, n3, n4, n5, n6 and n7, we get n1 = [21, 34], n2 = [34, 47], n3= [47, 60], n4= [60, 73], n5= [73, 86], n6= [86, 99] and n7= [99,112] (b) Fuzzifying Historical Underground Fatal Accident Data The fuzzification algorithm (FA) proposed by Jens Rúni Poulsen [21] generates a series of trapezoidal fuzzy sets from a prearranged dataset and start associations between the values in the dataset and the fuzzy sets generated. This algorithm is inspired by the trapezoid fuzzification method suggested by Cheng et al in [4]. Trapezoidal fuzzy sets with overlapping boundaries are used here instead of the crisp intervals, which are defined by the user at the initial step of fuzzy time. This overlap implies that a value may belong to more than one set. If a value belongs to more than one set, it is then associated to the set where its degree of membership is maximum. The fuzzification algorithm (FA) performs automatically the calculation of the fuzzy intervals/sets. The basic idea of the algorithm is to repeat the fuzzification procedure when the dataset is updated. The procedure is a six-step process as given below: 1. Sort the values in the ascending order. 2. Compute the average distance between any two consecutive values in the sorted data set and the corresponding standard deviation. The average distance is given by equation as below ∑
Average Distance (x1…..xn) = ∑ 3. 4.
(
−
()
−
(
)
. The standard deviation is computed as σ
=
)
Eliminate outliers from the sorted data set. An outlier, in this context, is defined as a value less than or larger than one standard deviation from average. Compute the revised average distance between any two remaining consecutive values in the sorted data set.
ISSN : 0975-4024
Vol 7 No 2 Apr-May 2015
720
Anupam Anant Kher et al. / International Journal of Engineering and Technology (IJET)
5. 6.
The universe of discourse is calculated by subtracting the revised average distance from the lowest value and adding the revised average distance to the highest value. Fuzzify the dataset using the trapezoid fuzzification approach. Using trapezoidal functions, the membership degree, for a given function μA and a given value x, is obtained by equation as given below ,a ≤ x ≤ a 1,
a ≤x≤a ,a ≤ x ≤ a
μ A=
zero, otherwise
the number of subsets to be defined on U and is computed by Ns=Ru−S / 2S where Ru denotes the range of the universe set. In this equation, S denotes the segment length. S= Ru/2 Ns +1. The range, Ru, is computed by = (Upper Bound – Lower Bound) where Upper bound= (Xmax + Average Revised Distance) and Lower bound= (Xmax - Average Revised Distance) of U. The segment length, S is equal to the average revised distance, which in turn constitutes the length of left spread length, core length and right spread length of the membership function. In trapezoidal membership function the left spread length, core length and right spread length are equal to average revised distance. The data is sorted ascending as shown in the table 2. TABLE 2: FUZZY SET CALCULATIONS
Year 2011 2007 2012 2013 2008 2009 2010 2006 2003 2002 2004 2005 2000 2001 1999 1996 1991 1998 1990 1995 1994 1997 1993 1992 (SQRT)
ISSN : 0975-4024
Fatal Accidents Fi 23 25 25 27 32 39 41 44 46 48 49 50 62 67 74 75 80 80 91 91 93 94 101 107 Average
|Fi- Fi+1|
( |Fi- Fi+1| - Average Dist)^2
2 0 2 5 7 2 3 2 2 1 1 12 5 7 1 5 0 11 0 2 1 7 6 3.652174
σ
Vol 7 No 2 Apr-May 2015
2.729678639 13.33837429 2.729678639 1.816635161 11.20793951 2.729678639 0.425330813 2.729678639 2.729678639 7.034026465 7.034026465 69.68620038 1.816635161 11.20793951 7.034026465 1.816635161 13.33837429 53.9905482 13.33837429 2.729678639 7.034026465 11.20793951 5.512287335 11.0094518 3.31804939
721
Anupam Anant Kher et al. / International Journal of Engineering and Technology (IJET)
The outliers are calculated which are the values less than or larger than one standard deviation from average distance. The values which lie in the range 3.65 − 3.31≤ x ≥ 3.65 + 3.31 are considered for further calculations. The values outside 0.33 ≥ x ≥ 6.97 range are eliminated as outlier and revised average distance is calculated. The fuzzification in this manner is shown here for four years as follows TABLE 3: FUZZY SET CALCULATIONS FOR THE FIRST FOUR PERIODS.
Year
Fatal Accidents
|Fi- Fi+1|
( |Fi- Fi+1| - Average dist)^2
2011
23
2007
25
2
0.444444444
2012
25
0
1.777777778
2013
27
2
0.444444444
1.333333
0.888888889
Average distance SQRT
σ
0.942809042
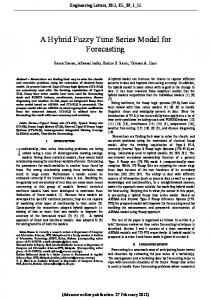
Average distance calculated is 1.3333 and σ = 0.9428. The value, which lies in the range 0.39≤ x ≥ 2.276, is considered for further calculations. Since the value 2 qualifies in this range, the revised average distance, which is equal to segment length, equates to 2. The lower bound will be 23-2 = 21 and Upper bound becomes 27+2 = 29. Hence the universe U = [21, 29] and the range will be 29-21 = 8. From this the number of sets is calculated as Ns=Ru−S / 2S which is equal to (8-2) / 2 *2 = 6/4 = 1.5 ≈ 2. Knowing the universe of discourse and the parameters related to the number of sets, range and segment length the fuzzy sets are calculated as shown in the figure
Figure 1: TRAPEZOIDAL FUZZY SETS FOR FIRST FOUR-YEAR’S DATA
It can be observed from the data the segment lengths are not equal. This is because the Jens Poulsen’s algorithm adapts the segment length in such a way that the lowest value in the dataset always appears as the left bound in the first crisp interval. Similarly, the highest value in the dataset always appears as the right bound in the last crisp interval. The segment length are not similar because these values cannot be matched precisely without adjusting the segment length, due to rounding errors occurred in the calculation of average distance and number of fuzzy sets. After completion of the algorithm of elimination of outliers, calculation of revised distance, the following fuzzy sets are generated.
ISSN : 0975-4024
Vol 7 No 2 Apr-May 2015
722
Anupam Anant Kher et al. / International Journal of Engineering and Technology (IJET)
TABLE 4: TRAPEZOIDAL FUZZY NUMBER WITH CRISP INTERVALS
Fuzzy set
Trapezoidal fuzzy number
Crisp interval
A1
20.0, 23.0, 26.0, 29.0
u1=[23,26]
A2
26.0, 29.0, 32.0, 35.0
u2=[29,32]
A3
32.0, 35.0, 37.0, 40.0
u3=[35,37]
A4
37.0, 40.0, 43.0, 46.0
u4=[40,43]
A5
43.0, 46.0, 49.0, 52.0
u5=[46,49]
A6
49.0, 52.0, 55.0, 58.0
u6=[52,55]
A7
55.0, 58.0, 61.0, 64.0
u7=[58,61]
A8
61.0, 64.0, 66.0, 69.0
u8=[64,66]
A9
66.0, 69.0, 72.0, 75.0
u9=[69,72]
A10
72.0, 75.0, 78.0, 81.0
u10=[75,78]
A11
78.0, 81.0, 84.0, 87.0
u11=[81,84]
A12
84.0, 87.0, 90.0, 93.0
u12=[87,90]
A13
90.0, 93.0, 95.0, 98.0
u13=[93,95]
A14
95.0, 98.0, 101.0, 104.0
u14=[98,101]
A15
101.0, 104.0, 107.0, 110.0
u15=[104,107]
The membership degree in all fuzzy sets with this algorithm is generated at 0.5. This is a special case, as this implies that value has the same membership status in two different sets. In such cases, the respective value is associated to both A1 and A2 or any other consecutive fuzzy set. TABLE 5: FUZZY SETS ALLOTTED TO INDIVIDUAL TIME FRAME
Year
Fatal Accidents
Fuzzy Set
Year
Fatal Accidents
Fuzzy Set
1990
91
A13
2002
48
A5
1991
80
A11
2003
46
A5
1992
107
A15
2004
49
A5
1993
101
A15
2005
50
A6
1994
93
A13
2006
44
A5
1995
91
A13
2007
25
A1
1996
75
A10
2008
32
A2
1997
94
A14
2009
39
A3
1998
80
A11
2010
41
A4
1999
74
A10
2011
23
A1
2000
62
A8
2012
25
A1
2001
67
A9
2013
27
A1
a) Identify fuzzy relationships and groups for prediction Relationships are identified from the fuzzified historical data. If the time series variable F (t−1) is fuzzified as Ai and F (t) as Aj, then Ai is related to Aj. This relationship is designated as Ai Aj, where Ai is the current state of enrolment and Aj is the next state of enrolment. From the table above it can be observed that year 1992 and 1993 both are fuzzified as A15, which provides the relationship A15 - A15. The complete set of relationships is identified from the fuzzy set data. Same relationship occurring more than once are ignored as there can be only one unique combination. The establishment of fuzzy relation groups is done by identifying fuzzy sets with more than one similar relationship and merging the right hand side of the fuzzy relationship e.g. A15 A15, A13. The
ISSN : 0975-4024
Vol 7 No 2 Apr-May 2015
723
Anupam Anant Kher et al. / International Journal of Engineering and Technology (IJET)
second order fuzzy relation groups are also established by this algorithm as F (t−2), F (t−1), F (t). However, if two other identical left hand sides exist for a particular fuzzy relation group, then the corresponding third order relation is established as F (t−3), F (t−2), F (t−1), F (t). Here in this case of fatal accidents in underground mines the third order relationship is established for the period 1993 as F(t−3), F(t−2), F(t−1), F(t) = A12, A11, A15 A15. The third order fuzzy relation groups for the given data set of underground coal mine fatal accidents in India are created as follows TABLE 6: THIRD ORDER FUZZY RELATIONSHIP TABLE
1993
Third order fuzzy relationship [A12, A11, A15]
Fuzzy set for Predicted Value A15
2004
Third order fuzzy relationship [A8, A5, A5]
Fuzzy set for Predicted Value A6
1994
[A11, A15, A14]
A14
2005
[A5, A5, A5]
A6
1995
[A15, A14, A13]
A13
2006
[A5, A5, A5]
A5
1996
[A14, A13, A12]
A10
2007
[A5, A5, A4]
A1
1997
[A13, A12, A10]
A13
2008
[A5, A4, A1]
A2
1998
[A12, A10, A13]
A11
2009
[A4, A1, A2]
A3
1999
[A10, A13, A11]
A10
2010
[A1, A2, A4]
A4
2000
[A13, A11, A10]
A8
2011
[A2, A4, A4]
A1
2001
[A11, A10, A7]
A9
2012
[A4, A4, A1]
A1
2002
[A10, A7, A8]
A5
2013
[A4, A1, A1]
A1
2003
[A7, A8, A5]
A5
Period
Period
The algorithm picks up the predicted value from the predicted fuzzy set number and accordingly all predictions are made. IV. RESULTS AND DISCUSSIONS Forecasted results are calculated using Jens Poulsen’s Fuzzy time series algorithm. Referring to table 4, we get the predicted values of underground coal mine fatal accidents for all time periods. The results of this Fuzzy time series model have been compared other forecasting model such as SPSS Expert Modeller, Double Moving Average, Regression and Neural Network based time series forecasting. TABLE 7: PREDICTED VALUE USING FTS ALGORITHM
1990
Fuzzy time series predicted --
2002
Fuzzy time series predicted 48
1991
--
2003
47
1992
--
2004
49
1993
100
2005
51
1994
94
2006
45
1995
91
2007
26
1996
76
2008
33
1997
95
2009
40
1998
81
2010
42
1999
75
2011
24
2000
62
2012
26
2001
68
2013
28
Year
ISSN : 0975-4024
Year
Vol 7 No 2 Apr-May 2015
724
Anupam Anant Kher et al. / International Journal of Engineering and Technology (IJET)
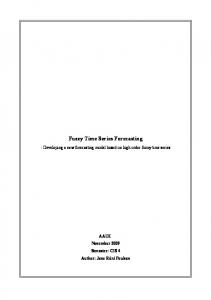
Figure 2: PREDICTED VALUES OF FORECASTING MODELS VIS-À-VIS ACTUAL VALUES OF FATAL ACCIDENTS
Comparing results of all forecasting models given in the table 6, it can be observed that forecast error is minimum in the case of the Fuzzy time series model applied on the underground coal mining fatal accident time series data. The errors, including Mean Absolute Error (MAE), Sum Square Error (SSE), Mean Squared Error (MSE), Mean Absolute Percentage Error (MAPE), Root Mean Square Error (RSME), Symmetric Mean Absolute Percentage Error (SMAPE) has the lowest values for Fuzzy time series vis-a-vis the other models referred to in the table. TABLE 8: COMPARISON OF RESULTS OBTAINED BY APPLICATION OF FORECASTING MODELS.
Fuzzy Time Series
SPSS Expert Modeller
Double Moving Average
Regression
Neural Network*
21 0.81
24 6.74
21 11.85
24 7.55
18 5.65
Sum Square Error (SSE)
17.00
1389.00
4263.31
1922.06
848.87
Mean Squared Error (MSE)
0.81
66.14
203.01
80.09
47.16
Mean Absolute Percentage Error (MAPE) Root Mean Square Error (RSME) Symmetric Mean Absolute Percentage Error (SMAPE)
1.87
14.98
27.43
14.51
13.07
0.90
8.13
27.43
8.95
6.87
0.02
0.14
0.27
0.14
0.13
MODEL Included Observation Mean Absolute Error (MAE)
*Input Layer Neurons-6, Hidden Layer Neurons- 6, Output Layer Neurons 1, Activation function- Sigmoid V. CONCLUSIONS: A high order FTS model has been applied to forecast underground coal mine fatal accident time series data. FTS model proposed by Jens Poulsen based on the trapezoid fuzzification approach can be applied to any FTS model including interval partitions. Enhanced accuracy was not the main objective, but the results indicate that forecast accuracy is maximum using the proposed fuzzy algorithm. Future work includes study of how this algorithm predicts future values of fatal accidents.
ISSN : 0975-4024
Vol 7 No 2 Apr-May 2015
725
Anupam Anant Kher et al. / International Journal of Engineering and Technology (IJET)
REFERENCES [1] [2] [3] [4] [5] [6] [7] [8] [9] [10] [11] [12] [13] [14] [15] [16] [17] [18] [19] [20] [21] [22] [23] [24] [25] [26]
Q. Song and B.S. Chissom, Forecasting enrolments with fuzzy time series - part I, Fuzzy Sets and Systems 54 (1993), pp. 1-9. Q. Song and B.S. Chissom, Forecasting enrolments with fuzzy time series - part II, Fuzzy Sets and Systems 62 (1994), pp. 1-8. T.A. Jilani and S.M.A. Burney, A refined fuzzy time series model for stock market forecasting, Statistical Mechanics and its Applications 387 (2008), pp. 2857-2862. S.M. Chen, Forecasting enrolments based on fuzzy time series, Fuzzy Sets and Systems 81, (1996), pp. 311-319. K.H. Huarng, T.H.K Yu and Y.W. Hsu, A multivariate heuristic model for fuzzy-time series forecasting, Systems, Management and Cybernetics 37 (2007), pp. 836-846. C.H. Cheng, J.R. Chang and C.A. Yeh, Entropy-based and trapezoid fuzzification fuzzy time series approaches for forecasting IT project cost, Technological Forecasting & Social Change 73 (2006), pp. 524-542. C.H. Cheng, J.W. Wang and C.H. Li, Forecasting the number of outpatient visits using a new fuzzy time series based on weighted transitional matrix, Expert Systems with Applications 34 (2008), pp. 2568-2575 S.T. Li and Y.C. Cheng, Deterministic fuzzy time series model for forecasting enrolments, Computer and Mathematics with Applications 53 (2007), pp. 1904-1920. S.R. Sing, A robust method of forecasting based on fuzzy time series, Applied Mathematics and Computation 188 (2007), pp. 472-484. S.M. Chen and N.Y. Chung, Forecasting enrolments using high-order fuzzy time series and genetic algorithms, Int. Journal of Intelligent Systems 21 (2006), pp. 485-501. S.M. Chen and C.C. Hsu, A new method to forecast enrolments using fuzzy time series, Int. Journal of Applied Science and Engineering 2 (2004), pp. 234-244. S.M. Chen, Forecasting enrolments based on high-order fuzzy time series, Cybernetics and Systems: An Int. Journal 33 (2002), pp. 116. S.R. Sing, A simple time variant method for fuzzy time series forecasting, Cybernetics and Systems: An Int. Journal 38 (2007), pp. 305-321. Q. Song and B.S. Chissom, Fuzzy time series and its models, Fuzzy Sets and Systems 54 (1993), pp. 269-277. DGMS Annual Report, 2005, Publication of Directorate-General of Mines Safety, Ministry of Labour & Employment, Govt. Of India, Dhanbad, India DGMS Annual Report, 2007, Publication of Directorate-General of Mines Safety, Ministry of Labour & Employment, Govt. Of India, Dhanbad, India DGMS Annual Report, 2008, Publication of Directorate-General of Mines Safety, Ministry of Labour & Employment, Govt. Of India, Dhanbad, India DGMS Annual Report, 2009, Publication of Directorate-General of Mines Safety, Ministry of Labour & Employment, Govt. Of India, Dhanbad, India DGMS Annual Report, 2010, Publication of Directorate-General of Mines Safety, Ministry of Labour & Employment, Govt. Of India, Dhanbad, India DGMS Annual Report, 2011, Publication of Directorate-General of Mines Safety, Ministry of Labour & Employment, Govt. Of India, Dhanbad, India Poulsen J.R., “Fuzzy Time Series Forecasting – Developing a new forecasting model based on high order fuzzy time series”, Aalborg University Esbjerg, Semester: CIS 4, 2009. Statistics of Mines of India- Vol. I (Coal), Director General of Mines Safety, Government of India, Controller of Publication, PCIM, 25, 2008(Vol.1)/150-2011(DSK-III), 2011 DGMS Standard Note, 01.01.2007, Publication of Directorate-General of Mines Safety, Ministry of Labour & Employment, Govt. Of India, Dhanbad, India DGMS Standard Note, 01.01.2012, Publication of Directorate-General of Mines Safety, Ministry of Labour & Employment, Govt. Of India, Dhanbad, India DGMS Standard Note, 01.01.2014, Publication of Directorate-General of Mines Safety, Ministry of Labour & Employment, Govt. Of India, Dhanbad, India DGMS Strategic Plan 2011-15, Publication of Directorate-General of Mines Safety, Ministry of Labour & Employment, Govt. Of India, Dhanbad, India
AUTHOR PROFILE
Prof. Anupam Anant Kher is currently working as Assistant Professor, Industrial Engineering at Ramdeobaba College of Engineering and Management. Nagpur. An engineering postgraduate in Mining and Industrial Engineering, he has more than 15 years experience in the field of Teaching, Training and Placement. He currently holds charge of Dean Training and Placement and In-Charge Alumni Association. His interest areas are safety engineering, mine ventilation and energy management. Dr. Rajendra R. Yerpude is currently working as Professor, Department of Mining Engineering at Visvesvaraya National Institute of Engineering (VNIT) Nagpur. He also holds charge of Registrar of VNIT. His areas of interest are Mine Planning, System Engineering, Mine Safety Engineering, Computer applications, and Mine Economics
ISSN : 0975-4024
Vol 7 No 2 Apr-May 2015
726