4.7
APPLICATION OF KNOWLEDGE DISCOVERY FROM DATABASES TO REMOTE WEATHER ASSESSMENT
Michael Hadjimichael*, Richard L. Bankert, Arunas P. Kuciauskas, Kim L. Richardson, Gerard N. Vogel Naval Research Laboratory, Monterey, California
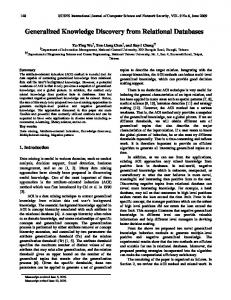
1. INTRODUCTION U.S. Navy weather observing and forecasting operations would be greatly assisted with the immediate assessment of remote meteorological parameters when ground observations are not available. To this end, numerical weather prediction data and satellite data from various sensors and platforms are being used to develop automated algorithms to assist in operational weather assessment and forecasting. Supervised machine learning techniques are used to discover patterns in the data and to develop associated classification and parameter estimation algorithms. These data mining methods, used in a Knowledge Discovery from Databases (KDD) procedure, are applied to cloud ceiling height, rain rate, and rain accumulation estimation at remote locations using appropriate geostationary and polar orbiting satellite data in conjunction with Coupled Ocean/Atmosphere Mesoscale Prediction System (COAMPS) data. Data mining methods have determined an algorithm to diagnose these sensible weather elements more accurately than numerical weather prediction or satellite methods alone. Further detail about the initial design of the study, data, methods, and comparisons to other methods can be found in Hadjimichael el al (1998). Methodology overview and results from the data mining work are presented here.
scientific problem, including astronomy, geophysics, and meteorology. Some of the commonly used data mining methods include inductive machine learning, regression, clustering, summarization, generalization, and dependency modeling.
2. DATA SOURCES In order to discover the relationships between a variety of physical variables, both calculated and measured, a database must be created from a “fusion” of data from various sources. A unique meteorological research tool consisting of a database of COAMPS output, satellite data, climatology, and ground truth observations (METAR) has being created for use in data mining. COAMPS output parameters, coincident satellite parameters (including both geostationary and polar-orbiting data) and climatological information are extracted/computed at 45 METAR observation sites. Automated data collection routines have been written and data has been collected hourly since July, 2000. Data mining techniques have been applied to study cloud ceiling height and rain accumulation diagnosis.
U.S. west coast 1.1 Knowledge Discovery from Databases Data mining is a general term referring to a set of methods for extracting patterns from data. In general, it may apply to both traditional statistical methods, and artificial intelligence machine learning algorithms. Knowledge Discovery from Databases refers to a procedure to using data mining algorithms in a process of studying data to discover useful information (Fayyad et al, 1996a; Weiss and Indurkhya, 1998). KDD has been successfully applied to many * Corresponding author address: M. Hadjimichael, Naval Research Laboratory, Marine Meteorology Division, 7 Grace Hopper Avenue, Monterey, CA 93943-5502; email:
[email protected].
Figure 1. Focus area over U.S west coast. All locations are within the inner grid.
parameters. 10m u-wind
Cloud top (qc) temperature
10m v-wind
Cloud base height (RH)
10m temperature
Sea level pressure
10m dewpoint
Topography height
10m potential temperature LCL
Figure 2. Focus area over Korean peninsula.
PBL depth
CCL
Surface wind stress
Visibility (derived)
Total downward radiation
Ceiling height (derived)
Net radiation
Bulk Richardson number
10m relative humidity
Ground wetness
10m sensible heat flux
Surface albedo
10m latent heat flux
Surface mixing ratio
Ground temperature
Total heat flux
Total rain
z/L
u*
Max vert. velocity in PBL
t*
Max TKE in PBL
q*
10m, 1500m temp diff
Surface roughness
Precipitable water
10m, sfc temperature diff
Cloud coverage
10m, sfc mixing ratio diff
Max mixing ratio in PBL
Cloud base height (qc)
1000mb, 850mb thickness
Cloud top height (qc)
Cloud/No Cloud
Table 1. COAMPS parameters extracted for each of the 45 locations (over 3 focus areas).
Figure 3. Focus area over Adriatic Sea. 2.1 Numerical Model Data COAMPS is the numerical weather prediction model used to generate output values of selected relevant parameters. The model is run in three geographic regions, U.S. west coast, Adriatic Sea, and Korean peninsula, and configured with three nested grids (Figure 1). There are 33 grid levels in the vertical. COAMPS is run for a 12-hour forecast cycle for each of these domain configurations at 00 GMT and 12 GMT each day. Interested readers can find additional COAMPS details in Hodur (1997). The closest land grid point (within each of the 9 km domains) to the 45 (18 West Coast, 14 Adriatic, 13 Korea) METAR stations is determined and COAMPS output values at those grid points for each hour are extracted and written to the database. Table 1 is a list of those COAMPS
In addition to extracting values for the database, COAMPS output can be viewed in static or animated 2D form over the appropriate domains for further interpretation and analysis. 2.2 Satellite Data Data from three geostationary satellites, GOES10, European Meteosat-7, and the Japanese GMS-5 are extracted and added to the database. This data will consist of all channel data at a given pixel whose center is closest to the latitude/longitude of each of the METAR stations. All visible channel data is corrected for the solar zenith angle. In addition to the channel data, a cloud optical depth algorithm (Wetzel et al., 1999) is applied and a GOES-only low cloud product (Lee et al., 1997) is derived, with their respective values extracted and stored. NOAA polar-orbiting Advanced Very High Resolution Radiometer (AVHRR - local area coverage (LAC) and global area coverage (GAC)) data and Defense Meteorological Satellite
Temperature
Wind direction
Vapor pressure
Wind speed
Dewpoint temperature
Wind gust
Altimeter
Weather
Visibility
Total cloud coverage
Ceiling/No ceiling
Lowest cloud coverage
Ceiling height
Cloud coverage fraction and height at all reported levels
Table 2. METAR parameters. Program (DMSP) Special Sensor Microwave Imager (SSM/I) polar-orbiting data are also extracted and stored in the database. The AVHRR LAC and GOES data records include a derived cloud type classification in addition to the channel data. In addition to the various microwave channel va;lues, environmental data records (EDRs) are computed from the SSM/I channel data These parameters include rain rate, cloud liquid water, and precipitable water. Using appropriate COAMPS and satellite data, a cloud top height value is derived for all sensors except the SSM/I. Using satellite-based
algorithms (Turk et al, 2001) rain rate and accumulation values are copmuted from the geostationary satellite data. Similar to the COAMPS output, satellite imagery can be viewed in static or animated 2D form. In addition to this visualization, monitoring tools have been developed to allow for a quick view of model and satellite retrieval performance. 2.3 Ground Truth Data All collected METAR reports for the 45 selected stations are parsed, with sensible weather elements stored in the database. These weather parameters represent the ground truth and are the dependent variables in the subsequent search for patterns which relate satellite and model variables to locally observable parameters. Table 2 is a list of METAR elements. Of the variables in Table 2, Ceiling height is the first parameter examined in the data mining portion of the KDD process. Rain rate and rain accumulation analysis will follow.
3.
DATABASE DEVELOPMENT
2-D
COAMPS
Satellite
1D
Visualization Database
2D
Web interface
METARS
1D
1D
Points filters
2D
Report Parser/filter
Oracle Database
Calculated parameters
Location
Climatology Points filters
Loader EVENT
Loader NWP Calculated parameters
Loader
OBS SAT_1
Figure 4 Data flow and schema. The three continuous data sources (COAMPS, Satellite, METARs), are stored for visualization through a web interface as two dimensional images, and are post-processed for storage in the database management system.
All parameters discussed in the previous section are computed, processed, collected, and stored in a single database. The database tables are updated once a day after all model runs and post-processing has been completed. Each table row represents the available information for a particular location at a specific hour. The flow of data involves five steps: 1. Data generation/collection. 2. Data cleaning and pre-load processing. 3. Data loading in each individual, sourcespecific table. 4. Data post-load processing (calculate/update various derived fields). 5. Data consolidation: generating an Event record (see Figure 2) for each date/time where complete information is available (i.e., data from all three sources). The database is organized in a star schema as shown in Figure 4. The key of each table is the day-time group and the location ID. The Climatology and Location tables are constantvalued reference tables, while the NWP, OBS, and Satellite tables are updated daily with new data, consisting of records for each specific location and day-time group.. Some pre-load steps include: • Time rounding: adjusting the time stamp of METAR reports and satellite points to the closest hour, to correspond with the model data. • Satellite filtering: recognizing missing data. • Satellite derived products: low clouds, cloud optical depth, cloud classifications, environmental data records, etc. • METAR report processing: computation of vapor pressure, cloud/no cloud, variable wind directions, etc. • METAR cleaning: removing duplicate, later corrected, or mislabeled reports. • COAMPS/Satellite combination products: using satellite infrared temperatures together with COAMPS profiles to determine cloud top height. Our data mining tools require as input a denormalized (flat) table. In other words, rows representing the location of interest will be selected from all database tables containing the required information and joined together to form a single Event record of up to 90 variables. Each row will represent all available information for one day/time at one location.
4. METHODOLOGY The primary tools selected for data mining are C5.0 and Cubist (Quinlan, 1992). These were selected for their ease of use and well-recognized robustness. C5.0 generates decision trees, which are used for classification into categories. The Cubist program creates a set of rule-based predictive models, which are used for regressiontype estimation of continuous values. Data was extracted from the Oracle database as a flat, ASCII format file, using Oracle Discoverer. Studies were done on each focus area independently, but combining each data from all locations within each focus area. Studies examining each location independently rarely showed any improvement. This is mostly likely because of the much smaller training set available for an individual location.. The data was randomly evenly divided into training and testing sets, although 10-fold cross validation was also used for error estimates. To achieve the best results, each experiment was decomposed into three components: 1. Determination of cloud presence. We used C5.0 to create a decision tree which could classify each record as “Cloud” or “No Cloud” to indicate cloud presence. 2. In locations with cloud presence, determination of low cloud ceiling (< 1000m) versus high cloud ceiling. Once again we used C5.0 to create a decision tree to classify the “Cloud presence” records. 3. In locations with low cloud, determination of cloud ceiling height is performed using a rule set generated by Cubist. Learning experiments were based on three different sets of variables: 1. COAMPS variables only. 2. Satellite variables only (geostationary satellite for each region). 3. Fused (combined) COAMPS and Satellite variables. 5. RESULTS Our initial work has focused on cloud ceiling, and on the West Coast during daylight hours. Overall, the data mining method outperformed all other methods. We compared it to the COAMPS derived ceiling calculation, as well as the single source variable sets described above. Figure 5-Figure 10 show plots of a sample location, KMRY, in several variations. Figure 5
KMRY low clouds 1000 Ceiling_Ht Predicted 900 800 700 600 500 400 300 200 100 0 0
100
200
300
400
500
600
700
Figure 5. Plot of data mining-predicted low cloud ceiling heights ("Predicted") vs. ground truth ("Ceiling_Ht").
KMRY low clouds (bezier smooth) 1000 Ceiling_Ht Predicted 900 800 700 600 500 400 300 200 100 0 0
100
200
300
400
500
600
Figure 6. Same as previous figure, but with Bezier smoothing of datapoints.
700
KMRY low clouds 10000 Ceiling_Ht Predicted Ceiling corrCBHqc
9000 8000 7000 6000 5000 4000 3000 2000 1000 0 -1000 0
100
200
300
400
500
600
700
Figure 7. Plots of observed ceiling ("Ceiling_Ht"), data mining predicted ceiling ("Predicted"), COAMPS derived ceiling parameter ("Ceiling"), and COAMPS water mixing ratio derived cloud base height ("corrCBHqc").
KMRY low clouds (bezier smooth) 10000 Ceiling_Ht Predicted Ceiling corrCBHqc
9000 8000 7000 6000 5000 4000 3000 2000 1000 0 -1000 0
100
200
300
400
500
600
Figure 8. Same figure as previous, but with Bezier smoothing.
700
KMRY low clouds (0