12th National Convention on Statistics (NCS) EDSA Shangri-La Hotel, Mandaluyong City October 1-2, 2013
APPLICATION OF NEURAL NETWORK MODEL WITH GENETIC ALGORITHM TO PREDICT THE INTERNATIONAL PRICE OF CRUDE PALM OIL (CPO) AND SOYBEAN OIL (SBO)
by Divo Dharma Silalahi
For additional information, please contact: Author’s name Designation Affiliation Address Designation Affiliation Address E-mail
: : : : : : : :
Divo Dharma Silalahi Researcher, Biometry and Database Section Head PT SMART Tbk (Sinarmas Group), Oil Palm Research Station Indonesia Graduate Student Institute of Statistics, University of the Philippines- Los Baños Kaunlaran Road, Los Baños, Laguna, Philippines
[email protected]
Page 1 of 12
APPLICATION OF NEURAL NETWORK MODEL WITH GENETIC ALGORITHM TO PREDICT THE INTERNATIONAL PRICE OF CRUDE PALM OIL (CPO) AND SOYBEAN OIL (SBO) by Divo Dharma Silalahi1
ABSTRACT Neural Networks (NN) are used in artificial intelligence have traditionally been viewed as simplified models of neural processing in the brain. In more practical terms neural networks are non-linear statistical modeling or decision making tools. Genetic Algorithms (GA) are global search method, which is based on some principles like selection, crossover, and mutation. In this paper, genetic algorithm will be used to optimize the network topology in neural network. Which, genetic algorithm has been used to code the combination of effective variables and neural network as a fitness function of the genetic algorithm. This model will be applied in a case study to predict the international price of Crude Palm Oil (CPO) and Soybean Oil (SBO). From the simulation, GANN has simulated and demonstrated the powerful problem solving ability for both of data.
Keywords: Neural Network, Genetic Algorithm, GANN, Crude Palm Oil (CPO), Soybean Oil (SBO), Forecasting, Fitness Function.
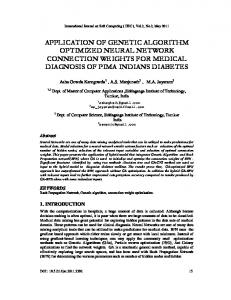
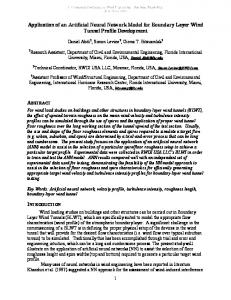
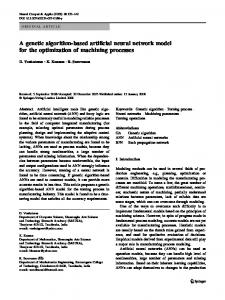
INTRODUCTION Palm oil and soybean oil are the most important commodities in the world. Palm oil is an edible vegetable oil derived from the mesocarp of the fruit of the oil palm (Elaesis guineensis). While, soybean oil is a vegetable oil extracted from the seeds of soybean (Glycine max). Palm oil and soybean oil have some similar used such as an ingredient of foods in cooking and can be refined into various useful chemicals, for example as material for bio-diesel. Comparing to the most productive vegetable oil crop, palm oil yield produced in grater quantity than any other vegetable oil. Soybean oil is the second highest volume of vegetable oil. Referring to United States Department of Agriculture (USDA) reports [1] on January 2012-2013 shows that palm oil to be 34,0% of world vegetable oil production, and soybean oil to be 27,7% (combined 61,6%). The other 7 vegetable oils such as: coconut oil, cottonseed oil, olive oil, palm kernel oil, peanut oil, rapeseed oil, and sunflower seed oil only share the remaining 38,4%. For palm oil world supply and distribution, Indonesia is the largest and Malaysia is the second largest producer. While, for soybean oil world supply and distribution, China is the largest and United States is the second largest producer.
1
Biometrician, SMART Research Institute, PT. SMART Tbk, Indonesia and Graduate Student, Institute of Statistics, University of The Philippines Los Baños, Philippines
Page 2 of 12
World Major Vegetable Oils Supply Jan 2012-2013 Cottonseed 3%
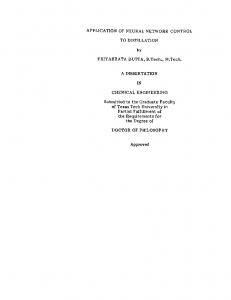
World Palm Oil Supply Jan 2012-2013 Olive 2%
Other 6%
Coconut 2%
Nigeria Thailand2%
Palm 34%
Sunflow erseed 9%
Indonesia 52%
3% Colombia 2%
Soybean 28%
Malaysia 35%
Palm Kernel 4% Peanut 3%
Source: MPOB, Oilw orld
Source: MPOB, Oilw orld
Rapeseed 15%
Figure 1. World major vegetable oils supply
Figure 2. World palm oil supply by country
World Soybean Oil Supply Jan 2012-2013
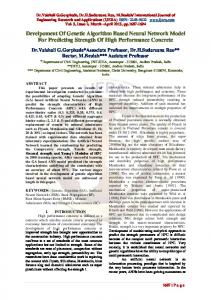
Price of Major Vegetable Oils 1,800
.
China 27% Other 10%
Price ( USD / Metric Ton )
1,600
Mexico 1% India 4% EU-27 5%
United States 20%
Brazil 16%
Source: MPOB, Oilw orld
1,400
1,200
1,000
800
600
Crude Palm Oil
Palm Kernel Oil
Soyabean Oil
Sunflow er Oil
Rapeseed Oil
Coconut Oil
Cotton Oil
400
Argentina 17%
Figure 3. World soybean oil supply by country
2008
2009
2010
2011
2012
Source: MPOB, Oilw orld
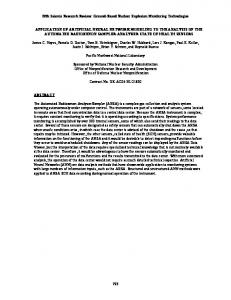
Figure 4. Price of major vegetables oils (average per year 2008-2012)
The values of futures markets arise from the ability to predict the spot prices are important for managing the risks associated with trading a commodity. Therefore, the precise and accurate prediction values are needed to assist the decision making process of the trader. As shown in the graph (Figure 4), the highest international price of major vegetable oils is Coconut Oil (CNO). The medium price is Soybean Oil (SBO), and the lowest price is Crude Palm Oil (CPO). These vegetables oils are traded among a large number of producer and consumer worldwide. Thought that CPO and SBO are the main world vegetables oils, we only interest to study the trend moving among both of these commodities. Some studies in agricultural markets, which interest to analysis the trend of commodity price already done by some researchers. Gupta and Mueller (1982) indicate that long distance and small market are not impediments to price transmission as long as there is efficient informational flow between market centers [2]. Ward (1982) implies the existence of a relationship between assimilation of market information and causality [3]. Baffes and Gohou (2001), shows that there is a strong co-movement between polyester and cotton prices [4]. Brennan (1958) used a model that fixed the supply schedule and argued that the changes in demand determine the relationship between the spot and future prices [5].
Page 3 of 12
Recognizing the problem to find the appropriate statistical method in prediction. In this paper, Neural Network (NN) with Genetic Algorithm (GA) will be applied in a case study to predict the international price of Crude Palm Oil (CPO) and Soybean Oil (SBO). NN is combined with GA to get the optimum value. To search for the optimum, GA requires the predicted value from NN. NN then employs GA to generate parameters as a new input predicts the new output value. Consequently, both GA and NN programs linked-up and exchanged data with each other.
NEURAL NETWORK Neural networks (NN) are algorithms for optimization and learning based on concepts inspired by research into the nature of the brain. It is a machine that is designed to model the way in which the brain performs a particular task or function of interest [6]. A NN consists of four main parts [6]: 1. Processing units u j , where each u j has a certain activation level a j (t ) at any point in time 2. Weighted interconnections between the various processing units, which determine how the activation of one unit leads to input for another unit 3. An activation rule, which acts on the set of input signals at a unit to produce a new output signal 4. A learning rule that specifies how adjusts the weights for a given input/output pair. Due to their ability to derive meaning from complicated data, NN are used to extract patterns and detect trend that are too complex to be noticed by many other computer technique [7]. A trained NN can be considered as an expert in the category of information it has been given to analyze [8]. NN have many advantages as machine learning technique, some of them are adaptive learning, can be linear on nonlinear, and NN have a built in capability to adapt their synaptic weights to changes in the surrounding environment. Neuron is a basic building in NN. McCulloch and Pitts [9] introduced a model of a biological neuron and described a logical calculus of neural networks. Later work by Rosenblatt [10], in which the perceptron was defined. The model of the neuron proposed by McCulloch and Pitts is implemented as a threshold unit. Weighted inputs to the unit are summed to produce an activation signal, and if the activation signal exceeds some threshold value the unit produces some output response. If the activation signal does not exceed the threshold, no output is produced by the unit. Suppose there are n inputs to the threshold unit with weights w1 , w2 , w3 ,, wn and signals x1 , x2 , x3 ,, xn . The activation α of the unit is n
wi xi
(1)
i 1
Page 4 of 12
Threshold Unit W0
X0 Nucleus
X1
W1
X2
W2
Xn
Wn
Sum I
Transfer y
Dendroits Axon
Figure 5. A Sketch of biological neuron
Figure 6. Simple mathematic model for neuron
NN where the hidden neurons have sigmoidal activation function and the output neurons have sigmoidal or identity functions are called Multi Layer Perceptrons (MLP). The networks are ø MLP : R n R m . This architecture consists of an input layer, an output layer and k-hidden layers, each containing j k neurons. Each p-component of y y1 , , y m is released by the m-neuron at the output layer
as a function of the input x x1 , , xn and the parameter of w. Writing in compact from, with weights on the input vectors and d-1 as total number of hidden layers. j1 jd 1 jd 2 n y p : g p wi gi wu wt gt wk xk t 0 i 0 u 0 k 0
Figure 7. Multi-Layer Perceptron (MLP) structure
Page 5 of 12
(2)
For the activation function F, there are various functions that can be used for F; the most common ones include the step function is the sigmoid function [11]. In this work, we used the sigmoid function are the hidden and the output layers. The sigmoid function and it is derivative are defined as: f(x)
f ( x)
1 1 ex
(3)
df ( x) f ( x) * (1 f ( x)) dx
x
Figure 8. Illustration for sigmoid function
GENETIC ALGORITHM Genetic Algorithms (GA) are used as a feature selection tool because of it is advantage consisting global optimization, suitable for discrete search space, and efficient search strategy [12]. GA is defined as algorithms that are used to find approximate solutions to difficult problems through application of the principles of evolutionary [13]. GA use biologically derived techniques such as inheritance, mutation, natural selection, and recombination [14]. Fundamental to understanding the search heuristics of genetic algorithms is Holland’s Schema Theorem [15] and concept of schemata, or similarity templates [12]. In terms pf bit strings defined over the alphabet {0,1}, a schema is simply a template string defined over the expanded alphabet {0,1,*}, where * is a wild-card character. Using this extended alphabet, bit strings can be said to be instances of many different similarity templates, or schemata. GA has demonstrated substantial improvement over a variety of random and local search methods. The GA is based on the laws of natural selection in genetics. The principal idea is to search for optimal solution in a large population. It uses a fixed length binary string called a chromosome to represent a possible solution or individual for a given problem domain. Usually a simple GA consists of three operations: Selection, Crossover, and Mutation.
Page 6 of 12
Parents
Offspring
1 1 0 1 0 0 0 1 1 0
1 1 0 1 1 1 1 0 0 1
0 0 1 0 1 1 1 0 0 1
0 0 1 0 0 0 0 1 1 0 1
Crossover point
Crossover point
Original
Figure 9. Example of single point crossover
Mutation
1 1 0 1 0 0 0 1 1 0
1 1 0 1 0 0 1 1 1 0
Figure 10. Example of single bit mutation Generation of initial individual
Generation of Neural Network
Training Crossover Evaluation
Ranking
Mutation Selection
Figure 11. Flow of GANN system
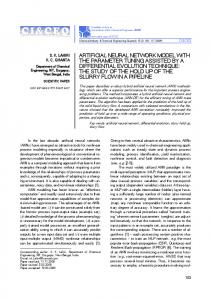
RESULT AND DISCUSSION The daily data of the international price (in USD) of CPO and SBO has been extracted from website (open access) Malaysia Palm Oil Board (MPOB) [16]. Malaysia Palm Oil Board is a government agency responsible for development, promotion and regulation of the palm oil industry in Malaysia. MPOB is one of agencies under the Ministry of Plantation Industries and Commodities and is based in Kuala Lumpur and Selangor. The data was collected from January 2006 to 2nd week of February 2013. Total data for each of commodity price are 366, which 266 data will be separated for training phase and 100 data for testing or validation the model. The trend weekly of the international price of CPO and SBO can be shown below
Page 7 of 12
Weekly Comparison Between the Price of CPO vs SBO (USD/Metric Ton)
Price ( USD/Metric Ton )
.
1800 1600 1400 1200 1000 800 600 400 200
CPO Training data
CPO Testing data
SBO Training data
SBO Testing data
0 0
50
100
150
200
250
300
350
400
Week ( Jan 2006 - Jan 2013 )
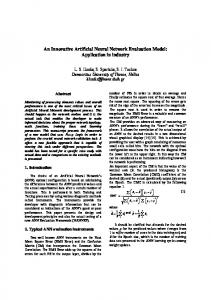
Figure 12. Trend weekly the international price (in USD/Metric Ton) of CPO and SBO
From the graphic shown (figure 12), we know that the trend price of CPO always bellow the SBO commodity. From the statistical descriptive, the average price of CPO from 2006-February 2013 is about USD 845,04 and SBO is about USD 1023,88. The ratio average comparing between the prices of CPO per SBO price is about 0.82 or 82%. In this case, the price of CPO still referring to the CIF Rotterdam of a UK based company called REA. This caused by the small sellers/brokers of Indonesia/Malaysia as the largest producer of this commodity do not have any specific price idea as to what price they should offer to their customers. The MATLAB (R2011b) software has been used for training and testing the data using Genetic Algorithm Neural Network (GANN) model. The first step is to run the test of stationary, ACF, and PACF for training data both of commodity price. In CPO price the highest correlation at lag was founded at lag-1, lag-3, lag-6, and lag-32. Thus, in SBO price at lag-1, lag-6, lag-14, and lag-32. This lag information will be useful as an input variable for GANN process to find the optimum of parameter in hidden layer process of preceptron.
Page 8 of 12
Figure 13. Test of stationary, ACF, and PACF for the CPO price
Figure 14. Test of stationary, ACF, and PACF for the SBO price
To compute the fitness score of each individual, NN is combined with genetic algorithm to get the optimum value. To search for the optimum, genetic algorithm will be used to optimize the network topology in neural network. Which, genetic algorithm has been used to code the combination of effective variables and neural network as a fitness function Page 9 of 12
of the genetic algorithm. Genetic algorithm requires the predicted value from NN. NN then employs GA to generate parameters as a new input predicts the new output value. Consequently, both GA and ANN programs linked-up and exchanged data with each other.
a
b
Figure 15. Fitness training for (a) CPO price , (b) SBO price Table 1. Optimum value of Neural Network parameter for hidden layer and output layer
CPO price
SBO Price
Hidden layer
Output
Hidden layer
Output
wih
bih
who
bho
wih
bih
who
bho
6.772 -6.758 0.367 -8.838
3.492
0.669 -1.241 -5.898 -2.819
7.710
9.844 -5.184 -1.310 -0.720
-1.511
3.844 -1.570 -7.705 9.375
-9.372
-6.952 -4.012 -4.969 -4.838
4.765
-2.664 -1.305 -5.207 -0.664
7.617
-0.154 8.328 2.552 7.370
8.663
-0.718 -4.279 2.101 3.492
-5.325
-7.279 -3.010 1.141 -1.351
6.647
-4.732 0.144 5.177 1.162
2.501
wih is an optimum value from neuron-i at input to neuron-h at hidden layer. bih is a bias from input to hidden layer. Thus, who is an optimum value from neuron-i at hidden layer to neuron- h at output, and bho is a bias from hidden layer to output. Table 2. Performance criteria of GANN on training and testing data
Performance criteria
MAPE MAD
CPO Price Training
SBO Price
Testing
Training
Testing
4.12%
4.11%
2.92%
3.25%
30.871
39.893
29.167
39.958
Page 10 of 12
Performance criteria of simulation using GANN model was referring to MAPE and MAD. MAPE is Mean Absolute Percentage Error and MAD is Mean Absolute Deviation. These performance criteria was calculated by below n
MAPE
n
y t yˆ t /y t t 1
n
x 100%
MAD
(4)
y t 1
t
yˆ t
n
(5)
Based on table 2, MAPE obtained from the simulation was