Cloud Publications International Journal of Advanced Remote Sensing and GIS 2018, Volume 7, Issue 1, pp. 2617-2632 ISSN 2320 – 0243, Crossref: 10.23953/cloud.ijarsg.354 ______________________________________________________________________________________________________
Research Article
Applying Remote Sensing and GIS Techniques to Assess Spatialtemporal Patterns of Land-Use and Land-Cover Changes in Thakhek District of Central Laos Phavanar Sombanpheng, Baodong Cheng, Pradeep Baral, Lingchao Li, Nadia Nora Urriola School of Economics and Management, Beijing Forestry University, No. 35 Qinghua East Road, Haidian District Beijing 100083, People’s Republic of China Correspondence should be addressed to
[email protected] Publication Date: 11 May 2018 DOI: https://doi.org/10.23953/cloud.ijarsg.354 Copyright © 2018. Phavanar Sombanpheng, Baodong Cheng, Pradeep Baral, Lingchao Li, Nadia Nora Urriola. This is an open access article distributed under the Creative Commons Attribution License, which permits unrestricted use, distribution, and reproduction in any medium, provided the original work is properly cited.
Abstract In recent decades, Lao PDR has experienced notable land-use and land-cover changes in the form of tropical deforestation and urban and agriculture land expansion. Accurate measurements of the land-use and land-cover cover changes are crucial in the context of Lao PDR for understanding local and regional changes in climate, the impacts on biodiversity, ecological health, and human welfare. This study aimed at analysing land-use and land-cover changes in Thakhek District located in the central part of Laos for past three decades (1987-2016) using a combination of remote sensing and GIS techniques. Landsat images for individual years were acquired from freely available sources and classified individually using an unsupervised classification module with four land-use and landcover types. The changes in land-use and land-cover were mapped and analysed using a pixel-based post classification comparison technique in GIS environment. The classification results revealed that dense forest was the dominant land-cover type in the study area, followed by agriculture and built-up, open forest and waterbodies. Between 1987 and 2016, more than 27% of the study area changed. The general trend observed was an increase in the extent of agriculture and built-up land, dense forests and waterbodies, and a decrease in the extent of open forests. Majority of the land conversions observed were mutual and reversible. The study demonstrated a practical approach of combining capabilities of remote sensing and GIS to monitor temporal land-use and land-cover changes in tropical montane environments. The findings of the study would form the basis of formulating pragmatic conservation and management strategies of land resources in Thakhek District and elsewhere. Keywords Change detection; Dense forest; Landsat; Land conversion; Spatial pattern of change 1. Introduction Over the past few decades, the natural landscape of Southeast Asia has changed dramatically due to human transformation processes of the land (Leisz et al., 2009; Richards & Flint, 1994; Samek et al., 2012). The processes of changes, particularly deforestation and forest degradation, has been occurring at an unprecedented rate and scale in region (Stibig, Malingreau, & Beuchle, 2001). The region has the highest deforestation rate in the world, about twice that of Africa or South America (Lepers et al., 2005). Deforestation in this regions is primarily attributed to three direct causes: (1)
IJARSG– An Open Access Journal (ISSN 2320 – 0243)
commercial logging, (2) commercial crop plantations, and (3) swidden agriculture, also known as “shifting cultivation” or “slash and burn” (Brady, 1996; Dove, 1993; Kummer & Turner, 1994). The rapid rate of economic development, demographics and poverty are believed to be the underlying drivers of the change (Giri, Defourny, & Shrestha, 2003). In Southeast Asia, Lao People’s Democratic Republic (PDR) still has considerable forest resources with 46.7% national forest coverage (MAF, 2015). However, the forest cover diminished dramatically from an estimated 71.6% of the overall land surface in the 1960s (Thomas, 2015). In addition to deforestation, many natural forests with lower productivity and impaired environmental functions have suffered intensive degradation. Daoroung (1997) reported that up to 85 per cent of the population depend directly on forest areas for farming and means of livelihood, and at least half of the country's population practise some form of swidden agriculture on forest lands to grow upland rice and vegetables. To address this forest decline, the government of Laos has set an ambitious target to increase forest cover up to 70% by 2020 through afforestation, reforestation and stabilization of shifting cultivation (MAF, 2005). Despite the effort, the nation’s forests continue to decline in terms of spatial extent, biodiversity, ecosystem services, rural livelihood benefits and national revenue contribution (Thomas, 2015). While forest cover in Laos has been declining as a whole, a recent study by Bin & Alounsavath (2016) has reported that forest cover in some parts of northern Laos has increased in the past few decades, hinting forest transition towards reforestation. However, in other parts of the country, particularly in the central part, there is a paucity of studies that would support such phenomenon. Moreover, LULC changes in the country are manifested in a variety of phenomena such as urban expansion, agriculture land expansion, agricultural land loss and land abandonment in addition to the forest related changes. Accurate measurements of the land-use and forest cover changes in Laos are crucial for understanding local and regional climate change, the impacts on biodiversity, ecological health, and human welfare. Direct observations and measurements derived from satellite data, particularly the MSS, TM and OLI sensors aboard the suite Landsat spacecraft dating back to the early 1970s, provide empirical data that could be used to document the spatial extent of land cover and land use, and also their rates of change over time. Over the past decades, there has been significant improvements in the availability of remotely sensed data and in their spectral and spatial resolution, and a parallel advance in GIS that has allowed the processing of the large quantity of data generated through remote sensing for change detection studies (Lunetta & Elvidge, 1999). Remotely sensed data has been widely used in generating and updating LULC maps temporal for over four decades now, and LULC change detection has become their major application because of the rich archive and spectral and temporal resolution of satellite images available (Singh, 1989). This study aims to investigate spatial and temporal patterns of land-use and land-cover changes in Thakhek District located in central Laos using remote sensing and GIS techniques for the past three decades. The specific objectives of the study are to: (i) map land-use and land-cover distribution of Thakhek District using a time series of Landsat TM and OLI data for years 1987, 1996, 2006 and 2016, (ii) map and quantify temporal land-use and land-cover changes in the study area during four observation periods (1987-1996, 1996-2006, 2006-2017 and 1987-2016) using GIS overlay of classified maps, and (iii) map and analyse the spatial pattern of land-use and land-cover changes in the study area during stipulated periods. The findings of the study would form the basis of formulating pragmatic conservation and management strategies of land resources in Thakhek District, which might provide incentive to develop similar strategies by other districts of Laos.
International Journal of Advanced Remote Sensing and GIS
2618
IJARSG– An Open Access Journal (ISSN 2320 – 0243)
2. Materials and Methods 2.1. Study Area The study area, Thakhek District, is located between 1734'40" N to 1733'25" N latitude and 10449'30" E and 10449'35" E longitude in Kammoune Province of central Laos (Figure 1) bordering Mekong river and Thailand in the west, Nongbok District in the south, Xebangfay, Mahaxay, Nhommalath and Khamkhuth Districts in the east and Hinboon District in the north. It covers an area of 2 approximately 918 km making it the sixth largest district of the Province. The capital of Thakhek District is Thakhek town. The District has served as a gateway to neighbouring Thailand even before international boundaries were demarcated (Kusakabe, 2004). The eastern side of Thakhek District is mainly mountainous, with an elevation above 500m. In general, the elevation ranges between 70 m mean altitude above sea level (MASL) at the lowest point while 701 m MASL at the highest point. The mountains are characterized by steep terrain, short and narrow valleys having a relatively low agricultural potential. The relatively flat western plains bordering Mekong River are where most agriculture, settlements and urban infrastructure are located. The north-south stretch of Mekong river together with its tributaries that originate in the eastern mountains and flow westwards into the Mekong make an important artery for transportation. Likewise, it is considered as the main water resource in the area. The alluvial plain and terraces along the Mekong and its tributaries are suited for extensive paddy cultivation and livestock raising.
Figure 1: Study area map showing (a) Lao PDR and (b) Thakhek District
The climate of the study area is strongly influenced by the tropical monsoons with distinctly marked wet and dry season intervened by short period of transitional instability. The wet season is characterized by frequent heavy rainfall brought by moisture-laden air of the Southwest Monsoon, International Journal of Advanced Remote Sensing and GIS
2619
IJARSG– An Open Access Journal (ISSN 2320 – 0243)
lasts from May to October. About 75 to 80% of the annual rainfall occurs in the wet season with the peak between June and August. Rainfall distribution in the study area show great spatial variation as a consequence of the topographic effects due to the mountains in the eastern part. The monthly peak occurs in June or July, while the monthly low generally occurs in January. Mean annual precipitation for the area was recorded to be 2,372 mm in 2012. The topographic variation also plays to shape the average temperature in various locations of the study area. Overall, the mean annual temperature ranges between 20.2C and 30.8C, with monthly averages ranging between 13C to 24C in the mountains and 28C to 34C in the plains. Hydrological record at Thakhek station reveal the average 3 -1 annual discharge of Mekong River to be 7,719 m s . Elsewhere in the study area, seasonal runoff pattern of the major rivers is distinct, with discharge peaking normally during July or August. The soils in the plains adjoin Mekong River consist of deep, poorly drained clay to clay loam soils with moderate soil fertility generally suitable for paddy production. The low terraces are located at slightly higher elevation than the flood plains; hence, they are rarely flooded, and are suitable for most agricultural activities practiced throughout the region. According to the recent population and the housing census of 2015, the total population of the study area was 90,491 in 2015 (Lao Statistics Bureau, 2016a), of which 42.4% were urban dwellers, while the rest lived in rural areas with or without access to roads. Poverty incidence in the area is below 4%, one of the lowest in Lao PDR (Lao Statistics Bureau, 2016b). Literacy rate and youth employment rate in the area are high at 94% and 72% respectively. The economy of the area is dominated by rice with some other crops such as tobacco, maize, and vegetable along the Mekong River and its tributaries, and some upland crops (pineapple, sugar cane, and tapioca) in areas with low water resource potential. Upland rice productions using the traditional slash-and-burn are still practiced in mountains of the study area. Compared to many other provinces Khammouane still have considerable forest resources. In many districts the forest cover reaches 70%. Forest in the study area contains valuable species of mixed deciduous forests and dry evergreen forest as well as (largely degraded) dry dipterocarp forests. The area has large commercial forests potential (FOMACOP, 1998). 2.2. Satellite data and pre-processing Landsat Thematic Mapper (TM) and Operational Land Imager (OLI) datasets were selected for LULC analysis of the study area over the past three decades (1987-2016). The reasons for selecting the Landsat imageries are due to their free access, appropriate spatial and spectral resolution, and relevancy to the objective of the study. The satellite dataset used included three Landsat 5 Thematic Mapper (TM) dataset acquired for the years 1987, 1996 and 2006 and one Landsat 8 OLI Thermal Infrared Sensor (TIRS) dataset acquired for year 2016 (WGS 84, UTM zone 48N). All three images were downloaded from the United States Geological Survey’s (USGS) EarthExplorer (https://earthexplorer.usgs.gov/) at full spatial resolution (30 m). The overall image quality was determined from the presence/absence of clouds (with a maximum threshold of 10%), haze, and the relative accuracy of geo-localization. The study area fits in only one Path/Row (127/048) of the Landsat satellites; therefore a mosaic of multiple scenes was not required. Singh (1989) reported that when investigating annual changes, anniversary dates or anniversary windows should be considered as they minimize discrepancies in reflectance caused by seasonal vegetation fluxes, climatic differences and sun angle differences. Targeting similar environmental conditions, acquisition dates were chosen between September and December (Table 1), the early winter months when the imageries are likely to have less contamination from smoke and haze and less ephemeral greenness that occurs mainly during the wetter summer months (Bruce & Hilbert, 2006). After assessing visually for contamination by in-scene components such as clouds and haze, and maximum contaminant free images were included in the study. International Journal of Advanced Remote Sensing and GIS
2620
IJARSG– An Open Access Journal (ISSN 2320 – 0243) Table 1: Details of the Landsat data used
Satellite
Path/Row
Number of Spectral Bands
Spatial Resolution (meters)
Date of Acquisition
Source
Landsat 5 TM
127/040
6
30
27/12/1987
USGS
Landsat 5 TM
127/040
6
30
30/09/1996
USGS
Landsat 5 TM
127/040
6
30
15/12/2006
USGS
Landsat 8 OLI/TIRS
127/040
9
30 (15*)
10/12/2016
USGS
Landsat images were subject to geometric, radiometric and atmospheric corrections before further processing. The majority of change detection methods depend critically upon the accuracy of geometric registration of the images (Singh, 1989). In order to determine accurate measurements from images, this study used image-to-image registration. The images of 1987, 1996 and 2006 were registered against the more recent image from 2016 in ENVI 5.3 (Exelis Visual Information Solutions, Boulder, CO, USA) with overall RMS error of less than 0.25 pixels. For resampling operations, nearest neighbour algorithm was used to maintain radiometric integrity of the registered images. This enabled us to overlay information from different images within a GIS environment to evaluate multi-temporal land cover change. The process of radiometric correction involved conversion of the measured multispectral brightness values to top of atmosphere (TOA) reflectance units. This procedure is crucial especially when creating multi-temporal mosaics as it largely removes variations between the images due to sensor differences, Earth-sun distance and solar zenith angle. ENVI Band Math tool was first used to convert DN to radiance values using gain and offset information for each sensor, and subsequently to TOA reflectance using solar zenith and Earth-sun distance values provided in the header files. The atmosphere distorts imagery by both reducing the energy illuminating a ground object (attenuation) and by acting as a reflector itself, adding a scattered ‘path radiance’ component to the signal detected by a sensor (scatter) (Bruce & Hilbert, 2006). The atmospheric correction methods aim to physically account for one or more of the distorting effects of the atmosphere and thereby convert the brightness values of each pixel to actual reflectances as they would have been measured on the ground (Bruce & Hilbert, 2006). Especially when performing a classification and/or change detection analysis, atmospheric correction is a primary task (Song et al., 2001). In this study, due to the difficulty in finding available atmospheric data (e.g. type of aerosols, visibility of the atmosphere or content of water vapor), a simple image based Dark Object Subtraction (DOS) method (Chavez Jr, 1988) using Band Minimum function in ENVI 5.3 was applied to correct for atmospheric errors. The output image datasets contained pixel values that approximated at-surface reflectance. 2.3. Image Classification Based on various sources, including relevant literature from the study area, field survey, available ancillary data and visual interpretation of 2017 image, a typology of the land use/land cover was adopted comprising four LULC types. They include: (i) Agriculture and built-up; (ii) Dense Forest; (iii) Open Forest; and (iv) Waterbodies. The first LULC type agriculture and built-up include area with seasonal and perennial agricultural crops including coffee and tea plantations, and both terraced and valley agriculture lands. The class also include built infrastructure such as private and public buildings, International Journal of Advanced Remote Sensing and GIS
2621
IJARSG– An Open Access Journal (ISSN 2320 – 0243)
and roads, schools, industries, etc. The reason for merging two Andersen Level 1 (Andersen et al., 1976) classes into a single agriculture and built-up class was due to the difficulty of identifying clear boarder between the two classes which created spectral confusion resulting in misclassifications during a trial classification. We also found a linear relationship between the two, such that neither builtup nor agriculture were significantly affecting the coverage of the other class. However, merging the two created a much cleaner classification output with fewer salt-and-pepper effects. Dense forest type includes trees, shrubs and bushes area with over 50% crown coverage. Conversely, open forest type includes trees, shrubs and bushes area with less than 50% crown coverage. Discrimination of various forest types, which is difficult using medium resolution Landsat datasets, was not a goal of this study, and therefore was not performed. The class waterbodies is self-explanatory in sense it consist of all perennial and intermittent sources of water including lakes, ponds, streams and rivers. The choice of the land use/land cover types was guided by the objective of the research and expected certain degree of accuracy in image classification. Regarding actual classification, due to lack of training samples for all years, either from ground or from high-definition ancillary sources, we resorted to unsupervised classification for all reference years. Unsupervised classification clusters pixels in a dataset based on statistics only, without any userdefined training classes. Of various unsupervised classification techniques available, the Iterative SelfOrganizing Data Analysis Technique (ISODATA) was used in the study. ISODATA unsupervised classification calculates class means evenly distributed in the data space then iteratively clusters the remaining pixels using minimum distance techniques. Each iteration recalculates means and reclassifies pixels with respect to the new means. This process continues until the number of pixels in each class changes by less than the selected pixel change threshold or the maximum number of iterations is reached. ISODATA classification was carried out in ENVI 5.3 using IsoData Classification function with 10 number of iterations and 20 classes for each Landsat image. The resulting classified images contained at least 12 classes, which were then grouped into the classes defined under the classification scheme. The result was a thematic map with four classes for all years. 2.4. Classification Accuracy Assessment A classification is not complete until its accuracy is assessed. Due to lack of reference data for years 1987 and 1996, the accuracy assessment was carried out for classified maps from 2006 and 2016 following a standard procedure described by Congalton & Green (2008). We used Google Earth images from December 2006 and December 2016 as reference data for 2006 and 2016 respectively. Google Earth-based high resolution images are widely adopted for accuracy assessment of classified land cover products (Bahadur, 2009; Olofsson, Foody, Stehman, & Woodcock, 2013; Regmi, Saha, & Balla, 2014; Uddin et al., 2015). Since accuracy assessment assumes that the sample points selected are the true representation of the map being evaluated, an improperly gathered sample will produce meaningless information on the map accuracy (Congalton & Green, 2008; Jensen, 1996). In this study chose an equalized stratified random sampling scheme for selecting sample points of reference data for classification accuracy assessment. 200 sample points with 50 points per class were generated for each of two classified images. It has been suggested that a minimum of 50 reference sample points for each land-use land-cover category be collected for the accuracy assessment of a classified image (Congalton, 1991). The sample points were then used to produce the error matrix, also called a confusion matrix or a contingency table, and accuracy parameters for each time period and LULC types were computed according to (Congalton & Green, 2008). The accuracy parameters used to evaluate each product were (1) producer’s accuracy, (2) user’s accuracy, (3) overall accuracy, and (4) Kappa coefficient. Since we adopted similar classification scheme for all years, we expect accuracies for 1987 and 1996 to be similar to accuracies for 2006 and 2016. International Journal of Advanced Remote Sensing and GIS
2622
IJARSG– An Open Access Journal (ISSN 2320 – 0243)
2.5. Post-Classification Change Detection The change detection was done with multi-date post-classification comparison method, where two independently classified images from different dates are overlaid and compared pixel-by- pixel using a change detection matrix (Lyon et al., 1998). It is the most common approach for comparing data from different sources and dates (Jensen, 1996). The classified maps were first smoothed by using a 3-by-3 majority filter in ENVI 5.3 which removes the isolated pixels and reduces the salt-and-pepper effect (Lillesand & Kiefer, 1994). Post classification comparison was then carried out to determine changes in land cover between periods 1987-1996, 1996-2006, 2006-2016, and 1987-2016. The comparison between the classified maps was for all four periods using ‘Thematic Change Workflow’ module available in ENVI 5.3. The output was a thematic change map with 16 combinations of ‘from-to’ change information and a table with thematic change statistic for each period. The resultant change matrix provides essential information about the nature and spatial distribution of changes, which is very useful in defining change trajectories. Rows in a change matrix display the categories of the staring period, and the columns display the categories of the ending period. Entries on the diagonal line indicate the persistence of each category, while those off the diagonal line indicate transitions from the row category to the column category. From the matrix, a summary table of overall changes per class was created and values were presented in terms of hectares and percentages. 3. Results and Discussion 3.1. Accuracy of Classified Maps Table 2 provides the results of accuracy assessment for classified maps of 2006 and 2016. The producer’s accuracy for class agriculture and built-up, dense forest, open forest and waterbodies for 2006 were 82%, 90%, 88% and 92% respectively. The corresponding user’s accuracies were 89.13%, 88.24%, 80% and 95.83% respectively. Overall classification accuracy of 2006 was 85.50% and the corresponding Kappa coefficient was 0.81. On the other hand, for the classified map of 2016, producer’s accuracy for individual class were 76%, 88%, 82% and 96% respectively for agriculture and built-up, dense forest, open forest and waterbodies. Overall accuracy and the corresponding Kappa coefficient for 2016 were 88% and 0.84 respectively. Both producer’s and user’s accuracies for 2006 and 2016 were consistently high above 80% expect for the class agriculture and built-up in 2016, which may be because of spectral confusion of cultivated areas with open forest. Story & Congalton (1986) stated that Kappa values greater than 0.8 represent a strong agreement between classified map and the real world. This indicates that the image processing procedure developed here has been effective in producing compatible LULC data through time. Table 2: Summary of Landsat classification accuracies for classified maps of 2006 and 2016
LULC Type Agriculture and built-up Dense Forest Open Forest Waterbodies Overall accuracy (%) Kapa coefficient
2006 Producer’s User’s Accuracy (%) Accuracy (%) 82.00 89.13 90.00 88.24 88.00 80.00 92.00 95.83 85.50 0.81
International Journal of Advanced Remote Sensing and GIS
Producer’s Accuracy (%) 76.00 88.00 82.00 96.00
2016 User’s Accuracy (%) 84.44 80.00 82.00 96.00 88.00 0.84
2623
IJARSG– An Open Access Journal (ISSN 2320 – 0243)
3.2. LULC Distribution Classification maps were generated for all four years (Figure 2) and the results are summarized in Table 3. Figure 2(a) depicts spatial distribution of LULC in Thakhek District for the year 1987, while Figure 2(b), Figure 2(c) and Figure 2(d) show for the year 1996, 2006 and 2016 respectively. The results of LULC distribution for all three years showed that forest cover, both dense and open, were the dominant land cover type in the study area (Table 3). Dense forest was prevalent across the district, and particularly dominated the hills and areas of higher slopes in the east and the north. Open forest was more prevalent on the southern and the western part of the district, and usually found bordering agriculture and built-up land as well as in the form of patches inside dense forests. Agriculture and built-up land use dominated the lower slopes and alluvial plains in the western part of the district. Particularly in the south western part of the district, the landscape is heavily modified by human use for agriculture and urban use. Mekong River that makes the western boarder of the district contributed most of the water cover in the study area. However, minor tributaries, streams and ponds were distributed all across the district. Overall, over a period of 30 years, extent of dense forest, agriculture and built up and waterbodies increased while the extent of open forest decreased.
Figure 2: Land-use and land-cover map of Thakhek District for (a) 1987, (b) 1996, (c) 2006, and (d) 2016 International Journal of Advanced Remote Sensing and GIS
2624
IJARSG– An Open Access Journal (ISSN 2320 – 0243) Table 3: Summary of Landsat classification area statistics for 1987, 1996, 2006, and 2017 in hectares (ha) and proportion of the total landscape (%)
LULC Class Agriculture and built-up Dense Forest Open Forest Waterbodies
1987
1996
(ha)
(%)
(ha)
(%)
17121.78
17.36
19927.44
20.21
53054.82 24803.64 3641.13
53.80 25.15 3.69
63266.49 11145.42 4282.47
64.15 11.30 4.34
2006 (ha)
2016 (%)
(ha)
(%)
26570.25
26.94
20372.22
20.66
50021.10 18398.97 3631.77
50.72 18.66 3.68
58302.36 15670.26 4277.25
59.12 15.89 4.34
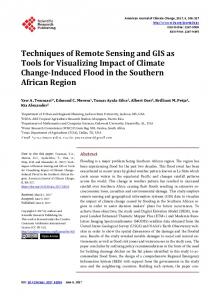
Figure 3: Spatial pattern of LULC changes in Thakhek District between (a) 1987 and 1996, (b) 1996 and 2006, (c) 2006 and 2016, and (d) 1987 and 2016
International Journal of Advanced Remote Sensing and GIS
2625
IJARSG– An Open Access Journal (ISSN 2320 – 0243)
3.3. LULC Change The area statistics of various LULC types in Thakhek District are summarized for each year (Table 2, Figure 3). Dense forest, which is the main vegetation type, occupied 53.80% of the district in 1987, which increased further to 64.15% in 1996, before decreasing to 50.72% in 2006. In 2016, dense forest occupied 59.12% of the district. On the other hand, the area under open forest alternated between periods of gain and loss. Open forest first deceased from 25.15% of the district in 1987 to 11.30% in 1996, before increasing to 18.66% in 2006 followed by a decrease to 15.89% in 2016. Area under agriculture and built-up showed similar pattern. Agriculture and built-up land covered 17.36% of the district in 1987. It then increased to 20.21% in 1996 followed by another increase to 26.94% in 2006, and finally decreasing to 20.66% in 2016. Waterbodies which was the least prevalent LULC type in the district also experienced periods of gains and losses. Waterbodies covered 3.69% of district in 1987, then increased to 4.34% in 1996 before decreasing to 3.68% in 2006 followed by an increase to 4.34% in 2016. Table 4 gives the intrinsic changes in the form of hectare as well as percentage. Dense forest increased by 19.25% during the first period (1987-1996) followed by a decrease by 20.94% in the second period (1996-2006). The third period (2006-2016) witnessed a forest cover gain by 16.5%. Overall, during the entire three decades period, forest cover increased by 9.98%. Open forest, on the other hand, decreased by a massive 55.07% during the first period, and followed by an increase by 65.08% during the second period, which was again followed by a decrease by 14.83% during the third period. Over the period of three decades, open forest decreased by 36.82%. These findings regarding the temporal dynamics forest cover change in Thakhek District mirror recent changes in forest cover and forest use patterns in many parts of Northern Laos. Bin & Alounsavath (2016) reported a forest transition happening in some parts of Northern Laos following transition pathways suggested by Mather (1992). As the economy of the district moves away from traditional agriculture to manufacturing and service-based economy, local farmers are experiencing increased income and improved living standards. Eventually, land pressure has decreased as farmers leave the land and move to urban areas for better paying jobs. As a result, marginal lands become too expensive to manage as cost of labor increases due to labor scarcity; hence, land is eventually abandoned and reverts to forest (Rudel, 2005). In Thakhek, this transition is apparent by the fact that dense forests and open forests moved in exactly opposite paths. More and more open forests were converted to dense forests due to decreased forest disturbance and stricter forest related policies. Agriculture and built up area increased by 16.39% and 33.33% during the first and the second periods, which was followed by a decrease by 23.33% in the third period. Over the entire study period, agriculture and built-up land increased by 18.98%. This may be because of the increased population pressure in the urban areas of Thakhek which has led to an increased demand of agricultural products. Due to the increased demand of agriculture products, local farmers have resorted to forest clearing in order to expand their agriculture fields. However, in the third period the agriculture and builtup area decreased meaning due to effective government land use and forest related policies, much of the forest areas that were encroached during the first and second period were reverted back to forests. Waterbodies (primarily Mekong River) also witnessed an increase by 17.61% during the first period followed by a decrease by 15.19% during the second period and again an increase by 17.77% during the third period. However, these changes might be because of difference in image acquisition date as for 1996, the Landsat image acquired was for the month of September, and seasonal flow in Mekong River peaks from July to September. This might be a possible reason for an increase of approximately 641 ha of water cover in the study area from 1987 to 1996. Meanwhile, closer inspection of LULC maps reveal small pockets of water around agriculture and built-up areas, which are used by local International Journal of Advanced Remote Sensing and GIS
2626
IJARSG– An Open Access Journal (ISSN 2320 – 0243)
farmers for commercial fish farming and which has started to gain momentum very recently. This may be a potential reason for an increased water cover in the study area in the year 2016. Overall, water cover increased by 17.47% over the entire study duration of 30 years. Table 4: Change statistics (in ha and %) of LULC in Thakhek District from 1987 to 2016
LULC types Agriculture and built-up Dense Forest Open Forest Waterbodies
1987-1996 (ha) (%)
1996-2006 (ha) (%)
2006-2016 (ha) (%)
1987-2016 (ha) (%)
2805.66
16.39
6642.81
33.33
-6198.03
-23.33
3250.44
18.98
10211.67 -13658.22 641.34
19.25 -55.07 17.61
-13245.39 7253.55 -650.70
-20.94 65.08 -15.19
8281.26 -2728.71 645.48
16.56 -14.83 17.77
5247.54 -9133.38 636.12
9.89 -36.82 17.47
3.4. Spatial Pattern of Changes Table 5 show the conversion of the land cover in the form of a change matrix for 1987-1996 (Table 5a), 1996-2006 (Table 5b), 2006-2016 (Table 5c) and 1987-2016 (Table 5d). In the table, unchanged pixels are located along the major diagonal of the matrix and are represented in Italics. Approximately 36,345.51 ha (36.85%), 36,639.54 ha (37.15%) and 24,547.68 ha (24.89%) of the total study area landscape changed, respectively, between 1987 and 1996, 1996 and 2006, and 2006 and 2016. During the entire study period from 1987 to 2016, 26,896.50 ha (27.27%) of the landscape changed (Table 5d). A total of 12 possible LULC changes were detected for all periods (off-diagonal values). Most changes are the result of forest improvement, forest restoration in previously agriculture lands, urban expansion and logging. From 1987 to 1996, approximately 3775.14 ha and 3050.10 ha of agriculture and built-up lands were restored back to forest. Spatial pattern analysis (Figure 4a) shows the conversion of agriculture and built up land to forests occurred mainly in the southern part of the district, around Thakhek city. Two land use and forest related policies were consequential in reverting the agriculture lands to forest lands during this period: (a) Tropical Forestry Action Plan of 1989, and (b) Land Use Planning and Land Allocation Policy of 1993 (Lestrelin, 2010). These new policies limited urban expansion in certain forested areas or required certain areas to be maintained under forest cover. As a result, agriculture lands were made to be reforested with locally suitable species of trees. During the same period, 2595.42 ha and 7472.43 ha of dense and open forests were respectively converted to agriculture and built-up land. Spatial pattern of the conversion shows that most of these conversions occurred in the hilly areas of the district where lack of patrolling by the forest agencies saw massive forest conversion to agriculture land, creating distinct patches inside existing forests. Human activities including selective logging and forest clearing were responsible for the conversion of 4739.94 ha of dense forests to open forests. Spatial pattern of dense forest conversion to open forests show that it occurred primarily in the north-eastern hills of the District, leaving distinct patches of open forests inside lush dense forests clearly visible in satellite imageries. Nonetheless, during the same period 13833.09 ha of open forests were converted to dense forests, spatial pattern of which shows those conversions mainly occurred in north-western and south-western parts of the district. This can as well be attributed to stricter land use planning and policies that restricted exploitation of open and degraded forests. As a result, open forests were improved to dense forests. The change matrix also reveals that 82.08 ha of waterbodies were converted to open forests in the study area, which can either be due to classification error or a result of difference in acquisition months as the banks of Mekong river are filled with lush shrubs and bushes after the end of rainy season and before the start of winter season.
International Journal of Advanced Remote Sensing and GIS
2627
IJARSG– An Open Access Journal (ISSN 2320 – 0243)
From 1996 to 2006, 1,846.98 ha and 4596.3 ha of agriculture and built-up lands were converted to dense and open forests respectively. However, during the same period 8430.75 ha and 4104.09 ha of dense and open forests were converted to agriculture and built-up. Spatial pattern of these conversions (Figure 3) reveal that conversions to forests happened in those areas that were converted to agriculture from forests in previous period. The dawn of new millennium brought several global treaties including Kyoto Protocol and the emission reduction mechanisms such as Clean Development Mechanism and Reducing Emissions from Deforestation and Forest Degradation (REDD). As a signatory to Kyoto protocol, Laos started to paying attention to stopping deforestation, forest degradation and restoring degraded forest lands. As a result, few previously deforested lands were restored back to forest lands. However, that did not seem sufficient in case of Laos as even more forests were converted to agriculture and built-up land in areas that are proximate to urban areas in the western part due to increasing population pressure and a shortage of land to support the growing population. During the same period, due to population pressure and an associated increase in the demand of forest products, 11660 ha of dense forests were converted to open forests. Spatial pattern of conversion show that most of these conversions occurred in the periphery of agriculture and built-up lands, implying that existing dense forests are being selectively logged to meet the household and market demand of forest products. During the same period, 645.84 ha of water area was converted to agriculture and built up land. Spatial pattern analysis show that these conversions happened in the banks of Mekong River where the fertility and porosity of the soils make them ideal for agriculture, leading to shoreline encroachment for agriculture. Between 2006 and 2016, 6999.66 ha of agriculture and built-up land was converted to open forest, thanks to forest restoration efforts after the implementation of National Forest Strategy of 2005 that prescribes an increase in the country’s forest cover of 70% in the year 2020 through the rehabilitation of degraded forests and plantation of new forests in areas that were previously forested, together with forest conservation and management by existing community forest users (Phongoudome & Sirivong, 2007). During the same period, 9873.36 ha of open forest was converted to dense forest, also as a result of the enforcement of National Forest Strategy and conservation by community forest users. Spatial pattern analysis reveal that most of the forest restoration and rehabilitation, i.e., conversion from agriculture and built-up to forests and conversion from open forest to dense forest, occurred in the northern part of the district. Overall, between 1987 to 2016, 3188.97 ha and 803.52 ha of agriculture and built-up land were converted respectively to open forest and dense forests, and 10778.31 ha of open forest was converted to dense forest indicating forest restoration and improvement in the study area. These observations concur with previous study by Bin & Alounsavath (2016) that forest transition is definitely happening in some parts of Laos where there is less pressure for commercial rubber plantations. On the contrary, approximately 7400 ha of open and dense forests were converted to agriculture and built-up land, particularly in the southern plains of the study area, suggesting evidence of forest transition and deforestation and forest degradation happening at the same time but at different locations.
International Journal of Advanced Remote Sensing and GIS
2628
IJARSG– An Open Access Journal (ISSN 2320 – 0243) Table 5: Matrices of land-use and land-cover changes (ha) from (a) 1987–1996, (b) 1996–2006, (c) 2006–2016, and (d) 1987–2016 (a) 1987-1996 1987 1996
Agriculture and built-up
Agriculture and built-up
9,826.47
Dense Forest Open Forest Waterbodies 1987 Total
3775.14 3050.1 470.07 17121.78
2006
Agriculture and built-up 13,389.48 1,846.98 4596.3 94.68 19,927.44
Agriculture and built-up Dense Forest Open Forest Waterbodies 1996 Total
1996 Total
Dense Forest
Open Forest
Waterbodies
2595.42
7472.43
33.12
19,927.44
3.96 82.08 3521.97 3641.13
63,266.31 11145.42 4282.2 98,621.37
45,654.12 13833.09 4739.94 3273.3 65.34 224.82 53054.82 24803.64 (b) 1996-2006 1996 Open Dense Forest Forest 8430.75 4104.09 43,162.74 4932.36 11660.4 2007.27 12.6 101.7 63,266.49 11145.42 (c) 2006-2016
2006 Total Waterbodies 645.84 78.93 134.91 3422.79 4282.47
26,570.16 50,021.01 18398.88 3631.77 98,621.82
2006 2016 Agriculture and built-up Dense Forest Open Forest Waterbodies 2006 Total
Agriculture and built-up 17,415.54 1,882.08 6999.66 272.97 26,570.25
Dense Forest 1175.13 46,466.64 1974.78 404.55 50,021.10 (d) 1986-2016 2016
Open Forest 1745.91 9873.36 6686.1 93.6 18398.97
Waterbodies 35.64 80.28 9.72 3506.13 3631.77
2016 Total 20,372.22 58,302.36 15670.26 4277.25 98,622.09 2016 Total
1987
Agriculture Open Dense Forest Waterbodies and built-up Forest Agriculture and built-up 12915.45 2325.24 5047.83 83.61 Dense Forest 803.52 46656.54 10778.31 63.63 Open Forest 3188.97 3786.84 8676.72 17.73 Waterbodies 213.84 286.2 300.78 3476.16 1987 Total 17121.78 53054.82 24803.64 3641.13 Values presented in Italics represent persistence of each land-use and land-cover type.
20372.13 58302 15670.26 4276.98 98621.37
4. Conclusion Information about changing patterns of land use and land cover through time important, not only for planning and management, but also for a better understanding of the relationship between landscape dynamics and ecosystem responses. The approach that combines multi-temporal remotely sensed data to detect dynamics of land-use and land cover changes has demonstrated to be practical in detecting, quantifying and characterizing the spatial-temporal pattern of changes, especially in tropical montane areas such as Thakhek District where accessibility is limited and ground-based inventories are costly. This study highlights the importance of detailed spatial analyses of land-use and land-cover changes, which focuses not only on extent and rate of changes, but also on the spatial pattern of changes. The output land use and land cover maps and change information can be used as inputs to International Journal of Advanced Remote Sensing and GIS
2629
IJARSG– An Open Access Journal (ISSN 2320 – 0243)
land use planning and policy decisions, and predicting future changes. In addition, the methodology developed here to map and assess land use and land cover changes was based on an adequate understanding of landscape features, satellite sensor characteristics and information extraction techniques and is explicitly described, and can be applied in future land use and land cover change studies in this or other districts of Laos. However, as revealed in this study, the new policy and institutional mechanisms promoted by Lao government were not enough to provide a sustainable solution to the problems of land-use and land-cover changes, particularly deforestation and forest degradation. Only an improved understanding of the local drivers can help reveal the processes of dynamics of land-use and land-cover change, including deforestation and forest degradation in at different scales. Future studies should therefore focus on why and how the changes in land-use and land-cover occurred within the socio-economic, policy and institutional and historical context of this landscape, and how those are interconnected with the wider changes occurring at the regional and global level. References Bahadur, K. 2009. Improving Landsat and IRS image classification: evaluation of unsupervised and supervised classification through band ratios and DEM in a mountainous landscape in Nepal. Remote Sensing, 1(4), pp.1257-1272. Bin, K.S. and Alounsavath, O. 2016. Factors influencing the increase of forest cover in Luang Prabang Province, Northern Laos. Forest Science and Technology, 12(2), pp.98-103. Brady, N.C. 1996. Alternatives to slash-and-burn: a global imperative. Agriculture, Ecosystems & Environment, 58(1), pp.3-11. Bruce, C.M. and Hilbert, D.W. 2006. Pre-processing methodology for application to Landsat TM/ETM+ imagery of the wet tropics. Rainforest CRC, 46. Chavez Jr, P.S. 1988. An improved dark-object subtraction technique for atmospheric scattering correction of multispectral data. Remote Sensing of Environment, 24(3), pp.459-479. Congalton, R.G. 1991. A review of assessing the accuracy of classifications of remotely sensed data. Remote Sensing of Environment, 37(1), pp.35-46. Congalton, R.G. and Green, K. 2008. Assessing the accuracy of remotely sensed data: principles and practices. CRC press, 183. Daoroung, P. 1997. Community forests in Lao PDR: the new era of participation. Watershed, 3(1), pp.1-9. Dove, M.R. 1993. A revisionist view of tropical deforestation and development. Environmental Conservation, 20(1), pp.17-24. FOMACOP. 1998. Village Forestry Implementation in Lao PDR: Experiences in the Forest Management and Conservation Program (Unofficial paper for distribution at the 17th Session of the Asia-Pacific Forestry Commission Jakarta, Indonesia). Vientaine Capital, Lao PDR: Forest Management and Conservation Program (FOMACOP).
International Journal of Advanced Remote Sensing and GIS
2630
IJARSG– An Open Access Journal (ISSN 2320 – 0243)
Giri, C., Defourny, P. and Shrestha, S. 2003. Land cover characterization and mapping of continental Southeast Asia using multi-resolution satellite sensor data. International Journal of Remote Sensing, 24(21), pp.4181-4196. Jensen, J.R. 1996. Introductory digital image processing: a remote sensing perspective. 2nd ed. Prentice Hall. Kummer, D.M. and Turner, B.L. 1994. The human causes of deforestation in Southeast Asia. Bioscience, 44(5), pp.323-328. Kusakabe, K. 2004. Women’s work and market hierarchies along the border of Lao PDR. Gender, Place & Culture, 11(4), pp.581-594. Lao Statistics Bureau. 2016a. Results of the population and housing census 2015. Vientaine Capital: Government of Lao PDR, Ministry of Planning and Investment, 282. Lao Statistics Bureau. 2016b. Where are the poor? Lao PDR 2015 based census map: Province and District level results. Vientaine Capital: Government of Lao PDR, Ministry of Planning and Investment, 117. Leisz, S.J., Fox, J. and Rambo, T.A. 2009. Land use changes in the uplands of Southeast Asia: proximate and distant causes. Southeast Asian Studies, 47(3), pp.237-243. Lepers, E., Lambin, E.F., Janetos, A.C., DeFries, R., Achard, F., Ramankutty, N. and Scholes, R.J. 2005. A synthesis of information on rapid land-cover change for the period 1981–2000. AIBS Bulletin, 55(2), pp.115-124. Lestrelin, G. 2010. Land degradation in the Lao PDR: Discourses and policy. Land Use Policy, 27(2), pp.424-439. Lillesand, T.M. and Kiefer, R.W. 1994. Remote sensing and photo interpretation. New York: John Wiley and Sons, 750. Lunetta, R.S. and Elvidge, C.D. 1999. Remote sensing change detection. 1st ed. Taylor & Francis, 350. Lyon, J.G., Yuan, D., Lunetta, R.S. and Elvidge, C.D. 1998. A change detection experiment using vegetation indices. Photogrammetric Engineering and Remote Sensing, 64(2), pp.143-150. MAF. 2005. Forestry Strategy to the Year 2020 of the Lao PDR. Vientaine Capital, Lao PDR: Ministry of Agriculture and Forestry (MAF). MAF. 2015. Forest Cover Assessment 2015. Vientaine Capital, Lao PDR: Ministry of Agriculture and Forestry (MAF). Mather, A.S. 1992. The forest transition. Area, pp.367-379.
International Journal of Advanced Remote Sensing and GIS
2631
IJARSG– An Open Access Journal (ISSN 2320 – 0243)
Olofsson, P., Foody, G.M., Stehman, S.V. and Woodcock, C.E. 2013. Making better use of accuracy data in land change studies: Estimating accuracy and area and quantifying uncertainty using stratified estimation. Remote Sensing of Environment, 129, pp.122-131. Phongoudome, C. and Sirivong, K. 2007. Forest restoration and rehabilitation in Lao PDR. Keep Asia Green, 1(1), pp.1-28. Regmi, R., Saha, S. and Balla, M. 2014. Geospatial analysis of land use land cover change modeling at Phewa Lake Watershed of Nepal by using Cellular Automata Markov Model. International Journal of Current Engineering and Technology, 4, pp.2617-2627. Richards, J.F. and Flint, E.P. 1994. A century of land-use change in South and Southeast Asia. Effects of Land-Use Change on Atmospheric CO2 Concentrations. Springer, 15-66. Rudel, T. 2005. Tropical forests: paths of destruction and regeneration. Columbia University Press, 231. Samek, J.H., Lan, D.X., Silapathong, C., Navanagruha, C., Abdullah, S.M.S., Gunawan, I. and Sanjaya, H. 2012. Land Use and Land Cover Change in Southeast Asia. Land Change Science. Springer, pp.111-122. Singh, A. 1989. Review article digital change detection techniques using remotely-sensed data. International Journal of Remote Sensing, 10(6), pp.989-1003. Song, C., Woodcock, C.E., Seto, K.C., Lenney, M.P. and Macomber, S.A. 2001. Classification and change detection using Landsat TM data: when and how to correct atmospheric effects? Remote Sensing of Environment, 75(2), pp.230-244. Stibig, H.J., Malingreau, J.P. and Beuchle, R. 2001. New possibilities of regional assessment of tropical forest cover in insular Southeast Asia using SPOT-VEGETATION satellite image mosaics. International Journal of Remote Sensing, 22(4), pp.503-505. Story, M. and Congalton, R.G. 1986. Accuracy assessment: a user’s perspective. Photogrammetric Engineering and Remote Sensing, 52(3), pp.397-399. Thomas, I.L. 2015. Drivers of Deforestation in the Greater Mekong Subregion Laos Country Report. USAID Lowering Emissions in Asia’s Forests Program, 38. Uddin, K., Shrestha, H.L., Murthy, M., Bajracharya, B., Shrestha, B., Gilani, H. and Dangol, B. 2015. Development of 2010 national land cover database for the Nepal. Journal of Environmental Management, 148, pp.82-90.
International Journal of Advanced Remote Sensing and GIS
2632