Approaching Software Cost Estimation Using an Entropy-Based Fuzzy k-Modes Clustering Algorithm Efi Papatheocharous and Andreas S. Andreou University of Cyprus, Department of Computer Science, 75 Kallipoleos str., CY1678 Nicosia, Cyprus
[email protected],
[email protected]
Abstract A new software cost estimation approach is proposed in this paper, which attempts to cluster empirical, non-homogenous project data samples via an entropy-based fuzzy k-modes clustering algorithm. The target is to identify groups of projects sharing similar characteristics in terms of cost attributes or descriptors, and utilise this grouping information to provide estimations of the effort needed for a new project that is classified in a certain group. The effort estimates produced address the uncertainty and fuzziness of the clustering process by yielding interval predictions based on the mean and standard deviation of the samples having strong membership within a cluster. Empirical validation of the proposed methodology was conducted using a filtered version of the ISBSG dataset and yielded encouraging results both in terms of practical usage of the clustered groups and of approximating effectively project costs.
1. Introduction Software cost estimation involves the process to foresee the total costs spent during the development of a software product based on several factors, called ‘cost drivers’, and mostly relate with the product to be developed, the engineering process followed and the people engaged in the process. During the last few decades the main cost driver attracting most of the research interest is development effort (typically measured in person-months) [11]. Various attempts have been made over the years to model the correlation between cost drivers essentially utilising project size and duration, and the actual and predicted effort for a project, without a comprehensive solution, as development effort estimation is also affected by project-specific factors, which cannot be easily in-
AIAI-2009 Workshops Proceedings
[231]
cluded in a cost model [1]. The generation of a cost model usually faces serious difficulties due to lack of accurate definitions of the factors involved [9], the nature of the collected data, the non-deterministic range of possible values for the categorical data and the rich number of missing values observed for many projects [1]. The aim of this work is to approximate the issue of software effort estimation by performing a certain type of homogenization and clustering on historical project cost samples. To this end, the ISBSG R9 dataset [8] was employed, which contains an adequate number of past project recordings, but at the same time it suffers from non-homogeneity in terms of recording methods used, counting approaches and interpretation of key project characteristics. Our goal is to identify clusters of similar projects that are sufficiently close to each other so as to use their descriptive characteristics (i.e. cost attributes) for classifying a new project in a certain cluster. The latter is performed according to how close the new project is to the centre of the cluster using a similarity distance. Once this is done the attempt focuses on exploiting the transformation of the effort of the projects participating in the cluster for providing an estimate for the new project. Clustering in our case is performed by a simple and quite promising algorithm, namely the Entropy-Based Fuzzy k-Modes Clustering Algorithm, while the transformation of the participating effort sample in a cluster follows a nearest-neighbors approach. The closely-related clustered projects are utilised to provide effort prediction intervals of minimum width, related to the mean and standard deviation values of the respective effort. Our results thus far suggest that the proposed approach may be considered successful enough as it is able to provide estimations with an accuracy of around 77% on average, while homogenization of data via clustering seems to lead to significantly improved estimations compared to using the dataset as it is. The rest of this paper is organised as follows: Section 2 presents a brief literature overview, while section 3 outlines the algorithm used to extract the project clusters. Section 4 presents the experimental process followed and provides a description of the dataset, along with some preprocessing activities performed. Section 5 discusses the experimental results obtained and finally, section 6, summarises the findings of the paper and suggests future research steps.
2. Literature Overview Estimation methods reported in the software engineering literature of the last 30 years may be classified into the following categories: Expert judgment, Algorithmic and Machine Learning. The latest developments in Machine Learning techniques mostly combine concepts and notions from the area of Soft Computing to form cost estimators or predictors, while a large part of ongoing research concerns data-driven techniques. Data-driven cost estimation is a widely used class of estimation techniques that rely on past project data values
AIAI-2009 Workshops Proceedings
[232]
related to factors affecting costs that are combined in some way attempting to estimate the actual effort level. Researchers suggest that data-driven techniques applied in conjunction with a multiple set of techniques on different subsets of data may produce a range of estimated values instead of crisp values and reduce the inaccuracy degree involved in the estimation [10, 13]. Consequently, the notion of prediction interval, as reported in [4], is a minimum-maximum range of values for the effort estimates, attached with a confidence level with which the actual value of the effort is included in the range. Analogy-based estimation is a widely adopted method in software cost estimation that identifies analogous projects to the one under estimation and uses their data to derive an estimate [10]. The similarity measures between pairs of projects are critical for identifying the most appropriate historical data from which the estimation will be generated. Usually the similarity measures are selected empirically using jackknife-like procedures. Typically, the measures that identify the most similar projects in the majority of the cases are considered as the appropriate ones to use and are applied in every new estimation procedure. However, there are situations where default similarity measures may not be the most appropriate ones. Clustering in general seeks to organise data samples into several subsets by employing a variety of techniques. There are several types of clustering methods, and in particular for software cost estimation fuzzy clustering techniques were examined yielding better figures of adjustment than their crisp equivalents [2]. Various tools and models have been developed proposing that data mining and computational intelligent techniques may be utilised to assist automatic clustering algorithms in finding distinct subsets of highly related concepts in a more efficient manner. In this study, we aim to combine such notions from data-driven, analogy and fuzzy clustering techniques, to deal with the lack of homogeneity present in historical data and introduce improved cost estimates lying within ranges of values. In addition, this study aims to investigate the effect of a set of contributing factors to effort (including numerical and categorical in nature) for clustering, while the proposed approach is utilised to determine suitable groups of software projects for building effort estimation models. In [7] the authors emphasize the importance of establishing homogeneity of the data in an effort estimation model and investigate the effect of clustering in the ISBSG repository. The empirical experiments conducted showed that the estimation accuracy obtained using clustered data is not significantly different compared to that of the ordinary least squares method or using the original data without clustering.
3. Entropy-based Fuzzy k-modes Clustering Algorithm Entropy-based clustering [14] essentially groups similar data samples into clusters based on their entropy values. The goal is to determine the number of clus-
AIAI-2009 Workshops Proceedings
[233]
ters present in the set and identify their centres by traversing the dataset only once. Data samples with many surrounding samples have total entropy values lower than the rest and may be considered as candidates for representing their clusters. A new cluster is initially formed with the sample defined as the cluster centre and then is allocated data samples that have a similarity value higher than parameter β which represents the similarity threshold [14]. The k-modes algorithm was introduced in [6] and was extended to include fuzzy elements to account for uncertainty data samples [5], where the dissimilarity function is altered to a simple matching of the attributes describing the samples in the dataset and thus is not based on the Euclidean distance. In addition, in the fuzzy version of the algorithm the cluster centres are defined by the modal value of each attribute instead of the mean value and their computation relies on the assignment of the most frequent category of each attribute as the representative of the cluster. Let X1 = [x11, x12,…, x1m] and X2 = [x21, x22,…,x2m] be two data samples of a dataset described by m attributes. The dissimilarity between the two samples, d(X1, X2), is given by: d ( X1 , X 2 ) =
m
∑δ ( x j =1
1j ,
x2 j
)
(1)
where: 0, x1 j = x2 j (2) 1, x1 j ≠ x2 j The dissimilarity function in equation (1) is then used to (re)assign a data sample to a cluster. Accordingly, in the case of the hard k-modes algorithm, if object Xi yields the shortest distance with centre Zl in a given iteration, this is represented by setting the value at the nearest cluster to 1 and the values at the rest of the clusters to 0 in the partition matrix W. Formally, for α= 1: 1, if d ( Zl , Xi ) ≤ d ( Zh , Xi ) , 1 ≤ h ≤ k ˆ li = w (3) 0, otherwise In the case of the fuzzy k-modes algorithm, for α > 1, the partition matrix W is given by:
(
)
δ x1 j , x 2 j =
ˆ li w
if Xi = Zl 1, 0, = if Xi Zh , h ≠ l = 1 , if Xi ≠ Zl an d Xi ≠ Zh , 1 ≤ h ≤ k 1 (α − 1 ) k d ( Zl , Xi ) d ( Zh , Xi ) h = 1
(4)
∑
for 1 ≤ l ≤ k, 1 ≤ i ≤ n. This means that if a data sample has exactly the same attribute values with a particular cluster centre, then it will be assigned fully to that cluster and not at all to the rest. Otherwise, the data sample will be
AIAI-2009 Workshops Proceedings
[234]
characterised by a membership degree for each cluster denoting its partial membership in the cluster [12].
4. Experimental Approach This section describes the proposed methodology for effort estimation which involves the following five-steps: (i) data preparation, (ii) entropy-based clustering, (iii) fuzzy k-modes clustering, (iv) selection of groups of suitable projects, and (v) investigation of effort prediction within the retrieved software projects. The selection of the main attributes to experiment with was based on a step-wise attempt to clean, homogenize and obtain a satisfactory portion of the ISBSG dataset described by both numerical and categorical attributes. A holdout sample technique was used in each experiment repetition with 75% of the project samples used for performing the clustering of the data (i.e. training set) and 25% being utilised during the evaluation (i.e. testing set).
4.1.
Dataset description, cleaning and fuzzification
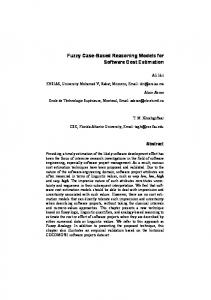
The dataset utilised in the experiments is obtained from the International Software Benchmarking Standards Group (ISBSG R9) [8]. This dataset contains an analysis of multi-organisational, multi-application domain and multienvironment software project cost data. The initial release of the dataset used contains 100 characteristics and 3024 project data grouped in categories describing data quality, project size, effort, productivity, schedule, software quality, architecture, documents and techniques, project and product attributes. The dataset is rich in samples but may be considered biased and fairly heterogeneous, having many inconsistent or null project values. To alleviate this problem a large part of data was removed, especially in cases where the data reported was considered irrelevant to cost prediction, or where the values or technique used to gather or report the values were found inadequate according to directions issued by the ISBSG. Secondly, the dataset went through a series of preprocessing steps for selecting attributes according to some data pruning principles which led to a clean, consistent, categorical dataset, as all numerical attributes underwent a fuzzy transformation [15] to host linguistic values. The fuzzy transformation of the numerical attributes was performed by determining the degree to which they belong to each of the appropriate fuzzy sets via membership functions [15]. For each numerical cost attribute variables mi, ni, ai and bi were calculated (1≤i≤n, and n is the number of linguistic terms in the classification table being analyzed) according to equations (5)-(8) and after following the fuzzification illustrated in Figure 1 [3].
AIAI-2009 Workshops Proceedings
[235]
mi = min value of linguistic term Ti in classification table m + mi +1 ni = i 2 ai = ni −1 bi = mi +1
(5) (6) (7) (8)
Fig. 1. Fuzzification values of numerical attributes
The filtered ISBSG dataset that was finally utilised in the experiments comprised 50 columns and 424 rows with the following project attributes: Count Approach, Adjusted Function Points, Project Elapsed Time, Implementation Year (a new column extracted from the column previously named Implementation Date in the original ISBSG dataset), Development Type, Organization Type, Development Technique, Functional Sizing Technique, Development Platform, Language Type, Primary Programming Language, Database System, Recording Method, Resource Level, Max Team Size and Average Team Size. The dependent variable was the Full-Cycle Work Effort which was also a newly formed column from the original ISBSG dataset, containing only the summary work effort values accounted for all the development phases and not adjusted to include parts of the effort values from phases that were not measured.
4.2.
Fuzzy k-modes clustering and effort estimation
Clustering was performed using the training set of data samples and the Entropy-based algorithm that defined the cluster centres as suggested by [12] and was briefly described in the previous sections. The algorithm computes the number of clusters k with their respective initial cluster centres that will be used by the fuzzy k-modes algorithm. Finally, the fuzziness exponent α defines the level of fuzziness that will be adopted by the clustering process. At the validation step, we aimed to isolate smaller areas within each cluster which conform to the new project in question. The attributes of the new project are matched against the final cluster centres produced as a result of the previous clustering procedure isolating the nearest centre using the partition matrix W as explained before. Thus, we retrieve the most similar projects from the repository by calculating the membership degree of each project in the cluster for which its centre is closer to the new project. Then, a cut-off limit is used to reduce the selected set of projects that should respond to a similarity measure, called φ, applied for the surrounding projects, which represents a value for level of confidence. The cut-off limit is constructed by defining an upper and lower
AIAI-2009 Workshops Proceedings
[236]
bound based on the value of the new project’s membership degree to the closest cluster centre. For experimentation purposes, this was set to ±10% meaning that, for instance, if a new project was assigned a membership degree of 60% in the search cluster, then the projects retrieved would have membership degrees between 50%-70%. The confidence level, which ensures that only the closest projects falling between the +10% and -10% radius distance from the new project are selected, was set to the minimum values of 75% and 85% similarity threshold degree (φ)respectively. The final step of the methodology is to relate the derived fuzzy clusters of specific degrees with effort predictions and overall assess the areas selected within the clusters produced. The membership and similarity parameters mentioned above essentially filter out the dissimilar and irrelevant projects to the new one; the mean effort value and standard deviation of the actual effort values of the projects kept is then computed. The predicted effort value of the new project is estimated to lie within the range [mean effort value (mean) ± standard deviation (std)]. One exception to the aforementioned range is the case where the standard deviation is greater than the mean, in which we take the lower bound of the interval to be equal to zero. In general, our aim is to offer bounded estimation intervals of the minimum possible width, rather than single point value predictions, yielding more general estimates on one hand, but of a more informative nature on the other, and somehow with encapsulation of the inherent estimation uncertainty. Additionally, we attempt to assess the relative accuracy of estimation intervals by using the validation set of data mentioned earlier (testing) and measure the percentage of the projects in this set that have their estimated effort values lying within the range [mean−std, mean+std]. We call this the Hit Ratio (HR) of the corresponding estimation process and we report it in the results section that follows. Additionally, we try to evaluate the reliability of our approach by comparing in percentage terms the interval size calculated (reported as width) with the Overall Size (OS) and the Cluster Size (CS) computed using the actual minimum and maximum effort values contained in the overall training and the clustered samples respectively. These two supplementary metrics essentially measure how much shrinking of the effort estimation interval the method has achieved relatively to the “worst” case, which is the width of the initial available set of projects and to the intermediate stage where projects are filtered via clustering and therefore their range of values to use for estimations is narrowed. This OS and CS metrics assist in evaluating how good our estimation intervals really are.
5. Experiments and Results The results of applying the entropy-based and fuzzy k-modes algorithm on the preprocessed data, as previously described, are presented in this section. Firstly, we experimented with the entropy algorithm to locate the cluster cen-
AIAI-2009 Workshops Proceedings
[237]
tres (k) and subsequently we implemented hard clustering. Secondly, we applied the fuzzy k-modes algorithm, produced the fuzzy clustering results and studied the influence of the dataset to the parameters. Experiments were carried out with variations of the ISBSG dataset as follows: Experimental dataset EDS1 included all available project characteristics plus the effort; all project characteristics excluding effort constituted EDS2; removing the outliers from EDS1 and EDS2 based on the box plots of the effort sample values resulted datasets EDS3 and EDS4 respectively; finally, using EDS3 and adjusting the weight of the effort variable to reach the dominant significance level of 51% in the clustering process compared to the rest of the attributes, produced dataset EDS5. Similarity parameter β and fuzzy exponent α were varied, taking values from the sets {0.3, 0.4, 0.5, 0.55, 0.6, 0.7, 0.8, 0.9} and {1.1, 1.2, 1.3, 1.4, 1.5, 1.6, 1.7, 1.8} respectively. Table 1 summarizes the best results obtained with respect to the width of the estimation (or prediction) interval and the hit ratio. Table 1. Results obtained with the fuzzy k-modes algorithm using various experimental datasets (EDS) EDS
β
α
k
φ OS (%) CS (%) HR (%) mean effort std effort
width
1
0.55 1.5 42 0.75
7.80
49.09
38.68
12727.77
5843.59 11687.19
2
0.7
1.2 95 0.75
10.16
49.39
50.94
7885.80
7614.47 15228.94
3
0.4
1.4
6 0.85
2.26
67.68
36.17
1711.81
1695.34
3390.68
4
0.3
1.8
3 0.85
2.39
67.45
28.72
1931.39
1788.68
3577.36
5
0.8
1.7 25 0.75
1.60
37.92
76.60
2030.93
1198.76
2397.53
The results reported indicate relatively large prediction intervals in most of the cases, except EDS1 and EDS5, with standard deviations being lower than the means in all cases. Moreover, a mediocre hit ratio performance is observed, which amounts to approximately 30-40% hits for EDS1, EDS3 and EDS4 and slightly over 50% hits for the EDS2. The accuracy of the predicted effort values is significantly improved in the EDS5 case; the hit ratio is quite high suggesting that estimations produced lay within the calculated width in nearly 77% of the cases. It is worth noticing that when the effort attribute participates in a dataset performance is improved (cases EDS1 and EDS3 in comparison with EDS2 and EDS4 respectively). This outcome suggests that the effect of previous values for the attribute being estimated leads to forming better clusters. One may argue that the participation of effort samples in the clustering process may bias results, but this is not true; past effort values are treated by the algorithm as descriptors of the behavior of effort in relation with the rest of the participating factors. Hence, what effort samples offer is essentially a way to map cost factors onto the effort attribute and form knowledge about how effort evolves. Additionally, the narrower widths obtained with EDS3 and EDS4 confirm that when extreme values are removed from the datasets the estimation performance is again improved. Overall, EDS5 yielded the most promising results and was thus further analyzed through additional experimentation reported in Table 2.
AIAI-2009 Workshops Proceedings
[238]
The results reported in Table 2 indicate that the std of the effort values is consistently lower than the mean value reported, while the prediction intervals yielded are quite low and thus more useful to project managers. Furthermore, independently to the fuzzy k-modes parameters tested, the overall diversity of the results throughout the dataset is small. Recalling that EDS5 involves all available attributes including the effort variable, the latter acting both as a filter for outliers and at the same time playing a decisive role in the clustering process as the most significant attribute, it is obvious and to a large extent logical, that practically this variable improves clustering results in terms of projects homogenization. The dataset indicates a significantly better picture with relatively narrower widths, while the best results achieved a spread of approximately 2398 man-hours (mh), with a mean effort value of 2031mh and a corresponding standard deviation of 1199mh. The HR degree in relation to both OS and CS degrees reported suggest that clustering data in small segments has been achieved: The derived interval in the best case is 17% of the initial and 38% of the clustered one. Another observation worthy of mentioning is that the best results consistently suggest k=25 as the “optimal” number of clusters, while parameters βand αassume the values of 0.8 and 1.7 respectively. Table 2. Further results obtained after experimentation with EDS5 (φ=0.75) β
α
k
0.8
1.7
25
1,60
37.92
76.60
2030.93
1198.76
0.8
1.5
25
1,88
39.69
76.60
2294.23
1406.38
2812.76
0.8
1.8
25
1,92
38.74
45.74
2206.57
1433.75
2867.49
0.9
1.7
104
1,93
50.20
62.77
2625.31
1440.06
2880.12
0.9
1.5
104
1,94
77.48
62.77
2647.77
1452.07
2904.14
OS (%) CS (%) HR(%) mean effort std effort
width 2397.53
At this point we should mention that we attempted to compare our findings with the results of a simple k-nearest-neighbors (k-nn) algorithm. Preliminary k-nn results exhibited larger intervals (widths), which may be considered inferior to those of our approach, with better HR values as expected. Due to space limitations, though, these results will not be presented here. The basic assumption under investigation in the present paper was that homogenizing samples in distinct clusters that share common values for certain cost factors contributes to achieving successful effort estimations. The results above lead us to infer that this assumption is partly supported; one has to be cautious, though, as regards generalization of this argument as this was not the case for all datasets used, at least to the extent to which small estimation intervals were produced. This, of course, may be the result of a number of causes which should be further investigated as part of our future work, examining the effect each cause may have on clustering, and hence the associated effort estimation processes. For example, one possible cause may be the fact that resemblance of a project with a cluster centre used to assign the former as a member of that
AIAI-2009 Workshops Proceedings
[239]
cluster with degree r is measured only in terms of how many factors are identical, not which exact factors are matched. Thus, this should be further analyzed and assessed so as to contribute to improving the estimation process.
6. Conclusions A new methodology has been presented in this paper which attempted to improve the means for selecting clusters of project data from a large repository to address the problem of software cost estimation. Specifically, the proposed methodology employed entropy-based and fuzzy k-modes clustering to suggest an innovative project clustering for the ISBSG R9 repository and obtain effort estimation (prediction) intervals for new projects based on the similarity of cost attributes. The methodology identifies clusters of similar projects and then classifies a new project in a certain cluster according to its resemblance with the cluster centre. Projects in this cluster which are closely-related within a specified degree of resemblance to the new project are isolated and then their effort values are utilised to provide an estimation interval for the effort of the new project. Our ultimate goal was to apply an already successful clustering algorithm and reduce the heterogeneous nature of our data repository, something which was performed successfully. The clustering of the projects in homogeneous groups according to their specific characteristics may be considered a small novel step forward in the area of software cost estimation where the attribute space is multi-dimensional. Even though it would be extremely useful to exploit such information provided by the clusters formed and achieve improved effort predictions, as targeted by this paper, we may not claim that the results obtained are optimal. After performing and evaluating a preliminary set of experiments conducted it became evident that there is ample room to improve the results of the algorithm possibly using better encoding and parameter set-up. Finally, as regards the clustered projects achieved by the method, they could be proven more valuable in estimating effort if they were utilised by other techniques and be employed as an intermediate input to other cost models performing point estimations. Examples of such techniques that could possibly work better when provided with clustered data rather than the original ones are regression, inductive learners, decision trees etc. Thus, such approximations could capture more efficiently correlations among various parameters of the project other than effort, such as productivity, schedule, team size etc. Our future research plans will address the above and consider examining how processed and clustered datasets may be studied in a homogeneous setting allowing dependencies between cost factors to be brought to light. To this end, hybrid forms of cost models may be employed, having the clustering module as the feeding platform of the input values satisfying certain cost attribute characteristics and a cost model for refining the estimation intervals by applying further processing either in a data-
AIAI-2009 Workshops Proceedings
[240]
driven, quantitative form (e.g. prediction with artificial neural networks), or in a qualitative manner (e.g. fuzzy cognitive maps or influence diagrams).
References [1] Angelis, L., Stamelos, I., and Morisio, M.: Building A Software Cost Estimation Model Based On Categorical Data. Proceedings of the 7th International Symposium on Software Metrics, IEEE Computer Society, p. 4 (2001) [2] Aroba, J., Cuadrado-Gallego, J.J., Sicilia, M., Ramos, I. and García-Barriocanal, E.: Segmented software cost estimation models based on fuzzy clustering. Journal of Systems and Software, Vol. 81, pp. 1944-1950 (2008) [3] Braz, M.R., Vergilio, S.R: Using Fuzzy Theory for Effort Estimation of Object-Oriented Software. In Proceedings of the 16th IEEE International Conference on Tools with Artificial Intelligence. pp. 196-201 (2004) [4] Gruschke, T.M., Jørgensen, M.: The role of outcome feedback in improving the uncertainty assessment of software development effort estimates. In ACM Transactions of Software Engineering Methodology. Vol. 17, pp. 1-35 (2008) [5] Huang, Z. and Ng, M.K.: A Fuzzy k-Modes Algorithm for Clustering Categorical Data. IEEE Transactions on Fuzzy Systems, Vol. 7, No. 4, pp. 446-452 (1999) [6] Huang, Z.: Extensions to the k-Means Algorithm for Clustering Large Datasets with Categorical Values. Data Mining and Knowledge Discovery, Vol. 2, No. 3, pp. 283-304 (1998) [7] Huang, S.-J., Chiu, N.-H and Liu, Y.-J: A comparative evaluation on the accuracies of software effort estimates from clustered data. Information of Software Technology 50, pp.879888 (2008) [8] International Software Benchmarking Standards Group (ISBSG), Estimating, Benchmarking & Research Suite Release 9, ISBSG, Victoria, (2005) http://www.isbsg.org/ [9] Kitchenham, B., Hughes, R., Linkman, S.: Modeling software measurement data. IEEE Transactions on Software Engineering 27 (9), 788–803 (2001) [10] MacDonell, S.G., Shepperd, M.J.: Combining Techniques to Optimize Effort Predictions in Software Project Management. Journal of Systems and Software, Vol. 66, No. 2, Elsevier, Amsterdam, pp. 91-98 (2003) [11] Sommerville, I.: Software Engineering. Addison-Wesley Longman Publishing Co., Inc. (2007) [12] Tsekouras, G.E., Papageorgiou, D., Kotsiantis, S., Kalloniatis, C. and Pintelas, P.: Fuzzy Clustering of Categorical Attributes and its Use in Analyzing Cultural Data. International Journal of Computing Intelligence (WASET), Vol. 1, No. 2, pp. 123-127, ISSN 1304-2386 (2005) [13] Xu, Z., Khoshgoftaar, T. M.: Identification of Fuzzy Models of Software Cost Estimation. Fuzzy Sets and Systems, Vol. 145, No. 1, Elsevier, pp.141-163 (2004) [14] Yao, J., Dash, M., Tan, S.T., Liu, H.: Entropy-based Fuzzy Clustering and Fuzzy Modeling. Fuzzy Sets and Systems, Vol. 113, No. 3, pp. 381-388 (2000) [15] Zadeh, L.A.: Fuzzy Set. Information and Control, Vol. 8, pp. 338-353 (1965)
AIAI-2009 Workshops Proceedings
[241]