Abstract. Smart meters are increasingly being deployed to measure electricity ... Keywords: smart, meter, anomaly, attack, detection, auto, regressive, moving ..... may dispatch a technician to manually verify the integrity of the neighbor's meter.
Disclaimer: This document is not the final version of the paper. The final version can be found in the proceedings of the 10th International Conference on Critical Information Infrastructures Security (CRITIS 2015)
ARIMA-Based Modeling and Validation of Consumption Readings in Power Grids Varun Badrinath Krishna, Ravishankar K. Iyer, William H. Sanders Information Trust Institute, Advanced Digital Sciences Center Department of Electrical and Computer Engineering, University of Illinois at Urbana-Champaign, 1308 West Main Street, Urbana, IL 61801, USA {varunbk,rkiyer,whs}@illinois.edu http://iti.illinois.edu
Abstract. Smart meters are increasingly being deployed to measure electricity consumption of residential as well as non-residential consumers. The readings reported by these meters form a time series, which is stored at electric utility servers for billing purposes. Invalid readings may be reported because of malicious compromise of the smart meters themselves, or of the network infrastructure that supports their communications. Although many of these meters come equipped with encrypted communications, they may potentially be vulnerable to cyber intrusions. Therefore, there is a need for an additional layer of validation to detect these intrusion attempts. In this paper, we make three contributions. First, we show that the ARMA model proposed in the anomaly detection literature is unsuitable for electricity consumption as most consumers exhibit non-stationary consumption behavior. We use automated model fitting methods from the literature to show that first-order differencing of these non-stationary readings makes them weakly stationary. Thus, we propose the use of ARIMA forecasting methods for validating consumption readings. Second, we evaluate the effectiveness of ARIMA forecasting in the context of a specific attack model, where smart meter readings are modified to steal electricity. Third, we propose additional checks on mean and variance that can mitigate the total amount of electricity that can be stolen by an attacker by 77.46%. Our evaluation is based on a real, open dataset of readings obtained from 450 consumer meters. Keywords: smart, meter, anomaly, attack, detection, auto, regressive, moving, average, integrated, electricity, theft, cyber-physical, ARIMA, ARMA, forecasting, critical, infrastructure, security, measurements
1
Introduction
The Industrial Control Systems Cyber Emergency Response Team (ICS-CERT) within the U.S. Department of Homeland Security works to reduce risks within and across all critical infrastructure sectors. They recently published an incident response letter describing an unauthorized access to an electric utility’s control 1
Disclaimer: This document is not the final version of the paper. The final version can be found in the proceedings of the 10th International Conference on Critical Information Infrastructures Security (CRITIS 2015) system network [11]. Further, a network host-based forensic analysis led them to find that the utility’s network was likely exposed to multiple security threats. In order to defend against these attacks, they have proposed the use of monitoring and detection methods, without making specific recommendations. In this paper, we present specific algorithms that a utility can use to verify the integrity of readings reported by smart meters that measure electricity consumption. In the U.S. alone, 50 million such smart meters had been deployed by utilities as of July 2014 [12]. Our data validation methods are envisioned to run on centralized servers in each of these utilities, where the reported measurements from all these meters are accessible. In addition to the well-known benefits of smart meters, such as automated data collection and estimation of the state of the electric distribution grid, utilities such as BC Hydro believe that these meters would aid them in detecting electricity theft [3]. This belief was challenged in 2010, when the Cyber Intelligence Section of the FBI reported that smart meters were hijacked in Puerto Rico, causing electricity theft amounting to annual losses for the utility estimated at $400 million [7]. Given this report of the compromise of a smart meter installation, large-scale smart meter rollout efforts could potentially increase the likelihood that other smart meter installations could be compromised. In addition to electricity theft, other attacker models in the context of Advanced Metering Infrastructure (AMI) are discussed in [4]. In [20], we suggest that an attacker may destabilize a real-time electricity market system by compromising the electricity price relayed to consumers. Equivalently, it may be possible to destabilize the system by compromising smart meter consumption readings, causing suppliers to respond to the demand by modifying the electricity price. It must be noted that smart meters, such as those manufactured by GE [5], are equipped with encrypted communication capabilities and tamper-detection features. However, as discovered by ICS-CERT, reliance on these mechanisms alone is not sufficient to ensure total defense against cyber intrusions that exploit communication vulnerabilities. The anomaly detection methods presented in this paper assume that an attacker has compromised the integrity of smart meter consumption readings, and aim to mitigate the impact of such an intrusion. How the attacker can get into a position where he is capable of modifying communication signals is not a focus of this paper and is discussed in [13], [15], and [16]. Our aim is to validate the data reported to the utility by modeling the normal consumption patterns of consumers and looking for deviations from this model. We use data-driven insights on consumption characteristics, similar to our award-winning work that employs Principal Component Analysis [2]. Also, our algorithms for intrusion detection are specific, as opposed to high-level guidance for network administrators given in [4] and [11]. The Auto-Regressive Moving Average (ARMA) and Auto-Regressive Integrated Moving Average (ARIMA) models are used to predict future data points in a time series. ARIMA forecasting is used to predict annual electricity consumption in [17] and hourly electricity prices in [6]. We predict electricity consumption at a half-hour granularity using ARIMA models. 2
Disclaimer: This document is not the final version of the paper. The final version can be found in the proceedings of the 10th International Conference on Critical Information Infrastructures Security (CRITIS 2015) In this paper, we make three contributions. First, we show that the ARMA model proposed in the anomaly detection literature [14] is unsuitable for electricity consumption as most consumption behavior is non-stationary. We use cross-validation techniques in [10] to show that first-order differencing of the consumption data makes the data weakly stationary. Thus, the ARIMA model is a better model for capturing consumption behavior and forecasting future behaviors. Second, we evaluate the effectiveness of ARIMA forecasting in the context of a specific attack model, where smart meter measurements are modified in a way that leads to electricity theft. Third, we propose additional checks that can mitigate the total amount of electricity that can be stolen by an attacker by 77.46%. Our evaluation is based on an open dataset of meter readings from a real deployment with 450 consumers.
2
Dataset Used in the Study
The data we used was collected by Ireland’s Commission for Energy Regulation (CER) as part of a trial that aimed at studying smart meter communication technologies. This is the largest, publicly available dataset that we know of. The fact that the dataset is public makes it possible for researchers to replicate and extend this paper’s results. We evaluate our models and algorithms on 450 consumers from this dataset. For each of these consumers, the smart meter readings are collected at a half-hour time resolution, for a period of up to 74 weeks. The consumers include 377 residential consumers, 18 small and medium enterprises (SMEs), and 55 unclassified by CER. We assume that this dataset is free from maliciously compromised measurements, and use the data to understand normal consumption behavior.
3
Modeling Approach
The underlying assumption of the ARMA model is that the time series data is weakly stationary. Stationary data has three characteristics: (1) the mean is constant, (2) the variance is constant and (3) the covariance of the signal with itself at different time lags is constant. We define a weakly stationary signal as one that fails condition (1), but satisfies conditions (2) and (3). The moving average component of ARMA automatically adjusts for changing means, so condition (1) is not important for the suitability of ARMA for a given time series. For the electricity consumption time series of a single consumer at time t, given by the value of Xt , the ARMA model is defined as follows: Xt = c + �t +
p X
αi Xt−i +
i=1
q X
βj �t−j
(1)
j=1
In the auto-regressive component, Xt is an affine function with intercept c of the time signal at p previous time points Xt−i with linear coefficients αi . The 3
Disclaimer: This document is not the final version of the paper. The final version can be found in the proceedings of the 10th International Conference on Critical Information Infrastructures Security (CRITIS 2015)
1.0
1.0
0.8
0.8
Auto-Correlation Function
Auto-Correlation Function
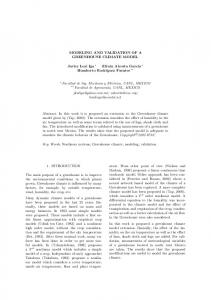
moving average component of ARMA handles weakly stationary signals that do not have constant means. It assumes that i.i.d Gaussian noise �t ∼ N (0, σ�2 ) compounds over q time periods to contribute linearly to the signal Xt with coefficients βj . The ARMA model does not handle largely changing covariance in nonstationary signals. Fig. 1(a) illustrates the Auto-Correlation Function (ACF) for a single consumer. The ACF is the correlation of the time series with itself at a specified lag. We extract the time series for a single consumer and depict the ACFs for 350 half-hour lags. There are 336 half-hours in a week, so the figure captures a little over a week. As expected, high auto-correlation was observed for this consumer at multiples of 48 half-hour (or 1 day) time periods. These high correlations persist for all lags throughout the consumption history captured in the dataset. Further, the plot demonstrates failure of the third requirement for stationarity since the ACFs change significantly over time. This lack of stationarity implies that the ARMA model would fail to provide a reliable prediction of the next point in the time series. The ACFs need to rapidly decrease to constant or insignificant values in order for the ARMA model to reliably work. The rate of ACF decrease will determine the model order.
0.6 0.4 0.2 0.0 0
50
0.6 0.4 0.2 0.0 0.2
100 150 200 250 300 350 Half-hour lags
(a) ACFs without differencing
0
50
100 150 200 250 300 350 Half-hour lags
(b) ACFs with first-order differencing
Fig. 1: Auto-Correlation Function of the time series signal of a single consumer. The lag is in terms of half-hour time periods. We propose an alternative model, the ARIMA model, which has an additional differencing term. We find that first-order differencing causes rapidly decreasing ACFs for consumers who have non-stationary consumptions. First-order differencing modifies the ARMA model in Equation (1) as follows. Instead of predicting the next value in the time series, we predict the difference between the current and next value in the time series as a linear function of past differences.
Xt − Xt−1 = c + (�t − �t−1 ) +
p X
αi (Xt−i − Xt−i−1 ) +
i=1
q X j=1
4
βj (�t−j − �t−j−1 ) (2)
Disclaimer: This document is not the final version of the paper. The final version can be found in the proceedings of the 10th International Conference on Critical Information Infrastructures Security (CRITIS 2015)
Residential SME Unclassified
1
450 400 350 300 250 200 150 100 50 0
0
Number of Consumers
In essence, a linear model fits the gradients of the points as opposed to the points themselves. After applying first-order differencing, we observe Fig. 1(b). Clearly, the ACFs are close to zero beyond 3 time lags. Therefore, the order of the ARIMA model is finite. In addition, the order is small (p and q are around 3), which is important to ensure minimal computational costs.
Differencing Order Required
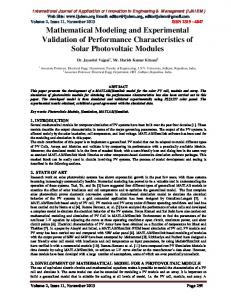
Fig. 2: Distribution of differencing order among consumers of different types.
We have applied first-order differencing and observed its benefits for one consumer, but visual inspection is impractical for our dataset of 450 consumers. Therefore, we employ the Hyndman-Khandakar algorithm [10] to estimate the model order. This method combines cross-validation techniques, unit root tests, and maximum likelihood estimation. The results of the Hyndman-Khandakar algorithm are as follows. While the autoregressive (p) and moving average order (q) range from 0 to 5, the differencing order is either 0 or 1. A minority of consumers (35 out of 450, or 7.78%) have stationary consumption patterns and thus the ARMA model proposed in [14] is appropriate for this minority. However, for 92.22% of consumers, first-order differencing is required, justifying our ARIMA model proposal. The distribution of consumers, segregated by consumer type is captured in Fig 2. Once the ARIMA model is estimated, the next consumption point in the time series Xt is forecast. From this point forecast, a 95% confidence interval C is constructed with the assumption of i.i.d. Gaussian errors �t as described in [1]: C = Xt ± 1.96σ�
(3)
Here 1.96 comes from the fact that 95% of the standard normal distribution lies within [-1.96,+1.96]. Recall that σ� was the standard deviation of the i.i.d. 5
12 10 8
Actual Consumption Utility Forecast 95% Confidence Interval
6 4 2 0 0
10
20 30 Half hour of the week
40
Averaged Electricity Demand in kW
Averaged Electricity Demand in kW
Disclaimer: This document is not the final version of the paper. The final version can be found in the proceedings of the 10th International Conference on Critical Information Infrastructures Security (CRITIS 2015)
(a) ARIMA prediction for Consumer 1
0.185 0.180 0.175
Actual Consumption Utility Forecast 95% Confidence Interval
0.170 0.165 0.160 0.1550
10
20 30 Half hour of the week
40
(b) ARIMA prediction for Consumer 2
Fig. 3: ARIMA forecasting of points and 95% confidence intervals.
Gaussian errors �t in 1. The prediction by ARIMA and the confidence intervals for two different consumers are illustrated in Fig. 3. In this paper, we propose the use of these confidence intervals for anomaly detection. If a smart meter reading lies outside these intervals, we say with 95% confidence that it is anomalous. Also note that there is an order of magnitude difference between the consumptions of these two consumers and that the confidence intervals for Consumer 2 in Fig. 3(b) are relatively tighter, because of lower variance in consumption patterns. Tighter confidence intervals are preferred, as faults or attacks become easier to detect. In our dataset, the consumers do not produce electricity and sell it back to the grid, so the consumption is never negative. Thus, the lower bound of the confidence interval is only useful if it is positive, as negative readings reported by smart meters are naturally anomalous. Note that the lower bound for Consumer 1 in Fig. 3(a) goes negative, while it stays positive for Consumer 2. The reason why the lower bound goes negative is due to the symmetry in the Gaussian error assumption that is inherent in ARIMA and ARMA models. However, in future scenarios where consumers supply to the grid, or consume a negative amount of electricity, a negative lower bound of the confidence interval will become useful.
4
Electricity Theft Attack Model
The ARIMA confidence interval provides a bound on the measurements and serves as a good detector for invalid measurements for faulty meters. However, these bounds are not sufficient to detect attacks in which the attacker has full knowledge of the system. We consider a specific attack model in which the attacker steals electricity from a neighbor for monetary gain. Let the attacker’s consumption at time t be At and the neighbor’s consumption be Xt . The attacker compromises his neighbor’s smart meter and has it report a consumption of Xt0 > Xt . At the same time, the attacker under-reports his own consumption by compromising his meter’s reading to A0t = At − (Xt0 − Xt ). Therefore, he steals a positive amount from the neighbor of (Xt0 − Xt ). He gets billed for 6
Disclaimer: This document is not the final version of the paper. The final version can be found in the proceedings of the 10th International Conference on Critical Information Infrastructures Security (CRITIS 2015) A0t < At while the neighbor gets billed for Xt0 > Xt . Note that balance checks (discussed by researchers at Mitsubishi [18]) at upstream points on the electric distribution network would find that the expected sum as reported by the smart meters (Xt0 + A0t ) matches the measured sum of (At + Xt ). Thus, the attacker has averted the balance check. In order to do so, he has increased his neighbor’s smart meter consumption readings. Without the ARIMA detection mechanism in place, the attacker can steal an arbitrary amount of electricity. He is only constrained by the physical limits of the electric distribution system. Specifically, electric distribution lines are rated based on the maximum current that they can carry. If the demand from the attacker increases (while the distribution voltage is kept approximately constant by reactive power compensation), the current in the distribution lines will increase. This generates heat in the form of I 2 R losses, where I is the current and R is the resistance. If the current increases beyond the rated threshold, the lines will exceed their thermal limits. The ensuing damage may lead to blackouts or other equipment failures, which are an obvious indication of anomalous consumption. Therefore, we assume that the attacker would try to avoid detection by operating in a way that his own consumption is within these physical limits. A detailed study on these physical limits can be found in [21]. 4.1
ARIMA Attack
In order to avoid detection in the presence of ARIMA-based detection thresholds, the attacker needs to ensure that the neighbor’s consumption remains within the 95% confidence interval. If he steals more electricity from the neighbor, the utility will find that the neighbor’s consumption exceeds the upper bound of the confidence interval and is anomalous. On discovering this anomaly, the utility may dispatch a technician to manually verify the integrity of the neighbor’s meter. Such investigations are already being made periodically [8]. In this section, we assume the worst-case scenario in which the attacker has full information and can estimate the 95% confidence intervals just as well as the utility can. The optimal value for the attacker to steal is the maximum that he can steal while averting detection. This point is reached at the 95% confidence threshold. Thus the attacker over-reports the neighbor’s consumption as the 95% threshold point as shown in Fig 4. Since this attacks averts the ARIMA-based detector, we refer to it as the ARIMA attack. The ARIMA detector has bounded the attack, and the maximum electricity stolen from the neighbor is given by the difference between the ARIMA Attack curve and the Actual Consumption curve. In order to detect the attack, the statistics of the window can be compared against statistics of previous windows. Specifically, if the observed mean µ0 lies in the interval [min({µ}), max({µ})] and the observed standard deviation σ 0 lies in the interval [min({σ}), max({σ})], then we say the new point is not a suspected attack. Here {µ} and {σ} are the sets of means and standard deviations observed in historic data. For the sake of standardization, we assume in our simulations that each statistic (µ and σ) is calculated on a window of a week in the historic 7
12
Actual Consumption ARIMA Attack Utility Forecast 95% Confidence Interval
10 8
Averaged Electricity Demand in kW
Averaged Electricity Demand in kW
Disclaimer: This document is not the final version of the paper. The final version can be found in the proceedings of the 10th International Conference on Critical Information Infrastructures Security (CRITIS 2015)
6 4 2 0 20
10 0 10 Half hour of the week
20
12
Actual Consumption ARIMA Attack Utility Forecast 95% Confidence Interval
10 8 6 4 2 0 300
(a) Zoomed In (±12 hours)
200
100 0 100 200 Half hour of the week
300
(b) Zoomed Out (±1 week)
12
Actual Consumption Integrated ARIMA Attack Utility Forecast 95% Confidence Interval
10 8
Averaged Electricity Demand in kW
Averaged Electricity Demand in kW
Fig. 4: Illustration of an ARIMA attack on a neighbor. The attack is launched at time 0 on the horizontal axis.
6 4 2 0 20
10 0 10 Half hour of the week
20
(a) Zoomed In (±12 hours)
12
Actual Consumption Integrated ARIMA Attack Utility Forecast 95% Confidence Interval
10 8 6 4 2 0 300
200
100 0 100 200 Half hour of the week
300
(b) Zoomed Out (±1 week)
Fig. 5: Illustration of Integrated ARIMA attack on a neighbor using the Truncated Normal Distribution. The attack is launched at time 0 on the horizontal axis. data. Therefore, the cardinality of {µ} and {σ} is the number of weeks in the utility’s smart meter data archive. 4.2
Integrated ARIMA Attack
As security researchers and practitioners, it is important for us to think about how an attacker may evade our own checks, as no check is completely foolproof. In our case, we find that, despite checks on the mean and standard deviation, it is possible for the attacker to steal electricity. He may do so by generating false consumption readings using a Truncated Normal distribution. This distribution is specified by a range, mean and standard deviation. By setting the range to the ARIMA confidence intervals, the attacker averts detection by the ARIMA detector. In addition, he can set the mean to the extreme point max({µ}) to avert 8
Disclaimer: This document is not the final version of the paper. The final version can be found in the proceedings of the 10th International Conference on Critical Information Infrastructures Security (CRITIS 2015) the check on the mean. At the max({µ}) value, the mean quantity of electricity stolen is maximized while being undetectable. Finally, he can set the standard deviation to the extreme point min({σ}) to avert the standard deviation check. We assume that he wants to minimize the standard deviation to minimize the variability that he needs to incorporate into his own consumption. If the attacker were to steal electricity from multiple consumers, the variability would add up, making it difficult for him to match with his own consumption in order to pass the balance check. Since this attack averts all these integrated checks, we called it the Integrated ARIMA attack and it is illustrated in Fig. 5. It can be seen that the Integrated ARIMA attack curve has significantly higher variance as compared to the ARIMA attack curve in Fig. 4. However, its mean is lower, so we expect less electricity to be stolen under the Integrated ARIMA attack. The trade-off for the attacker is that the Integrated ARIMA attack is harder to detect.
5
Quantitative Evaluation
450 400 350 300 250 200 150 100 50 00
Number of Consumers
Number of Consumers
In this section, we present a simulation study of the ARIMA and Integrated ARIMA attacks for the set of 450 consumers in the dataset. We built the attack simulations using Python, with bridges to the R Forecast library by Hyndman and Khandakar [10]. The Integrated ARIMA attack used truncated normal random number generators, so we ran 50 simulation trajectories for each consumer in order to reduce the bias in our random samples. The massive computation requirements for this simulation occupied 70 CPU cores in our TCIPG testbed over the course of a full week.
1000
2000 3000 4000 Electricity Stolen (kWh)
5000
450 400 350 300 250 200 150 100 50 00
1000
2000 3000 4000 Electricity Stolen (kWh)
5000
(a) Maximum electricity stolen by means (b) Maximum electricity stolen by means of the ARIMA attack of the Integrated ARIMA attack
Fig. 6: Distribution of maximum electricity stolen from each consumer through ARIMA and Integrated ARIMA attacks. The maximum amounts of electricity stolen for both the ARIMA attack and the Integrated ARIMA attack were calculated, and histograms of the results are given in Fig. 6. It is clear that much less electricity is stolen due to the Integrated 9
Number of Consumers
Disclaimer: This document is not the final version of the paper. The final version can be found in the proceedings of the 10th International Conference on Critical Information Infrastructures Security (CRITIS 2015)
160 140 120 100 80 60 40 20 00
20 40 60 80 % Reduction in electricity stolen
100
Fig. 7: The maximum electricity stolen from each consumer through an Integrated ARIMA attack is less than an ARIMA attack. The distribution of the percentage reduction is shown. For most consumers, a large reduction is seen. ARIMA attack as compared to the ARIMA attack. This serves to quantify the benefit of adding the additional checks on mean and standard deviation. The improvement seen, as a percentage for each consumer, is given in Fig. 7. Up to 99.4% reduction in theft can be achieved with the checks on mean and variance. The aggregated results across all 450 consumers are as follows. For a period of 1 week, the attacker managed to steal 285, 914 kWh under the ARIMA attack and 64, 447 kWh under the Integrated ARIMA attack. That is a reduction of 77.46%. Therefore, the additional checks played a major role in mitigating the attack. We quantify the monetary benefit to the attacker by multiplying the electricity stolen with the latest $/kWh rate posted by the Pacific Gas and Electric Company (PG&E) for residential services [19]. This rate is $0.16/kWh, and the corresponding profits for the attacker under the ARIMA and Integrated ARIMA attacks are $45, 746 and $10, 311, respectively. These numbers tell us how much the attacker stands to gain under the assumption that he has full information about the system and the ability to control the meter readings reported. On the other hand, if the attacker had lesser capabilities, the attacks would be either easily detected or significantly mitigated by our proposed methods. Note that, throughout this paper, we have spoken of an attacker in the singular. We have not, however, made any assumptions that restrict our analysis and results to a single attacker. Our sample of 450 consumers is large enough to demonstrate that it is unlikely that a single attacker will be able to steal the ARIMA attack upper bound of 285, 914kW (averaged over an hour), due to the physical limits of distribution lines that connect his consumption facility to the nearest transformer. However, it would be possible for multiple attackers on different distribution lines to collude and steal this amount. The dynamics of collusion between multiple attackers is a subject for future work. 10
Disclaimer: This document is not the final version of the paper. The final version can be found in the proceedings of the 10th International Conference on Critical Information Infrastructures Security (CRITIS 2015)
6
Conclusion and Future Work
In this paper, we evaluated the suitability of the ARMA and ARIMA models for forecasting electricity consumption behaviors. These forecasts produced confidence intervals using the ARIMA assumption that noise is normally distributed. The confidence intervals served as a first layer of validation for faulty smart meter measurements. In order to detect and mitigate well-crafted electricity theft attacks, additional checks needed to be put in place, and we proposed checks on mean and variance. We showed that an electricity theft attack is feasible despite these checks, but the amount of electricity that can be stolen under this attack is up to 99.4% less than what was stolen without these checks in place. The reduction in electricity stolen, aggregated over all consumers, was 77.46%. In future work, we will explore ways to improve the ARIMA forecasting method by incorporating seasonalities. Since consumption patterns repeat daily or weekly, as seen by the seven daily peaks in Fig 1(a), there is inherent seasonality that is not captured in our low-order ARIMA models. Incorporating seasonalities may not help in tightening the confidence intervals to improve detection, because the first-order differencing may flatten out seasonalities as shown in Fig 1(b). Nevertheless, we have observed cases where the seasonalities still persist after this differencing has been done. We have not been successful in investigating these cases, because the seasonalities are at large lags of 48 half-hour periods. We have found that dealing with such high order seasonalities requires computational processing power and memory beyond the capabilities of our most powerful servers. This computational issue is well-known in the forecasting community [9], and solutions are worth exploring for future work. Acknowledgments. This material is based upon work supported by the Department of Energy under Award Number DE-OE0000097 and the Siebel Energy Institute. The smart meter data used in this paper was accessed via the Irish Social Science Data Archive at www.ucd.ie/issda. The providers of the data, the Commission for Energy Regulation, bear no responsibility for the further analysis or interpretation of it. We thank Jenny Applequist, Jeremy Jones and Timothy Yardley for their support, and Prof. Douglas L. Jones for his feedback.
References 1. Forecasting with ARIMA Models, https://onlinecourses.science.psu.edu/ stat510/node/66 2. Badrinath Krishna, V., Weaver, G.A., Sanders, W.H.: PCA-Based Method for Detecting Integrity Attacks on Advanced Metering Infrastructure. In: Quantitative Evaluation of Systems. Lecture Notes in Computer Science, vol. 9259, pp. 70–85. Springer International Publishing (2015) 3. BC Hydro: Smart metering program (2014), https://www.bchydro.com/ energy-in-bc/projects/smart_metering_infrastructure_program.html
11
Disclaimer: This document is not the final version of the paper. The final version can be found in the proceedings of the 10th International Conference on Critical Information Infrastructures Security (CRITIS 2015) 4. Berthier, R., Sanders, W.H., Khurana, H.: Intrusion Detection for Advanced Metering Infrastructures: Requirements and Architectural Directions. In: Proceedings of IEEE SmartGridComm ’10. pp. 350–355. IEEE (Oct 2010) 5. ComEd: Safeguarding data through smarter technology (2014), https: //www.comed.com/documents/technology/grid_mod_fact_sheet_security_ 2014_r2.pdf 6. Contreras, J., Espinola, R., Nogales, e.a.: ARIMA models to predict next-day electricity prices. IEEE Transactions on Power Systems 18(3), 1014–1020 (2003) 7. Cyber Intelligence Section: Smart grid electric meters altered to steal electricity (May 2010), http://krebsonsecurity.com/wp-content/uploads/2012/04/ FBI-SmartMeterHack-285x305.png 8. Edison Electric Institute: Smart Meters and Smart Meter Systems : A Metering Industry Perspective p. 35 (March 2011), http://www.eei.org/issuesandpolicy/ grid-enhancements/documents/smartmeters.pdf 9. Hyndman, R.J.: Forecasting with long seasonal periods (September 2010), http: //robjhyndman.com/hyndsight/longseasonality/ 10. Hyndman, R.J., Khandakar, Y.: Automatic Time Series Forecasting: The forecast Package for R. Journal of Statistical Software 27(3), 1–22 (7 2008) 11. ICS-CERT: Internet accessible control systems at risk (2014), https: //ics-cert.us-cert.gov/sites/default/files/Monitors/ICS-CERT_Monitor_ %20Jan-April2014.pdf 12. Institute for Electric Efficiency: Utility-Scale Smart Meter Deployments (September), 1–11 (2014) 13. Jiang, R., Lu, R., Wang, L., Luo, J., Changxiang, S., Xuemin, S.: Energy-theft detection issues for advanced metering infrastructure in smart grid. Tsinghua Science And Technology 19(2), 105–120 (April 2014) 14. Mashima, D., Cardenas, A.A.: Evaluating electricity theft detectors in smart grid networks. In: Proceedings of RAID’12, vol. 7462, pp. 210–229. Springer Berlin Heidelberg (2012) 15. McLaughlin, S., Holbert, B., Zonouz, S., Berthier, R.: AMIDS: A multi-sensor energy theft detection framework for advanced metering infrastructures. In: Proceedings of SmartGridComm’12. pp. 354–359 (Nov 2012) 16. McLaughlin, S., Podkuiko, D., Miadzvezhanka, S., Delozier, A., McDaniel, P.: Multi-vendor penetration testing in the advanced metering infrastructure. In: Proceedings of ACSAC’10. pp. 107–116. ACM, New York, NY, USA (2010) 17. Mohamed, Z., Bodger, P.: Forecasting Electricity Consumption A comparison of models for New Zealand. In: Electricity Engineers’ Association of New Zealand Annual Conference. pp. 1–15. No. 64 (2004), http://ir.canterbury.ac.nz/handle/ 10092/821 18. Nikovski, D.N., Wang, Z., Esenther, A., Sun, H., Sugiura, K., Muso, T., Tsuru, K.: Smart meter data analysis for power theft detection. In: Proceedings MLDM’13. pp. 379–389. Springer-Verlag, Berlin, Heidelberg (2013) 19. PG&E: Electric schedule e-1. residntial services (February 2015), http://www.pge. com/tariffs/tm2/pdf/ELEC_SCHEDS_E-1.pdf 20. Tan, R., Badrinath Krishna, V., Yau, D.K., Kalbarczyk, Z.: Impact of integrity attacks on real-time pricing in smart grids. In: Proceedings of ACM CCS’13. pp. 439–450. ACM, New York, NY, USA (2013) 21. Wan, H., McCalley, J., Vittal, V.: Increasing thermal rating by risk analysis. IEEE Transactions on Power Systems 14(3), 815–828 (1999)
12