3 Faculty of Medicine, University of Tours. Tours, France ... and classification of different grades of placenta by artificial ... 8, Issue 5, No 3, September 2011.
IJCSI International Journal of Computer Science Issues, Vol. 8, Issue 5, No 3, September 2011 ISSN (Online): 1694-0814 www.IJCSI.org
Artificial Neural Network for Transfer Function Placental Development: DCT and DWT Approach Mohammad Ayache1, Mohamad Khalil2 and Francois Tranquart3 1
Department of Biomedical, Faculty of Engineering, Islamic University of Lebanon Khalde Highway, BP 30014, Lebanon 2
Faculty of Engineering, Lebanese University Tripoli, Lebanon 3
Faculty of Medicine, University of Tours Tours, France
Abstract The aim of our study is to propose an approach for transfer function placental development using ultrasound images. This approach is based to the selection of tissues, feature extraction by discrete cosine transform DCT, discrete wavelet transform DWT and classification of different grades of placenta by artificial neural network and especially the multi layer perceptron MLP. The proposed approach is tested for ultrasound images of placenta, resulting in 75% success rate of classification using DCT and 92% using DWT. The method based on multi resolution decomposition analysis and on supervised neural network technique MLP, seems a good method to study the transfer function of placental development in ultrasound. Keywords: Placenta, discrete cosine transform, discrete wavelet transform, neural network, MLP.
1. Introduction An ultrasound diagnostic system has become an important and popular diagnostic tool due to its wide range of applications. The non-invasive, non-destructive nature of ultrasound, real-time imaging and portable system are the advantages over the medical imaging system such as Xray, CT and MRI. Due to these advantages of ultrasound diagnostic system, it has been extensively used in the medical profession. An ultrasound diagnostic system, which has been widely used in the field of medical diagnosis, transmits ultrasound signals to a target and receives echo signals reflected from the target to form an ultrasound image. The ultrasound diagnostic system generally uses a wide bandwidth transducer to transmit and receive ultrasound signals. The received signals are beam-formed and passed in the several processes to form an ultrasound image. Diagnostic ultrasound is generally perceived by users and patients as a safe technique with no adverse effects. Since ultrasound is
so widely used in pregnancy, it is essential for all practitioners to ensure that its use remains safe. However it is difficult to differentiate between normal and abnormal tissues on the basis of ultrasound images from the placenta. The placenta is a vascular organ formed in the uterus during pregnancy, consisting of both maternal and embryonic tissues and providing oxygen and nutrients for the fetus and transfer of waste products from the fetal to the maternal blood circulation. A study of placental development in ultrasound is needed to evaluate the different grades of normal placental maturation and assess the transfer function and detect abnormalities, particularly those that may be responsible for a premature birth or intrauterine growth retardation. Grannum [1], due to a visual approach, classifies the placental grades into 4 different grades. The goal of the research work in the present paper is to classify automatically the grade of the placenta based on advanced image processing techniques such that discrete wavelet transform DWT and discrete wavelet transform DCT. In the literature, there are different methods that can be used to extract the images in order to make the diagnosis. Wavelet transforms [2] Fourier transform [3], discrete cosine transform [4], [5] and continuous wavelet transform [6] can be used to extract parameters from ultrasound images. Statistical parameters are used for the texture analysis [7]. Wavelet is used for the detection of the micro calcification mammograms [8]. Discrete wavelet transform DWT and discrete cosine transform DCT are used in our study for image processing and feature extraction. Artificial neural network ANN and especially the multi layer perceptron MLP is used for the image classification. ANN is widely used for medical image classification [9] [10].
21
IJCSI International Journal of Computer Science Issues, Vol. 8, Issue 5, No 3, September 2011 ISSN (Online): 1694-0814 www.IJCSI.org
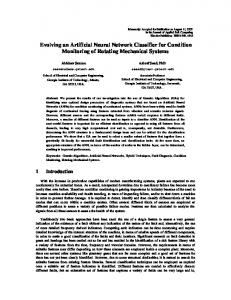
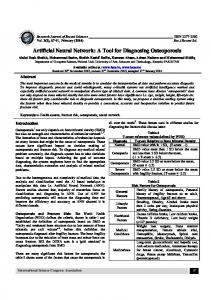
2. Material, Methods and Problem Statement One hundred normal pregnant volunteers were scanned in Bretonneau Hospital (Tours, France). The gestational age varied from 21 weeks to 36 weeks. Conventional ultrasound units (Sequoia 512, Siemens; Voluson 530, GE) were used to obtain two dimensional ultrasound images. Only anterior and lateral placentas were considered to avoid any interference with the baby and to allow a more valuable characterization. Data were stored during a sweep of the transducer on the maternal abdomen. The ultrasound images were acquired while applying the probe in an orthogonal orientation to the chorionic plate. All images were acquired in a gray scale mode. Non linear imaging technique was used to acquire the images. The placental scans were then examined and graded according to the Grannum classification and to the classification developed from our experience in ultrasonic study of the placenta. Four relatively distinct phases of placental maturation have been indentified based on changes which occur in three separate zones: chorionic plate, placental substance and basal layer (figure 1). Grade 0: the chorionic plate is smooth. The substance of the placenta is homogeneous and devoid of echogenic densities. The basal layer area is also devoid of echogenic densities. Grade 1: the chorionic plate will appear to have subtle undulations but it may sometimes be difficult to appreciate this if the fetus is closely approximated to the plate. The substance of the placenta may well contain echogenic densities that are randomly dispersed in the substance of the placenta. These are linear in shape, with their long axis parallel to the long axis of the placenta. The basal layer of the placenta is still devoid of echogenic densities. Grade 2: As the placenta matures, the echogenic densities become more numerous in number and more dense. The chorionic plate may appear more markedly indented with linear echogenic densities perpendicular to the chorionic plate which extend into the substance of the placenta but not all the way to the basal layer area. Grade 3: this configuration describes the appearance of the placenta being divided into compartments, the cotyledons. The chorionic plate again is indented. We have to not that a placenta may have It should be noted that a given placenta may have simultaneously more than one grade if different sections are examined. In evaluating each scan in this series, the assigned grade corresponded to the most mature portion of the placenta assessed. It is obviously important to visualize as much placental tissue as possible. In normal pregnancies, it was reported that grade 1 appears at 31 weeks of gestation, grade 2 at 36 weeks and grade 3 at 38 weeks. But there is no relationship between the gestational age and the grade classification. [11], [12], [13], [1].
Figure 1: different grades of placenta
The aim of our studies is to establish an objective placental classification directly from the images. For that, for each image we extract the characteristic parameters and then we apply a classification method to determine the grade. This is a preliminary study to determine the transfer function placental development using advanced image processing techniques and artificial neural network.
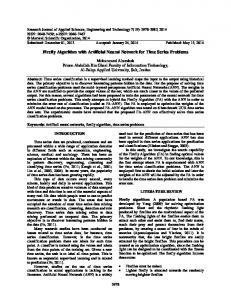
3. Discrete Wavelet Transform The wavelet transform is a very useful tool in the analysis of images. The theory and methods of wavelet analysis are widely presented in books [14], [15]. In this paper, discrete wavelet analysis is used instead of the continuous wavelet analysis. The discrete wavelet analysis is based on the concept of multiresolution analysis (MRA) introduced by Mallat [2]. This characterization of the wavelet transform allows the study of an image from the coarse resolution to the fine resolution and the extraction of information in any levels of decomposition. The (MRA) can be implemented with a two channel filter bank using quadrature mirror filters. The algorithm applies a one- dimensional high and low pass filtering step to both the rows and columns to the input image. Each filtering step is followed by subsampling which results in change in scale. Transforms in image processing are two-dimensional, so we need a few comments on how we implement a separable transform. When a two dimensional transform is separable, we can calculate it by applying the corresponding one dimensional transform to the column first, and then to the rows (Figure 2). At each decomposition level there are four different output images. An approximation of the input image and three detail images. The information contained in the output subbands of the DWT are: - LL coefficients which correspond to a low pass filter to rows, followed by low pass filter to columns.
22
IJCSI International Journal of Computer Science Issues, Vol. 8, Issue 5, No 3, September 2011 ISSN (Online): 1694-0814 www.IJCSI.org
-
-
-
HL coefficients which correspond to a low pass filter to rows, followed by high pass filter to columns. LH coefficients which correspond to a high pass filter to rows, followed by low pass filter to columns. HH coefficients which correspond to a high pass filter to rows, followed by high pass filter to columns. When a separable transform is applied, only the LL coefficients may need further decomposition. When this decomposition is done at many levels, we get the subband decomposition in Figure 2.
Figure 2: passband structure for a two dimensional subband transform with three levels
𝛼𝛼(𝑣𝑣) =
23
1
⎧ � 𝑓𝑓𝑓𝑓𝑓𝑓 𝑣𝑣 = 0 ⎫ 𝑁𝑁
⎨ 1 ⎬ � 𝑓𝑓𝑓𝑓𝑓𝑓 𝑣𝑣 ≠ 0 ⎩ 2𝑁𝑁 ⎭
(3)
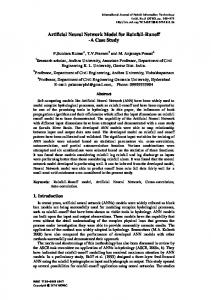
The 2-D basis functions can be generated by multiplying the horizontally oriented 1-D basis functions with vertically oriented set of the same functions [18][19][20]. The basis functions for N = 8 are shown in. Again, it can be noted that the basis functions exhibit a progressive increase in frequency both in the vertical and horizontal direction. The top left basis function of results from multiplication of the DC component in Figure 3 with its transpose. Hence, this function assumes a constant value and is referred to as the DC coefficient.
Figure 3: Two dimensional DCT basis functions (N = 8). Neutral gray represents zero, white represents positive amplitudes, and black represents negative amplitude[18].
4. Discrete Cosine Transform
5. Artificial Neural Network
Like other transforms, the Discrete Cosine Transform (DCT) attempts to decorrelate the image data. After decorrelation each transform coefficient can be encoded independently without losing compression efficiency. This section describes the DCT and some of its important properties [21][22][18]. The objective of this section is to study the efficacy of DCT on placental images. This necessitates the extension of ideas presented in the last section to a two-dimensional space. The 2-D DCT is a direct extension of the 1-D case and is given by
After we extract the parameters from the DWT and DCT, an artificial neural network is used for the purpose of classification. After the calculation of parameters, an artificial neural network is used to classify the images into different grades. A neural network is a general mathematical computing paradigm that models the operations of biological neural systems. The multilayer perceptron (MLP) is by far the most well known and most popular neural network among all the existing neural network paradigms. This type of neural network is known as supervised network because it requires a desired output in order to be learned [16], [17]. The goal of this type of network is to create a model that correctly maps the input to the output using historical data so that the model can then be used to produce the output when the desired output is unknown. This work chooses MLP and its optimization to train and test the data of image registration. The recognition performance of the MLP network will highly depend on the structure of the network and training algorithm. In the current study, back projection algorithm selected to train
𝑁𝑁−1 𝑁𝑁−1
𝐶𝐶(𝑢𝑢, 𝑣𝑣) = 𝛼𝛼(𝑢𝑢)𝛼𝛼(𝑣𝑣) � � 𝑓𝑓(𝑥𝑥, 𝑦𝑦)𝑐𝑐𝑐𝑐𝑐𝑐 � 𝑥𝑥=0 𝑦𝑦=0
𝜋𝜋(2𝑥𝑥 + 1)𝑢𝑢 𝜋𝜋(2𝑦𝑦 + 1)𝑣𝑣 � 𝑐𝑐𝑐𝑐𝑐𝑐 � � (1) 2𝑁𝑁 2𝑁𝑁
for u,v =0,1,2,…,N −1 and α(u) and α(v) are 𝛼𝛼(𝑢𝑢) =
1
⎧ � 𝑓𝑓𝑓𝑓𝑓𝑓 𝑢𝑢 = 0 ⎫ 𝑁𝑁
⎨ 1 ⎬ � 𝑓𝑓𝑓𝑓𝑓𝑓 𝑢𝑢 ≠ 0 ⎩ 2𝑁𝑁 ⎭
(2)
IJCSI International Journal of Computer Science Issues, Vol. 8, Issue 5, No 3, September 2011 ISSN (Online): 1694-0814 www.IJCSI.org
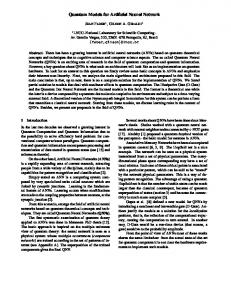
the network. The number of nodes in input, hidden and output layers will determine the network structure. Furthermore, hidden and output nodes have activation function that will also influence the network performance. The best network structure is normally problem dependent, hence structure analysis has to be carried out to identify the optimum structure. Figure 4 shows a complete general schematic for the MLP network used in our study.
24
0
1
2
3
Figure 6: DCT application for the different grades of placenta
Figure 4: General schematic for the MLP
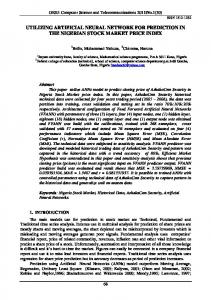
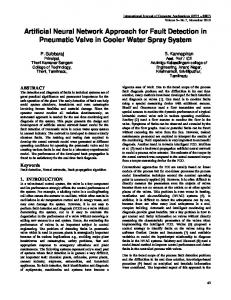
6. Results 6.1 Image Modeling Using DCT Figure 5 shows the ultrasound images for different grades of placenta obtained in our experiment. After we select the region of interest, a DCT is applied to the selected region. Normally, in image compression, the DCT is applied to blocks 8*8 or 16*16. Because our purpose is not to compress an image, but an image classification after extracting the parameters and the position of the placenta is not always in the same place, the DCT was applied to the entire selected region. Figure 6 shows the application of the DCT to the different grades of placenta. 0
1
The figure 6 shows that the majority of energy is in the components of low frequencies with negligible values at high frequencies. If the image contains more details or heterogeneity, as the placenta, more the high frequency coefficients are important. For example, the grade III which normally is the grade the more heterogeneous contains more coefficients important at high frequencies. To quantify this difference of frequency in the different grades of placenta, statistical parameters are extracted after the application of the DCT. The extracted parameters are the mean, the standard deviation, the variance and the kurtosis. 6.2 Classification Using MLP The neural network used for the purpose of classification is composed of one input layer contained 4 neurons correspond to the extracted parameters, one hidden layer with 5 neurons, and one output layer with 4 outputs correspond to the 4 different grade of placenta. The activation functions used in our neural network are the following: - Input layer: without activation function (no calculation at the level of this layer). - Hidden layer: Sigmoid function
1 (4) ϕ (x ) = 1 + e −x -
Output layer: Sigmoid function
(ϕ o (x ) = ϕ (x )) (5)
Or Hyperbolic function 2
3
Figure 5: ultrasound images for different grades of placenta
( )
1− e −x ϕ o ( x ) = tanh x = 2 1+ e −x
(6)
40 images /100 are used to train the neural network and the others are used for testing the classification to study the performance of the used neural network. A confusion matrix (table 1) shows the result of the classified image and the misclassified images.
IJCSI International Journal of Computer Science Issues, Vol. 8, Issue 5, No 3, September 2011 ISSN (Online): 1694-0814 www.IJCSI.org
25
Table 1: confusion matrix for the DCT classification
Table 2: confusion matrix for the DWT classification
Grade
Grade
0
I
II
III
Miss classified 0 0 8 4 2 6 0 0 I 11 4 4 0 II 0 12 3 3 0 0 III 2 13 2 Table 1 shows that 15 images /60 are miss classified in the different grades of placenta. We note that 75% of images are classified correctly. The percentage of error is 25%. 6.3: Image Modeling using DWT After the selection of the region of interest, a discrete wavelet transform at level 3 is applied to the ultrasound images. This technique allows to decompose each region of interest in different regions, which correspond to: an approximation region at the last level (level 3), and others details regions at different levels. Figure 7 shows the wavelet decomposition based on the multi resolution analysis at level 3.
0
I
II
III
Miss classified 0 0 12 3 0 3 0 0 I 14 1 1 0 II 0 14 1 1 0 0 III 0 15 0 Table 2 shows that 5 images /60 are miss classified in the different grades of placenta. We note that 92% of images are classified correctly. The percentage of error is 8%. The choice of wavelet depends on the type of analysis and the image taken into consideration. Experimentally, different types of wavelets are tested. The Daubechies were the best. The table below (table 3) shows the classification obtained for different type of wavelets using MLP. Table 3: Different types of Waveletes tested in MLP
Type of Wavelet
Classification Rate
Haar
85%
Symlet
80%
Coiflet
85%
Daubechies
92%
7. Discussions and Conclusions
Figure 7: wavelet decomposition of placental images at level 3.
After the application of the discrete wavelet transform, the variance is extracted from each region. A vector of parameters is ready for the neural network input. 6.4: Classification using MLP The neural network used is the same of the model applied in the DCT transform technique. There is only one difference in the number of neurons on the input layer which equal to 10 inputs correspond to the 10 parameters extracted from different regions after the application of the DWT.The number of images used for training and for classification in DWT is the same used in the DCT technique (40 images for training and 60 images for classification). The confusion matrix below (table 2) shows the result of classification obtained after the modeling of the images by DWT and the classification using the MLP.
Two techniques were used to extract the detailed parameters to guide us toward a better classification. Decomposition in Discrete cosine transform has first been applied to the placental images. Generally, this technique used to decompose image in different frequencies and applied to blocks 8*8 or 16*16. As the placental location is not the same in all images, it was impossible to apply this technique to blocks. For this reason, it was applied to the total images then statistical parameters were extracted from the images. The results obtained with MLP neural network give a 75 % of correct classification. A small improvement was achieved by this technique. Now, to extract parameters more effective or relevant for the classification, a more detailed decomposition analysis is requested. The wavelet transform is a technique used for frequency decomposition while preserving the temporal location. The discrete wavelet transform is base on multi resolution analysis at different level. Experimentally, level 3 was chosen and applied to the images. Extraction of variance was performed for each region of decomposition. Since this method is based on multi resolution analysis, that is meaning, we use more the details of the images; this method is effective to highlight the classification of different grades of placental maturation. The results obtained by the MLP showed a correct classification of 92%.
IJCSI International Journal of Computer Science Issues, Vol. 8, Issue 5, No 3, September 2011 ISSN (Online): 1694-0814 www.IJCSI.org
The technique based on multi resolution decomposition analysis and on supervised neural network technique MLP, seems a good method to study the transfer function of placental development in ultrasound. In fact, the choice of number of grades is correlated to the Grannum classification. We can obtain intermediate grades between grade 0 and 1 or between 1 and 2, but it will not help us in terms of diagnosis. Obtaining a grade in a given week of gestation may give an important significant. For this reason, an automatic classification of grades should help to characterize better the placental risk of pregnancy.
References [1]
Grannum, P.A., Hobbins, J.C.: The placenta. Radiologic Clinics of North America Vol. 20, No. 2, June (1982) 353365. [2] Mallat, S. (1989). A theory for multiresolution signal decomposition: The wavelet representation. IEEE Transactions on PAMI, 11, 674–693. [3] Feleppa, E. J., Kalisz, A., Melgar, J. B. S., Lizzi, F. L., Liu, T., Rosado, A.L., et al. (1996). Typing of prostate tissue by ultrasonic spectrum analysis. IEEE Transactions on Ultrasonics Ferroelectrics and Frequency Control, 43(4), 609–619. [4] Kurnaz, M.N., Dokur, Z., & O¨ lmez, T. (2001). Segmentation of ultrasound images by using an incremental self organized map. In: 23rd Annual international conference of the IEEE-EMBS, Vol. 3 (pp. 2638–2640). [5] Mehmet Nadir Kurnaz, Z¨ umray Dokur, Tamer ¨ Olmez. An incremental neural network for tissue segmentation in ultrasound images. Computer methods and programs in biomedicine 8 5 (2007) 187–195. [6] Kurnaz, M.N., & O¨ lmez, T. (2007). Tissue Segmentation in ultrasound images by using genetic algorithms. (Article in press). [7] Haralick, R. M., Shanmugan, K., & Dinstein, I. (1973). Texture feature for image classification. IEEE Transactions on Systems Man and Cybernetics, 3, 610–621. [8] Zhang, W., Yoshida, H., Nishikawa, R. M., & Doi, K. (1998). Optimally weighted wavelet transform based on supervised training for detection of microcalcifications in digital mammograms. Medical Physics, 25(6), 949– 956.Erickson J., http://www.ics.uci.edu/%7Eeppstein/ gina/voronoi.html, 1996. [9] Serhatlioglu, S., Hardalac, F., Guler I. Classification of transcranial Doppler signals using artificial neural network. J Med Syst.2003 Aprl; 27(2):205-14. [10] L. F. A. Campos, A. C. Silva, A. K. Barros: Independent Component Analysis and Neural Networks Applied for Classification of Malignant, Benign and Normal Tissue in Digital Mammography. Methods of Information in Medicine 2007 46 2: 212-215.Drysdale S., Voronoi Diagrams Applications from Archeology to Zoology, Regional Geometry Institute, 1993. [11] Grannum, P.A., Berkowitz, R.L.,andHobbins, J.C.: The ultrasonic changes in the maturing placenta and their relation to fetal pulmonic maturity. Am. J. Obstet. Gynecol., 133:915-922, 1979.
[12] Grannum, P.A.: The placenta. Clinics in diagnostic Ultrasound, Vol.25, 203-219, 1989. [13] Grannum, P.A.: Ultrasound examination of the placenta. Clinics in obstetrics and Gynecology, Vol.10, No.3, 45973, 1983. [14] Chui C.K., An introduction to wavelet, academic Press, 1992.Chui C.K., An introduction to wavelet, academic Press, 1992. [15] Teolis A., Computational signal processing with wavelets, Brikhäuser, Boston 1998. [16] Neural Networks: A comprehensive Foundation (2nd Edition). Simon Haykin. [17] D.E. Rumelhart et al, 1986. Learning representations by back- propagating errors, Nature, 1986. [18] W. B. Pennebaker and J. L. Mitchell, “JPEG – Still Image Data Compression tandard,”Newyork: International Thomsan Publishing, 1993. [19] G. Strang, “The Discrete Cosine Transform,” SIAM Review, Volume 41, Number 1, pp. 135-147, 1999. [20] R. J. Clark, “Transform Coding of Images,” New York: Academic Press, 1985. [21] A. K. Jain, “Fundamentals of Digital Image Processing,” New Jersey: Prentice Hall Inc., 1989. [22] A. C. Hung and TH-Y Meng, “A Comparison of fast DCT algorithms,” Multimedia Systems, No. 5 Vol. 2, Dec 1994. Mohammad Ayache obtained a bachelor of engineering in biomedical from the Islamic University of Lebanon. He received the DEA in Signals and Images in biology and medicine from the University of Angers, France in 2004. He received the Ph.D degree in medical Image Processing from the University of Tours, France, in 2007. He is the coordinator of the department of biomedical at the faculty of engineering at the Islamic University of Lebanon. His research interests include advanced neural networks software development and advanced signal and image processing techniques. Mohamad Khalil obtained an engineering degree in electrical and electricity from the Lebanese University, faculty of engineering, Tripoli, Lebanon in 1995. He received the DEA in biomedical engineering from the University of Technology of Compiegne (UTC) in France in 1996. He received his Ph.D from the University of Technology of Troyes and University of Technology of Compiegne in France in 1999. He received his HDR (Habilitation à diriger des recherches) from UTC in 2006. He is currently Professor at the Lebanese university, Faculty of engineering, section 1 Tripoli. He is researcher in the Lebanese University and his current interests are the signal and image processing problems: detection, classification, analysis, representation and modeling of non stationary signals, with application to biomedical signals and images. He is Responsible of the research axis (Image and Data Transmission) in LaMA Laboratory, Faculty of sciences, Lebanese university. Director of the center Azm of research in biotechnology and applications in the Lebanese university. François Tranquart (MD, PhD) was born in Chatillon sur Indre (France) in 1958. He is General Manager of Bracco Suisse SA, Geneva Research Center and Manufacturing site since 2010. This site is dedicated to the development of new ultrasound contrast agents as well as developing solutions to support adequate in vitro and in vivo use of those agents. As a full professor of biophysics, he worked previously at Tours University Hospital as head of Ultrasound Medical Dept (with 100 exams performed daily), head of Centre For Innovation (new developments) and head of a research team (INSERM U930) dedicated to the development of new ultrasound approaches including microbubbles. His main
26
IJCSI International Journal of Computer Science Issues, Vol. 8, Issue 5, No 3, September 2011 ISSN (Online): 1694-0814 www.IJCSI.org
interest is for new diagnostic agents or applications as well as new therapeutic developments involving the use of bubbles. He has presented more than 400 papers in national and international conferences, written more than 120 papers and participated to 20 books.
27