The PCT index is calculated from a combination of the curving acceleration and the jerk and roll rates during the transition, and predicts the percentage of ...
Assessment of the Performance of Tilt System Controllers Roger Goodall and Argyrios Zolotas Loughborough University, Department of Electronic and Electrical Engineering Jeremy Evans AEAT Technology
SYNOPSIS The paper describes an overall approach for determining tilt control system performance. Firstly the issues relating to dynamic performance are reviewed, then some trade-off graphs are given, based upon the PCT index approach which is now accepted as a European Standard. These graphs inter-relate vehicle speed, the maximum tilt angle, and the cant deficiency compensation factor, and help to determine the optimum operational conditions for a tilting train. Secondly a method for quantifying the dynamic performance is explained, in particular aimed at a comprehensive assessment of different tilt control laws. Simulation results are included to illustrate the method, and some preliminary conclusions regarding different controllers are presented.
1
INTRODUCTION
Although active tilting has become a standard railway technology, a number of issues remain which need to be resolved for determining the performance of tilting trains. One of these relates to motion sickness, and research is on-going in this area (1, 2). However there are also uncertainties relating to the more basic issue of optimising the tilt controller design, in particular the dynamic performance. This paper presents an appraisal of these dynamic considerations and proposes an assessment method, illustrating the technique with an example tilt control system. There is a general acceptance that tilting can provide typically 30% increase in speed through curves, but this is often based upon criteria such as the maximum track force and the quasi-static response on a steady curve. However the PCT index, which has now been accepted in Europe (3), provides a means of assessing the fundamental response on curve transitions in terms of passenger comfort, and it is possible to use this index in order to assess rigorously the use of tilt to provide an increased operating speed,
based upon achieving the same level of comfort on curve transitions as that for a nontilting train at a lower speed. The PCT index is calculated from a combination of the curving acceleration and the jerk and roll rates during the transition, and predicts the percentage of passengers who will feel uncomfortable. It’s important to recognise however that the index requires the designer to average certain of the variables over a period of a second, in other words eliminating the higher frequency content. This means that it is not appropriate for assessing and comparing the dynamic characteristics of different tilt controllers, and it is therefore necessary to find a way of determining how well a particular tilt control strategy is working - an area which to the authors’ knowledge has not been addressed, particularly when making quantitative comparisons between two or more tilt controllers. Overall the paper proposes a more rigorous approach for assessing the dynamic performance of tilting trains, which at present appears to be something of a “black art” practised by the main manufacturers of tilting trains. It provides a framework upon which a standard for tilt system transition performance could be based, although the emphasis within the paper is for comparative purposes.
2
TILT SYSTEM BASICS
The concept of tilting is now well understood - by leaning the vehicle body inwards on curves it is possible to reduce the lateral (curving) acceleration experienced by the passengers, and enable higher speed to be achieved through curves. Usually some kind of tilting mechanism is added to the bogie, although there are examples where an existing anti-roll bar is modified to provide an active roll suspension. The lateral track forces are inevitably increased as a consequence, but careful bogie design can mitigate this and in general railways have found that there is sufficient margin not to compromise safety. In the early days of tilt system development it was normal to reduce the steady-state curving acceleration to zero, but it was quickly found that this was not a good idea the increased roll velocity of the body caused a significant proportion of passengers to experience motion sickness, a phenomenon which previously had been extremely rare on trains. Consequently control strategies were adapted to compensate for only a proportion of the curving acceleration, which not only reduces the roll velocity but also helps to minimize the conflict in human perception which is believed to be an important factor in motion sickness. The other important parameter is the maximum angle of tilt provided, which essentially depends upon the tilt mechanism, the body design, etc. Some tilting trains have applied control to the air suspension to provide just a few degrees of tilt, but 8 or 9 degrees is more normal, in which case a separate mechanism is usually necessary. On a steady curve it is possible to derive an equation that gives the increased curving speed vtilt depending upon these two factors: the installed tilt capability θtilt and the cant deficiency compensation factor Kcd , i.e. the fraction or percentage of the steady-state curving acceleration for which the tilt action compensates. θtilt = Kcd (
2 vtilt − θcant ) gR
(1)
At present most tilt controllers are based upon lateral accelerometers fitted either to the body or bogie of the vehicle. The control design is made difficult because the accelerometer measures not only the curving acceleration but also the effects of track irregularities, and most modern control systems employ a “precedence tilt” control strategy in which a tilt angle command is derived from a bogie-mounted accelerometer on the vehicle in front, suitably filtered to remove the effect of track irregularities, otherwise the straight track ride quality is deteriorated; the precedence overcomes the transition delay which the filter would otherwise cause (4). The research project from which this paper has arisen is investigating the use of advanced control concepts to achieve a good tilt system performance without having to use the precedence approach, i.e. based upon control which is local to each vehicle (5), but the effectiveness of any such strategy can only be demonstrated using a properly thought-out assessment approach.
3
TILT PERFORMANCE ASSESSMENT
The principal benefit of tilt is to be able to operate at higher speeds without degradation in passenger comfort, and from a design point of view there are two issues: how well does the tilting vehicle perform on straight track, and how well does it perform on curve transitions? The accelerometer-based control strategies means these two issues must in practice be traded off against each other - if the tilt action is fast to give good transition performance, in general the straight track ride quality may be degraded. Qualitatively, a good tilt controller responds principally to the deterministic track inputs, and as much as possible ignores the random track irregularities. In order to assess different tilt control strategies in an objective manner, it is necessary to define appropriate criteria and conditions. The straight track performance can be dealt with using a criterion of degrading the lateral ride quality by no more than a specified margin compared with the non-tilting response, a typical value being 7.5%1 . Note that for assessing the tilt controller performance this comparison must be made at the higher speed. Of course a comparison of ride quality with a lower speed vehicle is also needed, but achieving a satisfactory ride quality at elevated speeds will require either an improved suspension or a better quality track, i.e. not a function of the tilt controller. The curve transition response has to be separated into two aspects. Firstly, the fundamental tilting response, as measured by the PCT factors, must be as good as a passive vehicle at lower (non-tilting) speed, otherwise the passenger comfort will inevitably be diminished, no matter how effective the tilt control is. It is possible therefore to introduce the idea of “ideal tilting”, i.e. where the tilt action follows the specified tilt compensation in an ideal manner, defined on the basis of the maximum tilt angle and cant deficiency compensation factor. This combination of parameters can be optimised using the PCT factor approach for deterministic inputs in order to chose a basic oper1
It’s worth remarking that some tilt control schemes have a facility where the tilting action is disabled on straight track, for example with a roll gyroscope on the bogie being used to indicate the start of the curve. However these are generally only effective on long sections of straight track interactions between the tilt control and lateral suspension will still occur both on steady curves and immediately following a curve, and so the proposed criterion is a sensible target, even with these enhanced schemes.
ating condition, and this will give “ideal” PCT values (one for standing, one for sitting). The other consideration is that it is necessary to quantify the additional dynamic effects which are caused by the suspension/controller dynamics as the transitions to and from the curves are encountered, essentially the deviations from the “ideal” response mentioned in the previous paragraph. These deviations relate to both the lateral acceleration and roll velocity, although the former is likely to be the main consideration. It is clear that the deviations need to be minimized, but at present there is no information regarding their acceptable size, although the values derived for a normal passive suspension can be used as a guide.
4
SPEED-UP POSSIBILITIES BASED UPON “IDEAL” TILTING
The assessment of curve transition performance using PCT factors arose from the difficulties with tilting trains, and relies upon a comprehensive experimental/empirical study undertaken in the 1980s. The equations which give the values are given in the Appendix, from which it can be seen that three variables affect passenger comfort on transitions: lateral acceleration, lateral jerk and body roll velocity. The empirically-derived formulae enable the percentage of passengers who will feel uncomfortable during the curve transition to be determined, both standing and seated, and therefore provides a realistic and objective measure.
Acceleration (%g)
Passive Acceleration (%g)
11.5
30% speed increase Compensation factor = 0.6
9.9
Jerk (%g s -1)
Transition (3.2 s)
Time Jerk (%g s -1)
3.6
Transition (2.5 s)
Time
4.0
Roll velocity (deg s-1)
Time Roll velocity (deg s-1)
Time
5.6
1.7
Time
Time
Figure 1: Acceleration, jerk and roll rate time history The analysis is on the basis of a perfectly-aligned track in which cant and curvature rise linearly with time/distance, the tilting action being applied in a similarly synchronised manner. For a given track feature having a particular curvature, cant and transition length, it is possible to specify the cant deficiency and thereby calculate the speed for a passive (non-tilting) vehicle. From this, and taking an appropriate value for the passive roll-out on the curve, the PCT factors can be evaluated. The left hand diagram on Fig-
ure 1 shows the time histories of acceleration and body roll velocity, based upon the following typical list of conditions, the corresponding PCT values also being given:Curve radius R=1000m; track cant θcant =6 degrees; transition length of 145m Cant deficiency of 6 degrees; passive vehicle speed vpas = 45 ms Passive roll-out 0.6 degrees; standing PCT = 29.0%; seated PCT = 7.9% For the tilting case two things need to be specified, the cant deficiency compensation factor and the “speed-up” factor, i.e. the ratio of tilting to non-tilting speeds. The right hand diagram on Figure 1 shows the ideal values for a typical tilting condition - 30% increase in speed and 60% cant deficiency compensation. Comparing the two diagrams shows that, although the lateral acceleration is reduced, the jerk and roll rates are increased compared to the passive case. The PCT factors for the tilting train can then be evaluated, and compared with those for the non-tilting vehicle; the required tilt angle also emerges from the calculation process. Figure 2 shows respectively the two PCT factors and the maximum tilt angle for speed-up factors of 15-35% with compensation factors varying from 40-80%. From Standing Pct factor (%)
Seated Pct factor (%) 20.0
60.0 15% increase 20% increase 25% increase 30% increase 35% increase Passive
15.0 10.0 5.0 0.0
15% increase 20% increase 25% increase 30% increase 35% increase Passive
50.0 40.0 30.0 20.0 10.0 0.0
0.4
0.5 0.6 0.7 0.8 Compensation factor
(A)
0.4
0.5 0.6 0.7 0.8 Compensation factor
(B)
Required tilt angle (degs) 14.0 12.0 10.0 8.0 6.0 4.0 2.0 0.0
15% increase 20% increase 25% increase 30% increase 35% increase 0.4
0.5 0.6 0.7 Compensation factor
0.8
(C)
Figure 2: PCT factors: (a)seated, (b)standing and (c)maximum tilt angle these it can be seen that to satisfy the requirement for seated passengers a 30% increase in speed is possible with a compensation factor of 0.63 and a tilt angle of 9 degrees; for standing passengers the corresponding values are 0.69 and 10 degrees. It is clear therefore that, given the industry maximum of around 8-9 degrees, 30% speed-up can-
not be achieved without deteriorating the passengers’ comfort during curve transitions. For a 25% increase in speed the values are: seated 0.57 and 6.6 degrees; standing 0.61 and 7.8 degrees. Note that the transition length used is relatively long (more than 3sec at non-tilting speed). Use of a shorter transition would increase the tilting PCT , effectively reducing the speed-up potential.
5
TILT CONTROL LAW AND PERFORMANCE ASSESSMENT
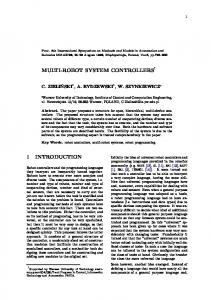
Two control approaches are compared based upon the proposed assessment, a commanddriven with precedence type and a recently suggested model-based estimation scheme used for local/vehicle control. Moreover the effect of the suspension dynamics of the real system in the assessment procedure is also discussed. Nowadays, most European tilting train manufacturers use a “precedence tilt” control strategy, as discussed in Section 2, where the tilt command is provided by an accelerometer built on the bogie of the preceding vehicle. The conceptual scheme is shown in Figure 3(a), although in practice this is usually achieved with a single accelerometer on the first bogie of the train, the signal being propagated down the train with appropriate time delays.
Bogie accel. 1
|G|
K/g
+ -
w
x
Controller
K/g
u: control
|G|
+ -
w
x
Controller
preview effect |G|
K/g Bogie accel. 3
actuator demand
Vehicle Dynamics A, B, C,Γ, D, H
K(s) Vehicle 2
Tilt angle 2
LPF
Bogie accel. 2
Vehicle 1
vehicle body roll and yaw gyroscopes vehicle body lateral acceleration
Tilt angle 1
LPF
preview effect
actuator demand
Track disturbances: curvature, cant, lateral track irregularities
+ -
w
x
Controller
actuator demand Tilt angle 3
LPF
preview effect To Vehicle 4, etc
(A)
Vehicle 3
estimated feedback signals Kalman-Bucy
Sensor Noise R Sensors
estimated outputs
system model (process noise Qk )
Kalman Gain
+
(B)
Figure 3: Control strategies used for comparison: (a)“precedence”, (b)modelbased estimation While this strategy is now established and works well it unavoidably adds complexity to the system and a particular limitation is that the tilt performance of the leading vehicle is inferior. A different way to derive the tilt command signal for local/vehicle control is to use model-based estimation, shown in Figure 3(b). More details on this scheme can be found in (5), but the overall objective is to derive an estimate for the cant deficiency on the body without the effetcs of the track irregularities and interactions with the lateral secondary suspension.
The method proposed in Section 3 has been used to make a comparative assessment of these two strategies - for 30% speed increase and 60% tilt compensation. Since the passive (non-tilting) case obviously provides a useful baseline for the size of the deviations, this has been included, and Figures 4 and 5 show the time histories. The “ideal” acceleration and roll rates are also shown on the graphs so that the dynamic deviations caused by the suspension and/or controller dynamics can be clearly seen. Table 1 provides a qualitative comparison, presenting the r.m.s. values of deviations during the curve transition. It can be seen that for the roll rate the two strategies are very similar, although higher than the passive case because in this case the lack of tilt action makes the “ideal” roll response much lower. For the accelerations, the best is the precedence controller, but the model-based (local/vehicle) controller’s response is fairly similar and substantially better than the passive case.
2 acceleration(m/s )
Ideal vs Actual (Passive @58.5m/s) no tilt compensation 3
2
ideal actual
1
0 0
1
2
3
4
5
6
7
8
9
10
time(sec)
roll rate(deg/s)
3
ideal actual
2 1 0 -1 -2
0
1
2
3
4
5
6
7
8
9
10
time(sec)
Figure 4: Passive vehicle responses
acceleration(m/s2)
Tilt compensation, Acceleration and Roll Rates 1.5 1 ideal cstr1 cstr2
0.5 0 -0.5 0
1
2
3
4
5
6
7
8
9
10
roll rate(deg/s)
time(sec) 8 ideal cstr1 cstr2
6 4 2 0 -2
0
1
2
3
4
5
6
7
8
9
10
time(sec) ideal: 60% compensation on theoretical cant deficiency cstr1: model based estimation cstr2: command driven with precedence
Figure 5: Active tilting vehicle responses
Table 1: Comparison of RMS deviations Passive @45 ms deg Deviations Roll rate ( s ) 0.008 Deviations Acceleration (%g) 0.90
6
Passive @58.5 ms 0.012 1.775
Precedence @58.5 ms 0.017 1.05
Model-based Estim. @58.5 ms 0.016 1.40
CONCLUSIONS
The paper has presented issues relating to assessing the dynamic performance of tilting controllers. Its approach clearly separates the two aspect of the design processes - the “system level” aspect which will affect the operational conditions for the tilting train, and the more detailed controller design aspect which seeks to find the best solution once the “system level” decision has been taken. The first aspect determines the parameters which correspond to the operational condition and specifies the tilt capability and cant deficiency compensation factor. This also provides a baseline for the issue of tilt controller design optimisation. The remaining aspect of dynamic performance is the need to ensure that the straight track ride quality is good enough at the higher tilting speeds, but as mentioned in the paper this is not a part of tilt system design. A method for quantifying the dynamic performance of a tilt controller has been described, and preliminary results show that a meaningful comparison is provided, and work is continuing to refine the technique and assess its applicability.
REFERENCES (1) L-M Cl´eon, F. Quetin, T. Thibedore, M. J. Griffin, “Research on Motion Sickness”, Proceedings WCRR’99, Japan, 1999, paper CO3-3. (2) J. F¨orstberg, E. Andersson, T. Ledin, “Influence from Lateral Acceleration and Roll Motion on Nausea: A Simulator study on Possible Causes of Nausea in Tilting Trains”, Proceedings WCRR’99, Japan, 1999, paper CO3-4. (3) Anon, “Railway Applications; Ride Comfort for Passengers; Measurement and Evaluation”, European Prestandard ENV 12299, Sep. 1998. (4) R. M. Goodall, “Active Railway Suspensions: Implementation Status and Technological Trends”, Vehicle System Dynamics, vol 28, pp87-117, 1997. (5) A. C. Zolotas, G. D. Halikias, R. M. Goodall, “A Comparison of Tilt Control Approaches for High Speed Railway Vehicles”, Proceedings ICSE 2000, Coventry UK, vol 2, pp632-636, Sep. 2000.
APPENDIX - EQUATIONS FOR EVALUATING CURVE TRANSITION PASSENGER COMFORT ... ˙ E PCT = (A¨ y + B y − C)≥0 + D(θ)
(2)
where PCT = passenger comfort index on curve transition, representing the percentage of passengers that will feel discomfort y¨ = maximum vehicle body lateral acceleration, in the time interval between the beginning of the curve transition and 1.6sec after the end of the transition (expressed in %’age of g), g denotes gravity ... y = maximum lateral jerk level, calculated as the maximum difference between two subsequent values of y¨ no closer than 1sec, in the time interval between 1sec before the start of the curve transition and the end of the transition (expressed in %’age of g per second) θ˙ = maximum absolute value of vehicle body roll speed, in the time interval between the beginning of the curve transition to the end of the curve transition (expressed in degrees per second), dot denotes the derivative with respect to time t
Lat. acceleration averaged over 1s
Field of .. calculation of y ... y 1s 1.6s
.. y
1s
time(s)
Transition
Absolute roll speed
Field of ... calculation of y
.
θ
time(s) Transition
Field of . calculation of θ
A, B, C, D, E are constants defined below: Condition A B C D E Standing passengers 2.80 2.03 11.1 0.185 2.283 Seated passengers 0.88 0.95 5.9 0.120 1.626