GENERAL ARTICLES
Autoencoder networks for HIV classification Brain Leke Betechuoh*, Tshilidzi Marwala and Thando Tettey In this paper, we introduce a new method to analyse HIV using a combination of autoencoder networks and genetic algorithms. The proposed method is tested on a set of demographic properties of individuals obtained from the South African antenatal survey. When compared to conventional feedforward neural networks, the autoencoder network classifier model proposed yields an accuracy of 92%, compared to an accuracy of 84% obtained from the conventional feedforward neural network models. The area under the ROC curve for the proposed autoencoder network model is 0.86 compared to an area under the curve of 0.8 for the conventional feedforward neural network model. The autoencoder network model for HIV classification, proposed in this paper, thus outperforms the conventional feedforward neural network models and is a much better classifier. Keywords:
Autoencoder networks, genetic algorithms, HIV classification.
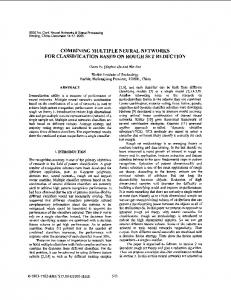
ACQUIRED immunodeficiency syndrome (AIDS) was first defined1 in 1982 to describe the first cases of unusual immune system failure that were identified in the previous year. The human immunodeficiency virus (HIV) was later identified as the cause of AIDS. Risk factor epidemiology examines the individual demographic and social characteristics and attempts to determine factors that place an individual at risk of acquiring a life-threatening disease 2 . In this study, the demographic and social characteristics of the individuals and their behaviour are used to determine the risk of HIV infection; referred to as biomedical individualism 2,3 . By identifying the individual risk factors that lead to the HIV infection, it is possible to modify social conditions, which give rise to the disease, and thus design effective HIV prevention policies2. A model will be created and used to classify the HIV status of individuals based on demographic properties. In this study, the model is created using autoencoder neural networks and genetic algorithms, which have been applied to classification. An artificial neural network (ANN) is an inter-connected structure of processing elements. The ANN structure4 used in this study consists of three main components (Figure 1)5 . Neural networks have been successfully used for medical informatics, for decision making, clinical diagnosis, prognosis, and prediction of outcomes6–10 and for classification. Marwala11 used a probabilistic committee of neural networks to classify faults in a population of nominally identical cylindrical shells and obtained an accuracy of 95%, in classifying eight classes of fault cases. Ohno-Machado12 depicted the limitation on the accuracy of the neural network model due to lack of data balance
The authors are in the School of Electrical and Information Engineering, University of the Witwatersrand, Private Bag 3, Wits, 2050, South Africa. *For correspondence. (e-mail:
[email protected]) CURRENT SCIENCE, VOL. 91, NO. 11, 10 DECEMBER 2006
and increased the accuracy by using sequential neural networks. Lisboa 13 assessed the evidence of healthcarebenefits using neural networks. Fernandez and Caballero14 used ANN to model the activity of cyclic urea HIV-1 protease inhibitors. They showed that ANN were capable of representing the nonlinearity in the HIV model. Lee and Park15 applied neural networks to classify and predict the symptomatic status of HIV/AIDS patients based on publicly available HIV/AIDS data. A study was also performed to predict the functional health status of HIV/ AIDS patients defined as ‘in good health’ or ‘not in good health’, using neural networks16 . Laumann and Youm17 used the racial and ethnic group differences to model the prevalence of the disease and succeeded in relating the demographic properties to the transmission of the disease. Poundstone et al. 2 related demographic properties to the spread of HIV. Their work justifies the use of such demographic properties in creating a model to predict the HIV status of individuals, as done in this study. The above models concluded that ANN performed well in HIV classification problems. The methodology presented here aims at using demographic and social factors, to predict the HIV status of an individual, using autoencoder neural networks. The most common neural network architecture is the multilayer perceptron (MLP). An alternative network is the radial basis function (RBF)5 . The use of MLP over RBF can be attributed to the fact that the RBF usually requires the implementation of the pseudo-inverse of a matrix for training, which is often singular while MLP uses conventional feedforward optimization methods, which are stable5 . In our study, preliminary design showed that the MLP outperformed the RBF. This can be attributed to the fact that MLP networks, also known as universal approximators, are capable of modelling any complex relationship with one or two hidden layers5 and are thus most suited for this study. More details on neural networks and 1467
Demographic input parameters from antenatal dataset
GENERAL ARTICLES x1
h1
x2
h2
x3 y (HIV status of individual) Output Node h 77 x9 Input Nodes
Hidden Nodes Figure 1.
Feed-forward MLP network architecture.
MLP can be found in refs 18–22. In this study neural networks are used with genetic algorithms. A genetic algorithm (GA) is an optimization method deriving its behaviour from processes of evolution in nature, inspired by Darwin’s theory of natural evolution23,24. This is done by the creation within a machine/computer of a population of individuals. In this study, the population of individuals represents the missing input entries. The individuals then go through the process of evolution. GA uses fitness-proportionate or tournament selection to select the missing entries (individuals) probabilistically that yields the right HIV status for the individuals. Although not guaranteed to provide the globally optimum solution, GA has been shown to be highly efficient at reaching a very near optimum solution in a computationally efficient manner 23,24 . More details on GA can be found in refs 25 and 26. In the literature review, there is no method proposed thus far that investigates the use of autoencoder networks for HIV modelling. The aim of this paper will thus be to propose a new method, which is based on autoassociative models27 combined with GA to classify the HIV status of an individual based on demographic properties. The proposed method is tested on the classification of the HIV status of individuals using a data set obtained from the South African antenatal seroprevalence survey. The method is then compared with conventional feedforward neural network models that have already been applied in the HIV modelling problem as presented in the literature review.
Background Autoassociative networks Autoassociative networks are models where the network is trained to recall the inputs27 . This network thus predicts 1468
the inputs as outputs, whenever an input is presented. These networks have been used in a number of applications28–31 . An autoassociative neural network encoder (or simply known as autoencoder) consists of an input and output layer with the same number of inputs and outputs, hence the name autoassociative, combined with a narrow hidden layer 27 . The networks will be trained using HIV/ AIDS demographic data. The hidden layer attempts to reconstruct the inputs to match the outputs, by minimizing the error between the inputs and the outputs when new data is presented. The narrow hidden layer forces the network to reduce any redundancies, but still allows the network to detect non-redundant data. However, it must be noted that for missing data estimation it is absolutely crucial that the network must be as accurate as possible and that this accuracy is not necessarily realized through few hidden nodes as is the case when these networks are used for data compression. It is therefore crucial that some process of identifying the optimal architecture be used. GA is used in this study to find the optimal autoencoder architecture by finding the global optimum solution 23 . The auto-encoder neural network architecture used in this study is shown in Figure 2.
Classification as a statistical pattern The goal of our classification is to develop an algorithm, which will assign an individual, represented by a vector {x} describing the demographic, social and behavioural characteristics of that individual, to one of the HIV classes, C1 or C2 (where C1 , C2 represents the status of an individual, which may be positive or negative). The data on which the model is based upon contains demographic examples of individuals, as well as the classes to which those individuals belong. The output of the classification system is assigned to the variable y. The classification CURRENT SCIENCE, VOL. 91, NO. 11, 10 DECEMBER 2006
GENERAL ARTICLES model is therefore required to map the inputs x 1 , . . . , x d to the output y. A mathematical function describes this mapping, and since it cannot be explicitly determined, the data is used to determine the parameters. This can be written as follows: { y} = f ({x}, {w}) .
(1)
Here {w} is the mapping weights and {x} represents the demographic input parameters and {y} represents the HIV status. In this study, autoencoder neural networks are used to obtain the functional mapping, and supervised learning is used to obtain the parameters. The purpose of the classification model is to design the decision surface to assign new inputs to one of the classes5 .
Methodology The literature review showed that models for HIV prediction and classification have been developed using conventional feedforward neural networks architectures and have worked well. However, it was found from the literature review that autoencoder networks have not been applied to HIV modelling, for prediction and classification. Our work thus focuses on proposing a methodology for HIV classification from demographic properties using autoencoder neural networks and GA. Our work also focuses on comparing the proposed autoencoder method to a conventional feedforward neural networks model, by creating a feedforward MLP neural network model and comparing the results with the autoencoder network model results.
HIV classification using autoencoder networks
x1
y1= x1
h1
x2
x3
y2= x2
y3= x3
h2
Hidden Nodes
x9
y9= x9 Input Nodes
Figure 2.
Output Nodes
Auto-encoder neural network architecture.
CURRENT SCIENCE, VOL. 91, NO. 11, 10 DECEMBER 2006
Predicted Demographic properties and HIV status from the autoencoder network
Demographic Input properties with HIV status as one of the inputs
The NETLAB toolbox32 was used to create and train an autoencoder MLP architecture. This toolbox has a 2-layer MLP network, which according to literature review5 is
capable of modelling any complex relationship, such as the HIV model. The network implemented consisted of an input layer, representing different demographic inputs and the HIV status, mapped to an output layer representing the same characteristics as the input layer via the hidden layer. The network was thus trained to recall itself (predict the demographic inputs). This network is shown in Figure 2. One of the input nodes in Figure 2, x 2 , represented the HIV status of individuals, which was ultimately represented by one of the output nodes, y 2 , as well. The neural network equation can be written as in eq. (1). Since the network is trained to recall the demographic inputs, the output vector {y} (predicted demographic properties) obtained will be approximately equal to the input vector {x} (actual demographic properties). An error, however, exists between the input vector {x} and the output vector {y}, which can be expressed as the difference between the input and output vector. This error is formulated as e = {x} − { y}.
(2)
Substituting for {y} from eq. (1) into eq. (2) we get e = {x} − f ({ x},{w}).
(3)
In our work, a minimum and non-negative error is required. This can be obtained by squaring the error function in eq. (3) to obtain e = ({x} − f ({x},{w})) 2 .
(4)
To predict the HIV status of individuals, the HIV status input, in the input vector {x} was assumed as an unknown input, while the demographic input properties were considered as the known inputs. When the input vector {x} has unknown elements, the input vector set can be categorized into {x} known represented by {xk} and {x} unknown represented by {x u }. Rewriting (4) in terms of {x k} and {x u }, we obtain x e = u − xk
2
x f u , {w} . xk
(5)
Here {xu} represents the HIV status of the individual, which is unknown, {x k} represents the demographic input parameters of the individuals in Table 1, {w} represents the weight vector that maps the autoencoder network input vector {x} to the same input vector {x}. An estimated value for the HIV status is then obtained by minimizing eq. (5) using a GA which was chosen because it finds the global optimum solution 25 . GA, however, always finds the maximum value. To cater for this, the negative of eq. (5) was used as the fitness function for the GA. The error function to be minimized is thus 1469
GENERAL ARTICLES
Start
Demographic Inputs with HIV Status Unknown
Autoencoder neural networks
Predicted output with the predicted HIV status
Generate Error Function (Fitness Function)
Use GA to estimate HIV status by minimizing the error function
Return the global optimum as the HIV status
Minimum obtained
Convert the continuous output from the GA to a binary output using the threshold
END
Figure 3.
Table 1. Variable
HIV output node value to a binary value, representative of the HIV class of the individual. Figure 3 shows the implementation of this proposed model in a flowchart.
Summary of input and output variables Type
Range
Input variables Age group Age gap Education Gravidity Parity Province Race Region RPR WTREV
Integer Integer Integer Integer Integer Integer Integer Integer Integer Continuous
Output variable HIV status
Binary
x e = − u − xk
Flow chart of the proposed model.
14–50 1–7 0–13 0–11 0 – 40 1–9 1–5 1–36 0–2 0.638–1.2743
HIV classification using neural networks
[0, 1] 2
x f u , {w} . xk
(6)
This estimated value from the autoencoder network and genetic algorithm was a continuous value representing the HIV status. A threshold was thus required to convert the 1470
In this model, the NETLAB toolbox32 was used to create and train an MLP neural network architecture. The network implemented consisted of an input layer, representing different demographic inputs of an individual, mapped to an output layer representing the HIV status of an individual via the hidden layer. The network thus mapped the demographic inputs of individuals to the HIV status. This network is shown in Figure 1. The neural network equation can be written as in eq. (1). In this model, however, the output vector {y} represents the HIV status of the individual. The network is thus trained to find the relationship between the HIV status of the individual and the individual’s demographic input properties. An error, however, exists between the individual’s predicted HIV status (output vector) {y} and the individual’s actual HIV status (target vector) {t} during training, which can be expressed CURRENT SCIENCE, VOL. 91, NO. 11, 10 DECEMBER 2006
GENERAL ARTICLES as the difference between the target and output vector. For the neural network HIV classification, the mean square error function between the target output vector {t} and the output vector {y} is insufficient as a classification accuracy measure, as it only indicates the total number of correct classifications. A confusion matrix was thus constructed and the accuracy was obtained from the confusion matrix. The accuracy can be formulated as Accuracy =
TN + TP . TN + FN + TP + FP
(7)
Here TN = true negatives (where network predicts an HIV negative person as negative), FP = false positives (where network predicts an HIV negative person as positive), FN = false negatives (where network predicts an HIV positive person as negative) and TP = true positives (where network predicts an HIV positive person as positive). The accuracy function was then used as the fitness function in the GA to obtain the optimal neural network parameters. GA was used as it finds the maximum value of the fitness function, which was required in this case. GA was also used to obtain the threshold value to convert the continuous network output to a binary value representative of HIV.
provided for the network. The GA used for the autoencoder network model proposed in this study and the neural network model used arithmetic cross-over, non-uniform mutation and normalized geometric selection. The probability of cross-over was chosen to be 0.75 as proposed in Marwala et al. 34 . The probability of mutation was chosen to be 0.0333 as recommended by Marwala et al.34. GA had a population of 40 and was run for 150 generations. The first experiment investigated the use of autoencoder networks for HIV classification. An autoencoder network with 9 inputs and 9 outputs was constructed and several number of hidden units were investigated, using Matlab© (ref. 35). A GA was used to obtain the optimum number of hidden units and yielded an optimum number of hidden units of 2, hence the structure 9–2–9. Linear optimization using the mean square error versus hidden units was also investigated. As shown in Figure 4, the
Results and discussion The demographic and medical data, used in this study, came from the South African antenatal seroprevalence survey33 of 2001. This is a national survey, and pregnant women attending selected public health care clinics participating for the first time in the survey were eligible. The variables obtained are shown in Table 1. These include: age of mother, age of partner, educational level of mother, gravidity (number of complete or incomplete pregnancies), parity (number of complete pregnancies), province of origin, race of mother, and region of origin. The qualitative variables such as the province of origin, race of mother and region of origin were encoded to integers. For example, the encoding scheme for race is shown in Table 2. The HIV status was encoded using an integer scheme, whereby a 1 represents a positive HIV status meanwhile a 0 represents a negative HIV status. The parameter distributions are also listed in Table 1. A total of 1986 training inputs were
Table 2.
The prediction error versus the number of hidden nodes.
Example of an encoding scheme of a qualitative parameter (race)
Qualitative parameter (race) White Black Coloured Indian Other
Figure 4.
Integer encoding 1 2 3 4 5
CURRENT SCIENCE, VOL. 91, NO. 11, 10 DECEMBER 2006
Figure 5.
ROC curve for the autoencoder network classifier. 1471
GENERAL ARTICLES linear optimization yielded 6 hidden units as the optimal network that gives the best prediction since as the error does not change significantly from 6 units onwards (the difference in error is about 8.5% from 6 hidden units to 20 hidden units). It must be noted, however, that it is generally assumed that the best autoencoder network is the one that has the lowest possible number of hidden units36 . A hidden unit of 2 was thus used as the optimal autoencoder network number of hidden units. The performance analysis for the autoencoder network model is based on classification accuracy and the area under the ROC curve. The proposed autoencoder network model obtained an HIV classification accuracy of 92%. The confusion matrix obtained for the above network is shown in Table 3. The ROC curve for this classification is shown in Figure 5 and the area under the curve was computed as 0.86, thus giving a very good classifier according to ROC curves documentation 37 . The second experiment investigated the use of conventional feedforward neural network MLP architecture to classify the HIV status of an individual using the demo-
Table 3.
Classifier confusion matrix of the autoencoder network classifier
Confusion matrix Actual positive Actual negative
Table 4.
Predicted positive 899 65
Predicted negative 94 928
Classifier confusion matrix of conventional feed forward neural network classifier
Confusion matrix Actual positive Actual negative
Predicted positive 680 0
Predicted negative 313 993
graphic input properties. The MLP was constructed with 9 inputs and 1 output. A GA was then used to obtain the optimal structure and yielded an optimal number of hidden units of 77, hence the structure was 9–77–1. The performance analysis for this network model is also based on classification accuracy and the area under the ROC curve. This network gave an accuracy of 84%. The confusion matrix obtained for the above network is shown in Table 4. The ROC curve obtained for this classification is shown in Figure 6 and the area under this ROC curve obtained was 0.8, which according to ROC curves documentation37 is a very good classifier. The reason why autoencoder networks performed better than the conventional feedforward neural network can be attributed to the fact that the autoencoder network focuses on characterizing the positive classes independently of the negative classes, whereas the conventional feedforward neural networks may overlook under-represented classes. We hypothesize that this may be due to lower effective dimension of the autoencoder network classifier. The difference in performance can also be attributed to the fact that in the autoencoder network, classification is done by choosing the best fitting model using probability distributions. The class of the network with the smallest reconstruction error is selected. Conventional feedforward neural networks on the other hand just map an input vector to an output vector using scenario and encodes the classes directly. This plays a role because, for nonlinear models such as the HIV model, it is usually difficult to compute the derivatives for the scenarios since they require that we integrate all the possible representations that could have been used for each particular observed input vector. The distance measure in classification is thus better minimized in the autoencoder network than in the conventional feedforward network model.
Conclusion
Figure 6. ROC curve for the conventional feedforward neural network classifier. 1472
A method based on autoassociative neural networks and genetic algorithms is proposed to classify the HIV status of an individual from demographic properties. This method is proposed in order to investigate whether using autoencoder networks improves on the accuracy of classification, of an individual’s HIV status, from demographic properties. The proposed method is tested on an HIV data set obtained from the South African antenatal seroprevalence survey of 2001. The method is then compared to a conventional feedforward neural network model, implemented using the MLP architecture. A classification accuracy of 92% was obtained for the autoencoder network compared to 84% obtained for the conventional feedforward neural network model implementation. The area under the ROC curve for the autoencoder network classifier was computed as 0.86 compared to 0.8 computed for the conventional feedforward neural network classifier. The CURRENT SCIENCE, VOL. 91, NO. 11, 10 DECEMBER 2006
GENERAL ARTICLES result thus suggest that autoencoder network models are more accurate and better classifiers for the HIV model than conventional feedforward neural network models, since autoencoder networks focus on characterizing the positive classes independently of the negative classes, whereas the conventional feedforward neural networks may overlook under-represented classes.
18. 19. 20.
21. 1. Root-Bernstein, R., The evolving definition of AIDS. Rethinking AIDS. http://www.virusmyth.net/aids/data/rrbdef.htm; last accessed: 20–02–06. 2. Poundstone, K., Strathdee, S. and Celectano, D., The social epidemiology of human immunodeficiency virus/acquired immunodeficiency syndrome. Epidemiologic Rev., 2004, 26, 22–35. 3. Fee, E. and Krieger, N., Understanding AIDS: historical interpretations and limits of biomedical individualism. Am. J. Public Health, 1993, 83, 1477–1488. 4. Nelson, M. M. and Illingworth, W. T., A Practical Guide to Neural Nets, Addison-Wesley, New York, 1991, 3rd edn. 5. Bishop, C. M., Neural Networks for Pattern Recognition, Oxford University Press, Oxford, 1995. 6. Tandon, R., Adak, S. and Kaye, J. A, Neural network for longitudinal studies in Alzheimer’s disease. Artif. Intell. Med., 2006, 36, 245–255. 7. Alkan, A., Koklukaya, E. and Subasi, A., Automatic seizure detection in EGG using logistic regression and artificial neural network. J. Neurosci. Methods, 2005, 148, 167–176. 8. Sawa, T. and Ohno-Machado, L., A neural network-based similarity index for clustering DNA microarray data. Comput. Biol. Med., 2003, 33, 1–15. 9. Szpurek, D., Moszynski, R., Smolen, A. and Sajdak, S., Artificial neural network computer prediction of ovarian malignancy in women with adnexal masses. Int. J. Gynaecol. Obstet., 2005, 89, 108–113. 10. Tan, A-H. and Pan, H., Predictive neural network for gene expression data analysis. Neural Networks, 2005, 18, 297–306. 11. Marwala, T., Probabilistic fault identification using a committee of neural networks and vibration data. J. Aircraft, 2001, 38, 138– 146. 12. Ohno-Machado, L., Sequential use of neural networks for survival prediction in AIDS. Proceedings: AMMA Annual Fall Symposium, 1996, pp. 170–174. 13. Lisboa, P. J. G., A review of evidence of health benefit from artificial neural networks in medical intervention. Neural Networks, 2002, 15, 11–39. 14. Fernandez, M. and Caballero, J., Modeling of activity of cyclic urea HIV-1 protease inhibitors using regularized-artificial neural networks. J. Bioorg. Med. Chem., 2006, 14, 280–294. 15. Lee, C. and Park, J., Assessment of HIV/AIDS-related health performance using an artificial neural network. J. Inf. Manage., 2001, 38, 231–238. 16. Sardari, S. and Sardari, D., Applications of artificial neural network in AIDS research and therapy. Curr. Pharmaceut. Design, 2002, 8, 659–670. 17. Laumann, E. O. and Youm, Y., Racial/ethnic group differences in the prevalence of sexually transmitted diseases in the United
CURRENT SCIENCE, VOL. 91, NO. 11, 10 DECEMBER 2006
22.
23. 24. 25. 26. 27.
28. 29.
30.
31.
32. 33. 34.
35. 36. 37.
States: a network explanation. Sex Transm. Dis., 1999, 26, 250– 261. Hudson, D. L. and Cohen, M. E., Neural Networks and Artificial Intelligence for Biomedical Engineering. IEEE Press, NJ, 2000. Deo, M. C. and Jagdale, S. S., Prediction of breaking waves with neural networks. J. Ocean Eng., 2003, 30, 1163–1178. Narendra, K. and Lewis, F., Introduction to the special issue on neural network feedback control. Automatica, 2001, 37, 1147– 1148. Rafiq, M. Y., Bugmann, G. and Easterbrook, D. J., Neural network design for engineering applications. J. Comput. Struct., 2001, 79, 1541–1552. Svozil, D., Kvasnicka, V. and Pospichal, J., Introduction to multilayer feed-forward neural networks. J. Chemometrics Intell. Lab. Syst., 1997, 39, 43–62. Holland, J., Adaptation in Natural and Artificial Systems, University of Michigan Press, Ann Arbor, 1975. Goldberg, D. E., Genetic Algorithms in Search Optimization and Machine Learning, Addison-Wesley, Reading, 1989. Davis, L., Handbook of Genetic Algorithms, Van Nostrand, New York, 1991. Michalewicz, Z., Genetic Algorithms + Data Structures = Evolution Programs. Berlin, Springer, 1996, 3rd edn. Lu, P. J. and Hsu, T. C., Application of autoassociative neural network on gas-path sensor data validation. J. Propul. Power, 2002, 18, 879–888. Atalla, M. J. and Inman, D. J., On model updating using neural networks. Mech. Syst. Signal Proc., 1998, 12, 135–161. Frolov, A., Kartashov, A., Goltsev, A. and Folk, R., Quality and efficiency of retrieval for Willshaw-like autoassociative networks. II. Recognition. Network: Computat. Neural Syst., 1995, 6, 535–549. Smauoi, N. and Al-Yakoob, S., Analyzing the dynamics of cellular flames using Karhunen–Loeve decomposition and autoassociative neural networks. Soc. Ind. Appl. Math., 2003, 24, 1790–1808. Hines, J. W., Robert, E. U. and Wrest, D. J., Use of autoassociative neural networks for signal validation. J. Intell. Rob. Syst., 1998, 21, 143–154. Nabney, I. T., NETLAB: Algorithms for Pattern Recognition, Springer–Verlag, London, 2003, pp. 325–365. HIV Syphilis Survey data 2001, Department of Health, Republic of South Africa, www.health.gov.za; 7 March 2005. Marwala, T. and Chakraverty, S., Fault classification in structures with incomplete measured data using autoassociative neural networks and genetic algorithm. Curr. Sci., 2006, 90, 542–549. MATLAB 7.1 Manual, Matlab and Simulink for Technical Computing, Release 13, Mathworks, 2004. Kramer, M. A., Nonlinear principal component analysis using autoassociative neural Networks. AIChE J., 1991, 37, 233–234. ROC Curves Documentation, http://pops.csse.monash.edu.au/ roccurves_doc.html, ‘About ROC curves’, Monash University: last accessed: 25–04–2006.
ACKNOWLEDGEMENTS. We thank Mr Chris Lines, Mr David Starfield, Mr David Vanucci and the National Research Foundation for support. Received 6 June 2006; revised accepted 30 August 2006
1473