GeoMatchMaker: Automatic and Efficient Matching of Vector Data with Spatial Attributes in Unknown Geometry Systems Mohammad Kolahdouzan§, Ching-Chien Chen§, Cyrus Shahabi§, Craig A. Knoblock ζ § Department of Computer Science, University of Southern California ζ Information Sciences Institute, University of Southern California Los Angeles, CA, 90089 kolahdoz,chingchc,
[email protected],
[email protected]
Abstract Large amount of geospatial data are now available from public and private organizations in vector data formats. Users of these geospatial data usually require the data that are gathered from different sources to be integrated and fused for knowledge discovery. A vital step for fusion of the geospatial datasets is to identify the matched features among the datasets. There have been several efforts to automatically or semi-automatically detect matched features across different vector datasets. These solutions usually require the features to be in the same coordinate system so their spatial attributes can be compared. This renders these solutions impractical for the scenarios where the coordinate systems of the datasets are unknown. In this paper we propose several approaches that are based on utilizing the intersections of the lines as features, to efficiently and accurately detect the matched features across line vector datasets. We first discuss PPM, a brute-force approach to find the transformation of the intersections from one dataset to another. We then briefly discuss Geo-PPM, an improvement over PPM that utilizes some network properties to prune the search space. Finally, we discuss prioritized Geo-PPM where we can further improve the performance of Geo-PPM by first examining the features that have a higher possibility of locating the matching pattern. Our experiments show that prioritized GeoPPM provides a substantial improvement over Geo-PPM and hence, renders Geo-PPM practical for networks with large sizes.
1 Introduction With the rapid improvement of geospatial data collection techniques, the growth of Internet and the implementation of Open GIS, a large amount of geospatial data are now readily available from public and private organizations as well as on the Internet. These datasets usually cover different areas, have different accuracy and levels of details, and are usually provided in the vector or raster data formats. Some examples of well-known vector datasets are US Census TIGER/Line files1 (covering most roads in the United States), NAVSTREETS from NAVTEQ2 and DLG data from USGS3. The National Map,4 ESRI’s Geography Network,5 Yahoo Map 1
http://www.census.gov/geo/www/tiger/
2
http://www.navteq.com/
3
http://tahoe.usgs.gov/DLG.html
Service,6 and Microsoft TerraService7 [1] are examples of repositories of raster data in form of map or satellite imagery. The users of these data products often need these geospatial data and other related data to be displayed in some integrated fashion for knowledge discovery. That is, the data must be fused to provide additional inferences that cannot be gathered from any single information source. Geospatial data fusion has been one of the central issues in GIS [3, 12]. Geospatial data fusion requires that the system integrates various datasets, and then creates a single composite dataset from the integrated elements. Towards geospatial data fusion, a vital step is identifying the matched features among multiple datasets. There have been a number of efforts to automatically or semi-automatically detect matched features across different road vector datasets [4, 7, 11, 13, 14, 15, 16]. Given a feature point from one dataset, these approaches utilize different matching strategies to discover the corresponding point within a predetermined distance (i.e., a localized area). This implies that these approaches can only handle the matching of vector datasets that are in the same coordinate system. There are also solutions that utilize non-spatial attributes of the points (e.g., point’s name) to compare and match vector dataset. However, there are scenarios in which the spatial attributes of the objects are intentionally transformed to a different, and usually unknown, (alien) system, or the datasets do not contain any common non-spatial attributes. An example of this scenario is when the spatial attributes of one dataset are intentionally transformed to an unknown system for security reasons. This renders the available solutions impractical for these scenarios. In this paper, we propose several approaches to automatically and efficiently handle the matching of diverse vector datasets, independent of their coordinate system. The basic idea of our approach is to find the transformation T between the layout (with relative distances) of the feature point set of one vector data and the feature point set of the other dataset. This transformation achieves global alignment between two feature point sets by locating the common point pattern among them. In particular, we utilize road intersections as the feature points to be matched. Road intersections are good candidates for being matched since road intersections are salient points to capture the major feature of the road network. In addition, various GIS researchers have shown that the intersection points on the road networks are good candidates to be identified as an accurate set of matched points [4, 5, 8, 9]. We first discuss PPM, a brute-force method that can find the matching point (intersection) pattern by examining every pair of points in the first dataset S1 against every pair of points in the second dataset S2. Although accurate and resistance against noise, PPM is computationally complex and hence suffers from very poor performance. We then briefly discuss Geo-PPM that utilizes some network properties of the features to improve the performance of PPM. The intuition for Geo-PPM is to eliminate the examination of the point pairs that cannot possibly be a candidate for correctly locating the matching pattern. Geo-PPM cannot scale to very larger datasets, especially when the features of the datasets follow a pattern (e.g., a grid pattern in a Manhattan network). This is because in the presence of a pattern, there will be numerous features 4
http://seamless.usgs.gov
5
http://www.geographynetwork.com/
6
http://maps.yahoo.com/
7
http://terraserver-usa.com/
in S2 that have the same network properties as a feature in S1. Hence, Geo-PPM cannot effectively prune the search space for a large number of features. Towards this end, we propose prioritized Geo-PPM, in which we first examine the features in S1 that have a higher possibility of locating the matching pattern sooner. These features are usually the outliers in the network (e.g., an intersection with the maximum number of intersecting streets, or an intersection with an outlier angle) and their matching features in S2 are also usually outliers. We then propose several outlier properties that can be utilized in prioritized Geo-PPM. Our experiments show that prioritized Geo-PPM can provide a substantial improvement over Geo-PPM for large networks when it utilizes the “minimum number of candidates with the same point angle” property. The remainder of this paper is organized as follows. We review the related work on conflation of vector data in Section 2. We then provide an overview of a brute-force algorithm to find the matching between two point patterns as well as Geo-PPM and prioritized Geo-PPM in Section 3. The results of our experiments that compare the performance of our proposed approaches are discussed in Section 4. Finally, we conclude the paper in Section 5.
2 Related Work The idea of vector to vector conflation was first proposed and implemented in 1988 by Saalfeld [11], and the initial focus of conflation was to eliminate the spatial inconsistency between two overlapping vector datasets in order to improve the spatial accuracy of vector datasets. Once the spatial discrepancy is eliminated, it is possible and easier to transfer attributes among datasets to achieve geospatial data fusion. Several important application domains that can benefit from such data fusion are the crisis management, city traffic planning, and military intelligence applications. Towards vector to vector conflation, a vital step is identifying the matched features among multiple datasets. There have been a number of efforts to automatically or semiautomatically detect matched features across different road vector datasets [7, 11, 13, 14]. Walter and Fritsch [13] proposed a relational matching approach to find matched spatial objects based on the similarity of spatial objects at the geometry level (e.g., node to node matching based on distance) and based on the relations between the elements in a data set. They investigated the “similarity” of spatial objects based on statistical information derived from a random sample of the vector datasets to be integrated. However, their approach requires human intervention to perform an initial affine transformation between datasets. In addition to performing feature matching at the geometry level, Cobb et al. in [7] proposed an approach to perform featurematching at the object level. For example, when comparing two road segments, their approach not only matches the road endpoints, but also matches the non-spatial properties such as street names and widths. Ware et al. [14] presented a technique for matching and aligning vector features in pairs of multi-date coverages. The main feature dealt with in their work is road segments. Their approach also supports the additions/deletions of road nodes in order to deform the matched road segments. There are also several commercial products such as MapMerger [15] and Conflex [16] that can support automatic vector to vector matching with limited human intervention to consolidate multiple vector datasets.
The existing algorithms and products can only handle the matching of vector datasets that are in the same geometry system (i.e., the same coordinate system), or require non-spatial attributes (e.g., objects’ names) to match objects of two datasets. To the best of our knowledge, there is no solution to address the same problem when the spatial attributes of the datasets are in unknown geometry systems and hence, their spatial relations with each other cannot be compared easily.
3 GeoMatchMaker: Finding the Matched Features In this section, we first describe the basic idea to identify two point patterns from two vector datasets and describe a brute-force algorithm, ppm, to match the point patterns and briefly discuss geo-ppm, which utilizes a number of auxiliary geospatial information to improve the performance of ppm. We then propose prioritized geo-ppm to further improve the performance of geo-ppm in order to address large size vector datasets.
3.1 PPM: Point Pattern Matching Let U= {ui | ui= (xi, yi )} a set of coordinates, where (xi, yi ) are the locations of the intersections of the first vector dataset, and V= {vi | vi= (mi, ni)}, where (mi, ni) are the locations of the intersections of the second vector dataset. Our objective is to find the set: RelPat={(ui,vi)} where ui is an intersection in the first vector dataset and vi is the corresponding intersection (if any) in the second vector dataset. That is, point ui and vi are formed by the same intersected vector segments. Consider identifying matched points between two road networks. If the system can recognize the names of road segments that meet at the intersections, it can use these road names to infer the set RelPat. However, road vector data may not comprise the non-spatial attribute, road name. Instead, our approach relies on some prominent geometric information of the road segments and their intersections to identify the matching point patterns. Hence, the problem of point pattern matching is to find the transformation T between the layout (with relative distances) of the point set U and V. The key computation of matching the two sets of points is calculating a proper transformation matrix T, which is a 2D rigid motion (rotation and translation) with scaling. Because the majority of vector datasets are oriented such that north is up, we only compute the translation transformation with scaling. Without loss of generality, we consider how to compute the transformation where we map from a fraction α of the points of U to the points of V. There are two reasons that only a fraction α of the points of U is considered: 1) One vector dataset may contain data that are not included in the second dataset, and 2) one vector dataset could be represented in detailed level while the other one is represented abstractly. The transformation T brings at least a fraction α of the points of U into a subset of V. This implies: ∃ T and U’ ⊆ U , such that T(U’) ⊆ V , where | U’ | ≥ α| U | and T(U’) denotes the set of the points that results from applying T to the points of U’. Or equivalently, for a 2D point (x, y) in Sx 0 0 the point set U’ ⊆ U, ∃ T in the matrix form 0 Sy 0 , where Sx and Sy are scale factors along Tx Ty 1
x and y direction and Tx and Ty are translation factors along x and y directions, respectively, such that
Sx
0 0 Sy 0 = [m, n, 1] , where | U’ | ≥ α| U | and the 2D point (m, n) belongs to the Tx Ty 1
[x, y, 1] * 0
intersection point set V on the second vector dataset. With this setting, we do not expect point coordinates to match exactly because of finite-precision computation or small errors in the datasets. Therefore, when checking whether a 2D point p belongs to the point set V, we declare that p ∈ V if there exists a point in V that is within the Euclidean distance δ of p for a small fixed positive threshold value δ, which controls the degree of inaccuracy. The minimum δ such that there is a match for U’ in V is called Hausdorff distance. Different computations of the minimum Hausdorff distance have been studied in great depth in the computational geometry literature [6]. We do not seek to minimize the value of δ, rather, we intend to adopt an acceptable threshold value for δ. The threshold is relatively small compared to the average inter-point distances in V. In fact, this sort of problem was categorized as “Nearly Exact” point matching problem in [2]. Given the parameters α and δ, to obtain a proper transformation T, we need to compute the values of the four unknown parameters Sx, Sy, Tx and Ty. This implies that at least four different equations are required. A straightforward (brute-force) method is first choosing a point pair (x1, y1) and (x2, y2) from U, then, for every pair of distinct points (m1, n1) and (m2, n2) in V, the transformation T’ that maps the point pair on U to the point pair on V is computed by solving the following four equations: Sx* x1 + Tx = m1 Sx* x2 + Tx = m2
Sy* y1 + Ty = n1 Sy* y2 + Ty = n2
Each generated transformation T’ is thus applied to the entire points in U to check whether there are more than α|U| points that can be aligned with some points on V within the threshold δ. This process is repeated for each possible point pair from U, which implies that it could require examining O(|U|2) pairs in the worst case. On the other hand, for each such pair, the algorithm needs to try all possible point pairs on V (i.e., O(|V|2 )) and the time required to examine each generated transformation T’ is O(|U| log|V|). This implies that the worst case running time of this approach has complexity of O(|U|3 |V|2 log|V|). The advantage of ppm is that we can find a mapping (if the mapping exists) with a proper threshold δ even in the presence of very noisy data. However, it suffers from high computation time. One way to improve the efficiency of the algorithm is to utilize randomization in choosing the pair of points from U as proposed in [10], thus achieving the running time of O(|V|2 |U| log|V|). However, this approach is not appropriate for all vector datasets since it is possible that one vector dataset is represented in detailed level while the other vector dataset is represented abstractly. Instead, we developed some efficient techniques discussed in the next sections to prune the search space of possible point pattern matches by reducing the numbers of potential matching point pairs needed to be examined. In more recent work, we extended the PPM algorithm by exploiting additional information about the geographic sources to improve the efficiency of the algorithm. The resulting algorithm is called Geo-PPM and the details of this algorithm are described in [17].
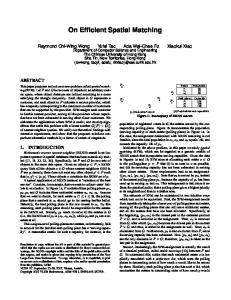
3.2 Prioritized Geo-PPM The intuition behind prioritized Geo-PPM is that in real world datasets, it is very likely that the matching feature for an outlier feature in one dataset is also an outlier in the other dataset. This means that the number of possible matching features for an outlier feature is most likely very small. Hence, if we can locate the outlier features in the first dataset and then start the Geo-PPM by first examining these features, we can most likely find the matching features faster as compared to when we execute Geo-PPM for a randomly selected feature. We further describe prioritized Geo-PPM using Figure 1. As shown in the figure, the majority of the lines in the blue dataset follow a grid pattern while lines L1, L2, L3 and L4 (shown with thick lines) are the outliers in this dataset. This means that the intersections of these lines are also outliers (i.e., have uncommon angles). As shown in the figure, the lines in the red dataset that have similar angles as the angles of (L1, L2, L3, L4) are also outliers in the red dataset. Hence, it is likely that we can find the matching line for L1 (or in other words, the matching intersections for the intersections of L1) faster than the matching line for L5. This is because there are numerous lines in the red dataset that follow the grid pattern and have the same angles as L5.
Figure 1: Example of outliers in 2 road network datasets
We can utilize the properties that are used in Geo-PPM to specify the outliers of a dataset. Some examples of the outlier features we can infer from these properties are: 1. Angles between the points: directly connected intersections that have outlier angles (e.g., intersections of the lines L1 to L4 in Figure 1). 2. Angles of the points: intersections that have the minimum number of candidates (i.e., number of candidate intersections in the second dataset that have the same angles as these intersections is minimum). 3. Point connectivity: intersections that have the maximum number of connectivity. 4. Distances between the points: directly connected intersections with the maximum distance (i.e., longest road in the network) Our experiments showed that intersections that have the minimum number of candidates (i.e., the second item above) can provide a better improvement in the performance of Geo-PPM as compared to the other outliers.
4 Experiments We performed several experiments with real world datasets to examine and compare the performance of Geo-PPM and prioritized Geo-PPM. For our experiments, we used three datasets obtained from USGS, NGA and US Census, covering the streets in the area of (-122.5015, 37.78) to (-122.3997, 37.8111). The 3 datasets are shown in Figure 2, where the green lines (i.e., most accurate data) represent the streets obtained from USGS, the red lines are from NGA, and the blue lines represent the streets obtained from US Census. As shown in the figure, while the data from USGS and NGA have almost similar granularity, the US Census data is represented in abstract level. Moreover, in order to examine the scalability of our approaches, we filtered the south west quarter of the datasets to generate 3 datasets with smaller sizes. Finally, we only used the combination of “connectivity of the points” and the “angles of the points” properties in GeoPPM.
Figure 2: Coverage area of the test data for the second set of the experiments
Table 1 shows the results of the second set of our experiments. The first column of the table shows the combination of the datasets that were used and the second column indicates the number of intersections in each combination. As shown in the table, the average number of the candidates for each intersection (i.e., the number of intersections in the second dataset with the same connectivity and angles as compared to that of an intersection in the first dataset) varies between 371 and 637. This shows that the possibility of selecting 2 pairs from the candidate pool which are exactly matched to 2 intersections selected from the first dataset is very low, meaning that the random selection of points in Geo-PPM will result in a very large number of possibilities and hence, to a very large processing time. For example, for the USGS+NGA combination (with larger area), the possibility that randomly selected pair of points from the pool of candidates is 1 1 1 exactly matched to the pair of points selected from the first dataset is . That × = 637 637 405769 is, in worst case, to find the right matching pairs, up to 405,769 combinations (on average) must be examined. However, as shown in the table, with Geo-PPM, we can achieve an acceptable level of precision and recall by examining between 33 and 52 candidate pairs, an improvement of up to 4 orders of magnitude over Geo-PPM.
Datasets
Number of Intersections
USGS+NGA (large area) USGS+US Census USGA+NGA (small area)
2367 + 2456
Average Number of Candidates for each point 637
2367 + 133 920 + 1035
Point Pairs Examined by prioritized Geo-PPM
Processing Time of prioritized Geo-PPM
Precision
Recall
43
946 sec.
91%
92.5%
514
52
48 sec.
82%
96.5%
371
33
132 sec.
95.8%
95.8%
Table 1: Performance of prioritized Geo-PPM
5 Conclusion In this paper, we discussed PPM, a brute-force approach to locate the matched points between two line vector datasets. We then discussed Geo-PPM in which some network information are utilized to reduce the computational complexity of PPM. In addition, Geo-PPM is independent of the spatial attributes of the datasets, rather, it only depends on the objects’ relative locations in the space. Hence, it can be applied to the vector datasets that are in unknown geometry systems. Moreover, we proposed prioritized Geo-PPM, in which we start by examining the pairs of points that have the minimum number of candidates. Our experiments showed that prioritized GeoPPM can achieve an acceptable level of precision and recall by examining only a very small number of pairs of points and hence, render Geo-PPM applicable even for large datasets.
Acknowledgements This research is based upon work supported in part by the National Science Foundation under Award No. IIS-0324955, IIS-0238560 (PECASE), in part by the Defense Advanced Research Projects Agency (DARPA) and Air Force Research Laboratory, Air Force Materiel Command, USAF, under agreement number F30602-00-1-0504, and in part by the Air Force Office of Scientific Research under grant number FA9550-04-1-0105. The U.S. Government is authorized to reproduce and distribute reports for Governmental purposes notwithstanding any copyright annotation thereon. The views and conclusions contained herein are those of the authors and should not be interpreted as necessarily representing the official policies or endorsements, either expressed or implied, of any of the above organizations or any person connected with them.
References [1] T. Barclay, J. Gray, and D. Stuz. "Microsoft TerraServer: A Spatial Data Warehouse", In Proceedings of the 2000 ACM SIGMOD International Conference on Management of Data, Dallas, TX, ACM Press, May 14-19, 2000, pp. 307-318. [2] D.E. Cardoze and L.J. Schulman. "Pattern Matching for Spatial Point Sets", In Proceedings of the IEEE Symposium on Foundations of Computer Science, 1998, pp. 156-165.
[3] C.-C. Chen. Automatically and Accurately Conflating Road Vector Data, Street Maps and Orthoimagery, Ph.D. Dissertation, Computer Science Department, University of Southern California, 2005. [4] C.-C. Chen, C. Shahabi, and C.A. Knoblock. "Utilizing Road Network Data for Automatic Identification of Road Intersections from High Resolution Color Orthoimagery", In Proceedings of the Second Workshop on Spatio-Temporal Database Management(STDBM'04), colocated with VLDB, Toronto, Canada, August 30, 2004, 2004, pp. 17-24. [5] C.-C. Chen, S. Thakkar, C.A. Knoblok, and C. Shahabi. "Automatically Annotating and Integrating Spatial Datasets", In Proceedings of the 8th International Symposium on Spatial and Temporal Databases (SSTD'03), Santorini Island, Greece, July 24-27, 2003, pp. 469-488. [6] L.P. Chew, M.T. Goodrich, D.P. Huttenlocher, K. Kedem, J.M. Kleinberg, and D. Kravets. "Geometric pattern matching under Euclidean motion", In Proceedings of the Fifth Canadian Conference on Computational Geometry, 1993, pp. 151-156. [7] M. Cobb, M.J. Chung, V. Miller, H.I. Foley, F.E. Petry, and K.B. Shaw. "A Rule-Based Approach for the Conflation of Attributed Vector Data", GeoInformatica, Vol. 2(1): 7-35, 1998. [8] M. Flavie, A. Fortier, D. Ziou, C. Armenakis, and S. Wang. "Automated Updating of Road Information from Aerial Images", In Proceedings of the American Society Photogrammetry and Remote Sensing Conference, Amsterdam, Holland, July 16-23, 2000. [9] A. Habib, Uebbing, R., Asmamaw, A. "Automatic Extraction of Primitives for Conflation of Raster Maps", Technical Report, The Center for Mapping, The Ohio State University, 1999. [10] S. Irani and P. Raghavan. "Combinatorial and experimental results for randomized point matching algorithms", Computational Geometry, Vol. 12(1-2): 17-31, 1999. [11] A. Saalfeld. "Conflation: Automated Map Compilation", International Journal of Geographic Information Sciences, Vol. 2(3): 217-228, 1988. [12] E.L. Usery, M.P. Finn, and M. Starbuck. "Data Integration of Layers and Features for The National Map", In Proceedings of American Congress on Surveying and Mapping, Phoenix, AZ, March 31- April 2, 2003. [13] V. Walter and D. Fritsch. "Matching Spatial Data Sets: a Statistical Approach", International Journal of Geographic Information Sciences, Vol. 13(5): 445-473, 1999. [14] J.M. Ware and C.B. Jones. "Matching and Aligning Features in Overlayed Coverages", In Proceedings of the 6th ACM International Symposium on Advances in Geographic Information Systems (ACM-GIS'98), Washington, D.C, ACM Press, November 6-7, 1998, pp. 28-33. [15] http://www.esea.com/products/
[16] http://www.digitalcorp.com/conflex.htm [17] Ching-Chien Chen, “Automatically and Accurately Conflating Road Vector Data, Street Maps and Orthoimagery”. Ph. D. Dissertation, University of Southern California, May 2005