IOP Conference Series: Earth and Environmental Science
PAPER • OPEN ACCESS
Automatic fruit classification using support vector machines: a comparison with artificial neural network To cite this article: Winda Astuti et al 2018 IOP Conf. Ser.: Earth Environ. Sci. 195 012047
View the article online for updates and enhancements.
This content was downloaded from IP address 191.101.101.242 on 14/12/2018 at 17:15
The 2nd International Conference on Eco Engineering Development 2018 (ICEED 2018) IOP Publishing doi:10.1088/1755-1315/195/1/012047 IOP Conf. Series: Earth and Environmental Science 195 (2018) 012047
Automatic fruit classification using support vector machines: a comparison with artificial neural network Winda Astuti 1, Satrio Dewanto 1, Khristian Edi Nugroho Soebandrija2 and Sofyan Tan1 1
Computer Engineering Department, Faculty of Engineering, Bina Nusantara University, Jakarta, Indonesia 11480 E-mail:
[email protected] 2 Indutrial Engineering Department, Faculty of Engineering, Bina Nusantara University, Jakarta, Indonesia 11480 E-mails:
[email protected]
Abstract. Food processing Technologies play important roles in supporting Making Indonesia (MI) 4.0. The effectiveness in food processing becomes emerging in the food industry. The automatic fruit classification system is becoming important for use in many food processing industries. A novel approach for classifying, using support vector machines (SVM) is presented in this paper. Fruit classification based on their shape is proposed in this work. The system differentiates the fruit based on their shape. Fast Fourier Transform (FFT) is extracted and later used as input to the SVM-based identifier. The fruit parameters are compared and classified, the results of computer simulation show that this technique produces better accuracy than that of the existing technique that is based on artificial neural network (Ann). The SVM also requires less training time than artificial neural network (Ann).
Keyword: food processing, fruit image, Fast Fourier Transform (FFT), Support Vector Machines (SVMs), Artificial Neural Network (Ann)
1.
Introduction
Currently, the emergence of world industrial revolution (IR) 4.0 which involved many advance technologies, such as artificial intelligent (AI), Internet of Thing (IoT), wearbeless, advance robotic technology and 3D printing [1], are highly developing. In the implementating of world progressing on IR 4.0, Making Indonesia 4.0, Indonesia focusing on five important factor, namely food and baverage, textile and apparel, automotive, electronics and chemical [2]. As food and beverage become the main focus of the MI 4.0, the encouraging the automation process in order to support the productivity became very important to be implemented, since this process impacted in the monitoring and sorting agriculture product. Nowadays, conventional fruit shorting systems still used human manually in order to separate many kinds of fruit. However, the conventional fruit shorting by human system has potential to be missclassify, because of tired, sick or not focus. Furthermore, Many of the miss classification fruit has
Content from this work may be used under the terms of the Creative Commons Attribution 3.0 licence. Any further distribution of this work must maintain attribution to the author(s) and the title of the work, journal citation and DOI. Published under licence by IOP Publishing Ltd 1
The 2nd International Conference on Eco Engineering Development 2018 (ICEED 2018) IOP Publishing doi:10.1088/1755-1315/195/1/012047 IOP Conf. Series: Earth and Environmental Science 195 (2018) 012047
occurred mostly due to the fatigue factor of the human. One of the solutions to the problem is by applying the automation in the fruit shorting system which capable of sorting the fruit correctly. The automatic sorting fruit system is one of the solutions to classify the agriculture industry in this case is fruit. The automatic fruit classification system is a process of shorting fruit automation to be implemented in the fruit industry of the farm. There are three important processes in the fruit classification system, namely image pre-processing process, feature extraction and pattern matching. Image pre-processing process is the step for processing the image before it extracted in the feature extraction technique in order of getting the information to be used as input to the patter matching step. There are many steps in the image processing step, such as covert of the color image to gray image, then the edge of the image is calculate from the gray image. The edge image is then extracted in order of getting the information of the image. Features are some quantities, which are extracted from preprocessed fruit image and can be used to represent the fruit image signal. Many features had been proposed such as Principle Component Analysis and Independent Componenet Analysis (ICA) [3]. Discrete Wavelet Transform (DWT) [4], [5] and Fast Fourier Transform (FFT)[6]. The extracted image is then classified based on pattern matching, which is a process to determine the speaker identity based on the feature extracted from the recorded voice. Also, many techniques for implementation had been proposed in the literature such as multilayers neural network [7] and fuzzy logic [7]. In this paper, support vector machines (SVMs), which is a relatively new machine learning technique, are introduced and proposed for fruit classification system. SVM is simple and very powerful method. This is due to optimization and generalization solution [8]. The proposed SVMs-based fruit classification system used Fast Fourier Transform (FFT) as input. The effectiveness of the proposed system is evaluated experimentally and compared with the existing method, artificial neural network. The results show that the proposed technique has produced the better level of accuracy compared to the existing method. Furthermore, it has less training time compare to the existing method. 2.
Proposed System
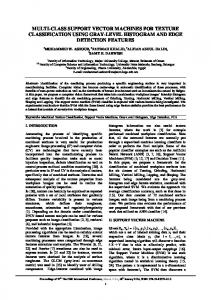
This paper considers two recognition and classification fruit for fruit classification system. The first is SVM, which is relatively new machine learning in the field of fruit classification. A polynomial kernel function is used as a kernel function of SVM. The other technique is an artificial neural network (Ann) which is a very popular pattern machine for fruit classification system. Multilayer perceptron (MLP) network with a backpropagation learning algorithm is the most well-known of Ann. A block diagram of the conventional fruit classification system is shown in Figure 1. The system is trained to classify fruit by camera and processed in the Personal Computer (PC). The fruit image is digitized and some of them are carried out to create a template for the fruit pattern and stored in the memory.
Figure 1. Block diagram of conventional fruit classification system
2
The 2nd International Conference on Eco Engineering Development 2018 (ICEED 2018) IOP Publishing doi:10.1088/1755-1315/195/1/012047 IOP Conf. Series: Earth and Environmental Science 195 (2018) 012047
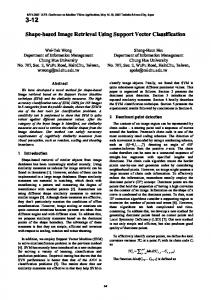
The proposed system for the fruit classification system as shown in Figure 1 the fruit image passes through a preprocessing stage. In this process is used to spectrally flatten the signal. After preprocessing process, the signal is then used as input to the feature extraction steps. In this process the preprocessing signal is then extracted into the feature vector which will be used as input for the classification system. Classification system consists of two important parts: training and testing phases. The process of developing the model of the signal called as training process, the system is trained to develop each of the fruit model. The model is then saved in the database. In the testing phase, the input data will match with the model in order to recognize the kind of fruit that classify[7]. The overall model of the proposed system for SVM-based fruit classification System in this paper is depicted in Figure 2. A digital fruit image passed through the processing stages from which Fast Fourier Transform features are extracted and passed through the SVM learning algorithm for both training and testing Fruit Image
Preprocessing image Fast Fourier Transfer Feature Extraction
Support Vector Machines (SVMs)
Fruit Classification
Figure 2. Fruit Classification system
In the Figure 2, the fruit classification system is separated into three main functions. 1. Image preprocessing. 2. Feature Extraction. 3. Pattern Matching. Image preprocessing is the process of converting a continuous image signal to a discrete form. It consists of uploading image into the PC, convert the color image into the gray image and determine the edge of the image (segmentation of the image). Feature Extraction is to extract a sequence of feature vector of the image signal that will be used as input to the system. There are many techniques that are used to extract the image such as wavelet transform [8], Principle Component Analysis (PCA) [3], Discrete Wavelet Transform (DWT) [5] and Fast Fourier Transform (FFT) [6]. In this research, Fast Fourier Transform (FFT) is used to extract the fruit image. Pattern matching is to measure the similarity between unknown feature vector and feature vector that is saved on the memory of the system. The model of the fruit image is constructed from the extracted feature of the fruit image signal. The pattern matching algorithm compares the incoming fruit image to the reference model and scores their difference, called as distance. The distance is used to determine the unknown pattern. There are two types of models: stochastic models and template models. In stochastic models, the pattern matching is a probabilistic result, such as HMM, Ann, and SVM. For template
3
The 2nd International Conference on Eco Engineering Development 2018 (ICEED 2018) IOP Publishing doi:10.1088/1755-1315/195/1/012047 IOP Conf. Series: Earth and Environmental Science 195 (2018) 012047
models, the pattern matching is deterministic such as dynamic time warping (DTW) with K-nearest neighbors (KNN). 2.1. Convert the image into the gray scale Many processing stages in image processing often need to convert the image into grayscale. In general, color images can be converted to grayscale images through the formula (2.1)[6]: 𝐼 = 𝑎 𝑥 𝑅 + 𝑏 𝑥 𝐺 + 𝑐 𝑥 𝐵, 𝑎 + 𝑏 + 𝑐 = 1 (2.1) With R indicate the red component, G indicates the green component, and B indicate the blue component. For example, the pixel has the component of R, G, B as follows : R = 50 G = 70 B = 61 If a, b, and c in the equation 2.1 make it all the similar, resulting number follow: I = (50 + 70 + 60) / 3 = 60 One of the examples which could be applied to the gray scale as shown in equation 2.2: 𝐼 = 0,2989 𝑥 𝑅 + 0,5870 𝑥 𝐺 + 0,1141 𝑥 𝐵 (2.2) 2.2 The segmentation Segmentation process using Canny Edge method. They are three key criteria of the Canny edge method [6]: A low error rate. It is important that edges occurring in images should not be missed and that there should be no response where edges do not exist. The detected edge points are localized. The distance between the edge pixels as found by the detector and the actual edge should be a minimum. There should be only one response to a single edge. The procedure can be summarized in the following steps: 1) The image is first smoothed using a Gaussian kernel. 2) Find the edge strength: this is achieved by taking the gradient of the image with the Sobel operators in the horizontal and vertical directions and then adding the magnitude of these components as a measure of the ‘edge strength’, as shown in equation 2.3 below; (2.3) E x, y G x x, y G y x, y Where E is Edge of the image, and G is a Gaussian operator in x and y-direction. 3) Calculate the edge direction, as shown in equation 2.4: tan
1
G y x, y
(2.4)
G x x, y
Where is the edge of the direction. 4) Digitize the edge direction: Once the edge direction is known, we approximate it to an edge direction that can be traced in a digital image. 5) Non-maximum suppression: After the edge directions are known, non-maximum suppression is applied. This works by tracing along the edge in the edge direction and suppressing any pixel value (i.e. set it equal to zero) that are not considered to be an edge. This will give a thin line in the output image. 6) Hysteresis: After the first five steps has been completed, the final step is to track along the remaining pixels that have not been suppressed and threshold the image to identify the edge pixels. Critical to the CAnny edge method, however, is the use of two distinct thresholds – a higher value T2 and a lower value T1. The fate of each pixel is then determined according to the following criteria: 4
The 2nd International Conference on Eco Engineering Development 2018 (ICEED 2018) IOP Publishing doi:10.1088/1755-1315/195/1/012047 IOP Conf. Series: Earth and Environmental Science 195 (2018) 012047
If |E(x,y)| < T1, then the pixel is rejected and is not an edge pixel; If |E(x,y)| > T2, then the pixel is accepted and is an edge pixel; If T1 < |E(x,y)| < T2, then the pixel is rejected except where a path consisting of edge pixels connects it to an unconditional edge pixel with |E(x,y)| > T2.
2.3 Feature extraction of the Image Feature extraction process using Fast Fourier Transform (FFT) [9]. FFT helps to decompose an input 2D image into real and imaginary components which are a representation of the image in the frequency domain[10]. Each point in the domain is represented as frequencies in Fourier or frequency domain. For an input image of size [M X N], FFT is given by [11], as shown in equation 2.5: F u , v
M ,N
I i , j e
i * 2 ki / M Ij / N
(2.5)
i , j 1
Where I is input matrix from the image. 2.4 Support Vector Machines (SVMs)
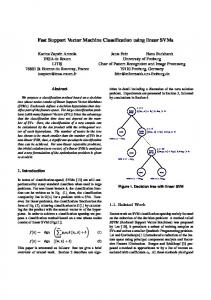
Support Vector Machine (SVM) was introduced by Vapnik in 1992, as a stabil and fast in the field of pattern recognition. As one method of pattern recognition, SVM age is still relatively young. However, evaluation of its ability in various applications places it as state of the art in pattern recognition, and today is one of the fastest-growing themes. SVM is a learning machine method that works on the principle of Structural Risk Minimization (SRM) in order to find the best hyperplane that separates data into two classes in the input space or called binary classification[12]. The basic concept of SVM can be explained simply as finding the best hyperplane which separated input data into two classes, as shown in Figure 3. The three important aspects of SVM are discrimination (optimal) hyperplane, optimization via Largrange multipliers and kernel function. Hyperplane is the optimal line which separated the data into two clasess. In the optimization via Lagrange multiplier, the SVM will find the best margin will keep the data closer to the hyperplane. The data lies on the margin called as support vector data (SV). This data is used as a reference data in the testing phases. The function of the kernel is to perform the different data to be separated clearly.
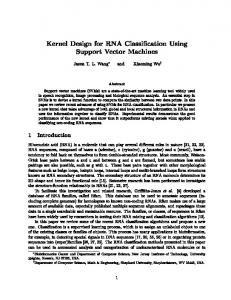
Figure 3. SVMs with linearly separable data. There are two types of the SVM data, namely linearly separated which data is separated linearly without introducing any misclassification data. In many practical situations, the non-linear separable case is often considered incorporation to linearly separable case. Figure 4 shows non-linear separable data with introduced miss-classification data
5
The 2nd International Conference on Eco Engineering Development 2018 (ICEED 2018) IOP Publishing doi:10.1088/1755-1315/195/1/012047 IOP Conf. Series: Earth and Environmental Science 195 (2018) 012047
Figure 4. SVMs with non-linearly separable data 2.5 Artificial Neural Networks (ANN) Approach
Artificial neural networks (Ann) are branches of Artificial Intelligence (AI), which mimics the workings of the human brain which is a neuron (nerve). The human brain consists of 10 billion neurons that are interconnected with each other. These relationships are called synapses. Neurons are widely divided into three important parts as shown in Figure 5, namely cell bodies, dendrites, and axons. Dendrites are the input unit that is as a place of entry signal. Cell body is a function to process the incoming signal. The axon is the output unit of the signal result of a cell body process. Relationship between 1 neuron to other neurons through the relationship of synapse[13].
Figure 5. The structure of the neuron One of the famous ANN types is the multilayer perceptron (MLP) network. This type of ANN is trained using backpropagation learning algorithm. The Multi-layer perceptron is consists of three main layers as shown in Figure 6. The three layers are input layer, hidden layer and output layer [14], respetivelly. The data are entered to the networks through the input layer. Data from the input layer will continue to the hidden layer which located in the middle part of the network. The weight of the layer will characterize the input data in the hidden layer. Last part of the ANN is the output layer, this layer is resulting the output of the training model and testing model.
Figure 6. Artificial Neural Network model
6
The 2nd International Conference on Eco Engineering Development 2018 (ICEED 2018) IOP Publishing doi:10.1088/1755-1315/195/1/012047 IOP Conf. Series: Earth and Environmental Science 195 (2018) 012047
3.
Experimental Result
3.1 Experimental Setup The experimental setup of fruit classification system is shown in the Figure 7, where a camera is used to record the fruit which is then sent to the PC. Furthermore, the feature extraction algorithm and SVMbased binary classification algorithm are implemented using MATLAB.
Camera
A/D
Figure 7. Fruit classification system The developed system identifies two different fruits, containing of six different cucumbers and six different potatoes. 3.2 Experimental results In order to evaluate the effectiveness of the proposed automatic fruit classification system, the proposed system is installed on the personal computer PC). In this proposes system the specification camera using 720p, it has a good quality image when detecting the image and capturing the image. Detection system using Viola-Jones method for detecting specify fruit on the image, as shown in Figure 8.
Figure 8. The fruit detected image. Once the fruit is detected, it will crop the face image and make it into a new image, as shown in Figure 9. In the Figure 8, the fruit detection image, is then changed from a color image, RGB, into a grayscale image in order to proses in segmentation steps.
Figure 9. Grayscale image. Segmentation process using the Canny edge method generally for detecting the edge and reducing noise from image face. The best result of the edge calculation face image depends on two distinct thresholds which are the higher value (T2) and lower value (T1). In this experiment, sample image use threshold T1 = 0.05, and T2 = 0.15. The segmented result as shown in Figure 10, the left side is the image after the face detection method is applied, the right Figure is the image after segmentation method is applied to the detection image. 7
The 2nd International Conference on Eco Engineering Development 2018 (ICEED 2018) IOP Publishing doi:10.1088/1755-1315/195/1/012047 IOP Conf. Series: Earth and Environmental Science 195 (2018) 012047
(a) Image before and after segmentation on sample 1
(b) Image before and after segmentation on sample 2 Figure 10. Before and after segmentation step of the image. After the segmentation stage of the image, pixel image will change into 0 on black edge and 255 on white edge matrix. White edge with 255 pixels will become the main point to get the graph X, Y of the data, as shown in Figure 11.
(a) Edge matrix image sample 1 (b) Edge matrix image sample 2 Figure 11. (a)-(b) Edge matrix image. Edge matrix has two element vector which is X and Y, row side and column side, respectively. In order to know the significant data, the edge matrix resulting data convert to a linear index, which is only one element vector as shown in Figure 12.
(b) Linear index sample 2 (a) Linear index sample 1 Figure 12. (a)-(b) Linear index samples. The segmented image is then applied to the feature extraction technique, Fast Fourier Transform, in order to get the highest amplitude of the frequencies, as shown in Figure 13. Using FFT (Fast Fourier Transform) to get the peak amplitude of the image. Each image has a different peak amplitude. From this experiment, there is six sample peak amplitude with two different fruits.
8
The 2nd International Conference on Eco Engineering Development 2018 (ICEED 2018) IOP Publishing doi:10.1088/1755-1315/195/1/012047 IOP Conf. Series: Earth and Environmental Science 195 (2018) 012047
(a) Peak amplitude Fast Fourier Transform sample 1
(b) Peak amplitude Fast Fourier Transform sample 2
Figure 13. (a)-(b) The FFT result of the two samples From 10 samples peak amplitude, five samples with two different people used for training and testing the data by using Ann (Artificial Neural Network). The training on Ann must be done multiple times in order to get zero error in the system. In this experiment, hidden layer is used for increasing recognition system and at the same time reducing error.
3.3 Training and classification The SVMs-based binary classification is applied to perform the fruit classification. Here, the polynomial kernel function is applied. In the training stage show that SVM-based fruit classification system gives results of 100% accuracy. The SVM-based system classification can perfectly classify the fruit based on their shape. The effectiveness of the proposed system, further experiment is carried out using another fruit data. The proposed system gives a classification rate of 100%. The Ann based multilayer perceptron (MLP) network with the backpropagation learning algorithm has been used in this paper and it contained of two hidden layers. The numbers of neuron in the input, two hidden and output layers are 1,90,11,1 respectively. The Ann gives 66.7% classification in training stages. This means the Ann not perfectly classifies all of the fruit. Furthermore, the results of analysis with another fruit data testing stage produce 50% classification rate. From the experimental result, it shows that the training and testing accuracy of the SVM have higher accuracy compared to the neural network. In terms of training time, the SVM is shorter than that of neural network. Therefore, it is clear that the proposed SVM-based fruit classification system can achieve classification rate as better than Ann-based fruit classification system. In addition, this good performance can be achieved in a shorter time as compared Ann-system. 4.
Conclusion
The automatic fruit classification system has been proposed and developed in this paper. This technique compared with the existing method based on Ann. The accuracy of the SVM based fruit classification system was found better than to the existing method based on Ann. It was also clear, from our computer simulation results, that the proposed method requires much less training time than the existing one. These results are two different fruits in the system considered. 5. [1] [2] [3] [4]
References J. Wood et al., “ASEAN 4.0: What does the Fourth Industrial Revolution mean for regional economic integration?,” 2017. A. Hartarto, “Making Indonesia 4.0,” 2016. G. Kumar, “A Detailed Review of Feature Extraction in Image Processing Systems,” pp. 5–12, 2014. D. Gupta and S. Choubey, “Discrete Wavelet Transform for Image Processing,” vol. 4, no. 3, 9
The 2nd International Conference on Eco Engineering Development 2018 (ICEED 2018) IOP Publishing doi:10.1088/1755-1315/195/1/012047 IOP Conf. Series: Earth and Environmental Science 195 (2018) 012047
[5] [6] [7] [8] [9] [10] [11] [12] [13] [14]
pp. 598–602, 2008. I. I. Journal, “IMAGE PROCESSING USING DISCRETE,” vol. 3, no. 1, pp. 53–59, 2015. A. Kadir and A. Susanto, Teori Dan Aplikasi Pengolahan Citra. Yogyakarta: Andi, 2013. W. Astuti and E. Byan Wahyu Riyandwita, “Intelligent Automatic Starting Engine Based on Voice Recognition,” IEEE SCOReD 2016, 2016. Z. Xizhi, “The Application of Wavelet Transform in Digital Image Processing,” 2008. D. Gunawan and Filbert Hilman Juwono, Pengolahan Sinyal Digital dengan Pemograman Matlab, 1st ed. Yogyakarta: Graha Ilmu, 2012. J. C. Russ, The Image Processing Handbook, Fourth Edi. CRC Press, 2002. A. Nithya and R. Krithiga, “Iris Recognition Based on GLCM and FFT Feature Set Fusion,” no. January, 2017. A. S. Nugroho, A. B. Witarto, and D. Handoko, “Support vector machine- Teori dan Aplikasinya dalam Bioinformatika,” Kuliah Umum Ilmu Komput., pp. 1303–1308, 2003. S. Rajasekaran and G. A. V. Pai, Neural Network, Fuzzy Logic and Genetic Algorithm: Synthesis and Applications. New Delhi, India: Prentice-Hall of India Private Limited, 2003. P. Liu and H. Li, Fuzzy neural network theory and application. World Scientific, 2004.
10