step in figure 1, that is, once every possible blob has been classified according with its shape and color, the last step consists on the recognition of the content.
Shape classification algorithm using support vector machines for traffic sign recognition P. Gil-Jim´enez, S. Lafuente-Arroyo, S. Maldonado-Basc´on, and H. G´omez-Moreno Dpto. de Teor´ıa de la se˜ nal y Comunicaciones. Universidad de Alcal´ a, 28871 Alcal´ a de Henares (Madrid) Spain {pedro.gil,sergio.lafuente,saturnino.maldonado,hilario.gomez}@uah.es
Abstract. In this paper, a new algorithm for traffic sign recognition is presented. It is based on a shape detection algorithm that classifies the shape of the content of a sign using the capabilities of a Support Vector Machine (SVM). Basically, the algorithm extracts the shape inside a traffic sign, computes the projection of this shape and classifies it into one of the shapes previously trained with the SVM. The most important advances of the algorithm is its robustness against image rotation and scaling due to camera projections, and its good performance over images with different levels of illumination. This work is part of a traffic sign detection and recognition system, and in this paper we will focus solely on the recognition step.
1
Introduction
A traffic sign recognition system basically consists on an image processing system mounted over a vehicle recording the road, and the goal of the system is the detection of all traffic signs present on the scene, and also its classification according with its shape, colors and meaning. Table 1 shows the meaning of traffic signs according with its color and shape. All the signs and properties described are for the Spanish traffic signs. Color Shape Meaning Red Rim Circle Prohibition Red Rim (Up) Triangle Danger Red Rim (Down) Triangle Yield Red Octagonal Stop Blue Square Recommendation Blue Circle Obligation White Circle End of prohibition Yellow Circle End of prohibition (construction) Table 1. Meaning of traffic signs according to its color and shape
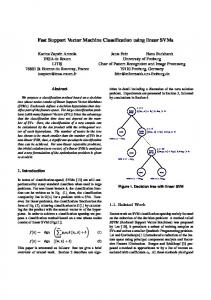
Fig. 1. Block diagram
In most cases, traffic sign research is divided into two basic steps, namely detection an recognition. The detection step is the process that determines which parts of the images are candidate to be a traffic sign. In many works [1], [2], [3], [4], the detection is based on a color-based segmentation, taking advance of the main colors used on traffic signs, as we can see in table 1. For that reason, red, blue, yellow and/or white are the most frequently colors used on the segmentation process. Once candidate blobs have been extracted from the image, some approaches implement a pre classification step according with its shape [1], [5]. From table 1, the shapes used in traffic signs are the equilateral triangle, the circle, the octagon and the square. With this additional step, we reduce the classification problem to a smaller number of classes, therefore reducing the time employed in the classification stage. In figure 1 we can see the block diagram of the traffic sign recognition system we have described. The algorithm described in this paper is related with the last step in figure 1, that is, once every possible blob has been classified according with its shape and color, the last step consists on the recognition of the content of the sign, and so, the identification of the sign. A complete description for the rest of the system can be found in [5]. Many works have been proposed for the recognition step. In [4], a NN is used to perform the classification of every possible blob. In [3], the identification of signs is carried out by a normalized correlation-based pattern matching using a traffic sign image database. In this work the classification task is performed by a SVM [6] as it will be described later. We have focused our algorithm on circular signs, since on these kind on signs, object rotations appear as a problem than can not be solved as easily as with other kind of shapes, where reorientation of the blob can be done from the edges of the sign.
2
Shape classification
Since the inside part of a typical traffic sign is normally composed of one or two colors, plus the background, a new segmentation process can be performed over the blob to separate the content of the sign from the background. After this process, the problem is reduced to classify the shape of the segmented object into one of all possible objects that can be found inside a traffic sign, that is, classify the sign according with its meaning.
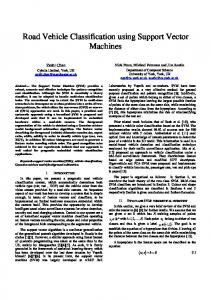
(a)
(b)
(c)
Fig. 2. Segmentation example. (a) Original blob, (b) Original blob without the red rim, (c) Segmented image
2.1
Segmentation
Figure 2 shows an example of sign segmentation for circular images with white background. In 2(a) we can see the blob corresponding to the sign. This blob is the output of the previous steps, as mentioned above. Since the previous steps has classified the sign into the circular group, we can approximately determine the center and the radius of the sign. With this two parameter, removing the red rim from the sign is straightforward. Obviously, this step must be different for every kind of sign, according with its shape and colors, but the procedure is the same for signs from the same category. In 2(b), the same sign is shown, where the red circular rim has already been removed. Once the rim is removed, the last process is the segmentation of the content of the sign. In figure 2(c) the segmented image is shown, where the segmentation has been performed over the luminance matrix, using an adaptive threshold. This process gives a certain robustness against illumination changes. 2.2
Object projection
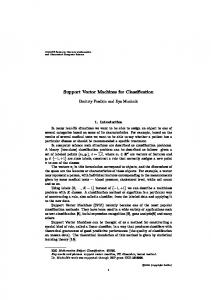
The classification of the segmented object now is performed computing the projections of the objects. These projections are computed at several values of θ, according with figure 3. As we will see later, this procedure give a great robustness against object rotations. For each value of θ, a new coordinates system, denoted uv, is generated, where the transformation matrix between this system and the image coordinates system (xy) is given by: ¶ µ ¶ µ ¶ µ cos θ sin θ x u = · y − sin θ cos θ v Since the projection of the object is computed for each value of θ, the whole operation will yield a two dimension matrix of size M x N (see figure 4), being M the number of values of θ where the projections are computed, and N is the number of samples of each projection. For a particular value of M, the value of θ for each iteration is incremented according with the following step: ∆θ =
2π M
Fig. 3. uv and xy coordinates system
The projections are computed over the coordinate u, (see figure 3). To make the results independent of the object size, and hence, robust to image scaling, N is a constant in the system, and the step between samples in the coordinate u are determined taking into account the size of the object. The maximum width of the object can be estimated from the second order moments in the angle of the least moment of inertia [7]. For a rectangle of height H, width B, and B > H, the second order moments are: µ20 =
B3 H 12
µ02 =
H3B 12
From these expressions, we can compute the width of the rectangle, B: s 122 · µ320 B=8 µ02 For an arbitrary shape, the previous expression allows us to estimate the maximum width of the object from its second order moments. In this case, the previously computed value of B is not its maximum width, but it leads us to determine the starting and ending values in the coordinate u where the projections are to be computed. These limits will be: −k
B B