Nov 11, 2013 - The reconstruction of 3D building models has been extensively ... because of outliers in input data and errors in their construction steps. .... result in incomplete interpretation and therefore a wrong model ... The conclusion is given in Section 4. ... contains constraints like slope symmetry for all four roof faces.
ISPRS Annals of the Photogrammetry, Remote Sensing and Spatial Information Sciences, Volume II-5/W2, 2013 ISPRS Workshop Laser Scanning 2013, 11 – 13 November 2013, Antalya, Turkey
EFFECTS OF BUILDING PRIMITIVE LIBRARY AND AUTOMATIC CORRECTION OF ROOF TOPOLOGY GRAPH B. Xiong a, *, S. Oude Elberink a, G. Vosselman a a
ITC, University of Twente, the Netherlands - (b.xiong, s.j.oudeelberink, george.vosselman)@utwente.nl Commission III, WG III-2
KEY WORDS: 3D Building Reconstruction, Point Cloud, Roof Topology Graph, Building Primitive Library
ABSTRACT: The reconstruction of 3D building models has been extensively researched in the last decade. The model driven methods, which fit building parts to predefined building primitives and glue them together into complete buildings, have been proved to be powerful. This paper solves two open questions left in prior works. Firstly, the primitive building libraries defined in literature are limited to few types of building structures. Therefore the undefined types of buildings could not be well represented by the primitive libraries. Secondly, the roof topology graphs used for interpreting the roof structures are assumed to be correct in previous works. In many cases, however, the roof topology graphs are inevitably wrong because of outliers in input data and errors in their construction steps. In this paper we solve the two problems and compare the improvements with prior woks. We introduce a complete building library, which can present planer buildings with arbitrary structures, and present an automatic method to correct the erroneous roof topology graph. Experiments show our method is robust to reconstruct buildings in both resident and commercial areas.
1. INTRODUCTION 1.1 Motivation The reconstruction of LoD 2 Building models has become a hot topic in recent years owing to the LiDAR technology develops quickly and its applications ask for methods which can get cheap and precise 3D building models. Building primitive libraries which introduce geometries regularities are often used in building model reconstructions. The direct fitting of primitive buildings to input data is computing expensive as the types and parameters of building primitives are determined by an exhaustive search. Roof topology graphs are typically constructed to interpret the building structures. They help to search the primitive buildings quickly and robustly. The roof top-graph will be split into subgraphs which match predefined primitive building shapes. Then all sub-buildings are reconstructed individually and glued together into a whole building in the CSG-like style. However, this methodology is confronted with serious challenges. First, a generic primitive library that is expressive to all buildings is difficult to define. The limited types of primitive building shapes can only handle less complex buildings. Therefore many buildings cannot be correctly reconstructed. Second, roof top-graphs are assumed to be correct. Roof topology graphs are powerful in inferring the roof structures, however, are inevitable erroneous. Due to noise, outlier and occlusion in the input point clouds, the detected point segments and their intersections are not reliable. Automatic correction of the roof topology graph becomes necessary. In this paper, we first expand the building primitive library and enable it to represent buildings with any complex structures. We find roof topology graphs can be split into three basic graph elements, including loose nodes, loose edges, and independent cycles, which accordingly present independent roof faces,
ridges, and corners in building structures. We define the building primitive library on the three basic elements. Therefore, buildings with arbitrary structures could be represented by assembling such building primitives. The second contribution is that we introduce a graph edit dictionary to correct the errors in the roof topology graph automatically. Each entry and its explanation of the dictionary are an error type and its correction rules. An erroneous roof topology graph is corrected by searching the most suitable entry in the dictionary and applying its correction rules. The corrected roof topology graphs are then used for interpreting the building structures. 1.2 Related Works Libraries of predefined primitive buildings are often used in LoD 2 building reconstruction from airborne LiDAR data and DEM. Primitive shapes help introducing constraints. The primitive buildings also suggest some reasonable models when the algorithm could not reconstruct correct buildings, while inhibiting outliers in the input data. Taillandier (2005) decompose building footprints into cells, each one is used as the footprint of a building primitive (Haala et al., 2006; Kada and McKinley, 2009). After the 3D primitives have been constructed for all cells, they are combined in a CSG-like manner to form a complex building model. Lafarge et al. (2010) use a Markov Chain Monte Carlo sampler (MCMC) and simulated annealing to find the optimal configuration of building primitives. Huang et al. (2013) narrow down the possible moves in the jump routine by only allowing change of a limited number of parameters in each step under some rules. Henn et al. (2013) propose to use RANSAC and a supervised classification method to search simple primitive buildings in sparse LIDAR data (1.2 points/m2). All of their methods use building primitive libraries. However, the libraries are limited to few building types. The building primitives strictly define the geometry regularities of roof planes, while sometimes they should loosed. (Brenner, 2005 ) introduce weak constraints
This contribution has been peer-reviewed. The double-blind peer-review was conducted on the basis of the full paper. doi:10.5194/isprsannals-II-5-W2-337-2013 337
ISPRS Annals of the Photogrammetry, Remote Sensing and Spatial Information Sciences, Volume II-5/W2, 2013 ISPRS Workshop Laser Scanning 2013, 11 – 13 November 2013, Antalya, Turkey which determine whether the constraints should be met by evaluating input data. (Li et al., 2011; Zhou and Neumann, 2012) discover global regularities of one object and adjust the plane parameters simultaneously. (Verma et al., 2006) define primitive shapes to be I, L, and U shaped, and so on, which are searched in roof segment topology graph. In order to represent more complex building, Elberink (Oude Elberink and Vosselman, 2009) expand the primitive model library, including gable, hip, gambrel and so no. The primitive shapes defined by Oude Elberink are finer in granularity than ones defined by Verma, so are more flexible to present complex building structures. However, many complex buildings still cannot be represented. This paper goes forward and thoroughly separated buildings into basic patterns of roof topology graph. So that any building structure can be assembled by such primitive shapes. The building primitives are usually composed by planer surfaces. This geometric assumption is not valid in many cases, in particular with architectural and historical buildings. (Kada, 2009) introduce curved shaped primitives. In our case, we only consider planer primitives on account of the two following reasons. First, our planer primitives could approximately represent the curved buildings, e.g. a cone roof is composed by six or more planer roof faces. The number of planer roof faces depends on the similarity. Second, the curved shaped buildings only have a low rate in a city, like less than 5%. The computing expense of directly fitting building primitives to input points increase quickly when building primitive library expand. Besides the roof structures are complex and the volume of the LiDAR data is huge. The topological relation of the roof faces is very helpful in finding the sub-shapes of the roofs. The roof topology graph is used to infer building primitives. It is a powerful representation of the inner structure of building roofs and is easy to combine with prior knowledge. However, a roof topology graph may have errors if the point cloud segmentation fails because of outliers or low point densities on poorly reflecting surfaces. The erroneous roof topology graph will result in incomplete interpretation and therefore a wrong model (Oude Elberink and Vosselman, 2009; Sampath and Shan, 2010). (Brédif, 2010) corrects the roof topology graph considering the 3D dual property. (Lafarge and Alliez, 2013) reconstruct polyhedron models from inexact adjacencies of surface planes. We design a graph edit dictionary based method to correct the erroneous roof topology graph automatically. The rest of the paper is organized as follows. In Section 2, we show a prior work on building reconstruction and introduce the proposed method, including a new primitive building library and a graph correction method based on the graph edit dictionary. The experimental results are shown in Section 3. The conclusion is given in Section 4.
2. METHODOLOGY In this section we first discuss the roof topology graph, which is the foundation of the building reconstruction algorithm in this paper. Then we show a prior work on building reconstruction, which gives a most complete primitive library in the-state-ofthe-art. We improve this reconstruction methodology in two folds. Firstly, the primitive library in the prior work is limited in building types. Therefore we expand the building primitive library and enable it expressive to very complex structures. Secondly, the roof topology graphs, which are essential in the reconstruction process, are inevitably incorrect, resulting
erroneous building models. Thereby we introduce a graph edit dictionary based method to correct the erroneous roof topology graph automatically. 2.1 Roof topology graph in building reconstruction The topological relationship of the roof faces is valuable to find intersection lines, step edges, as well as the sub-shapes of the roofs. By combining and intersecting the roof faces of basic shape, a polyhedral model can be reconstructed (Brunn and Weidner, 1997; Lafarge and Mallet, 2011; Maas and Vosselman, 1999; Sampath and Shan, 2010; Taillandier, 2005). The roof topology graphs can be used only if the roof faces are extracted reliably, now enabled by high accuracy and density point clouds obtained by laser scanning or dense image matching(Schnabel et al., 2007; Vosselman et al., 2004). The roof topology graph is a low-level feature comparing to building structures. It gives crucial clues about the building types and therefore speeds up the integrating of the building structures. It is much more effort-saving by searching the primitives in the graph space than rudely fitting models with input point clouds. Meanwhile the topology graph is easy to combine with prior knowledge. Therefore the roof topology graphs are used often to infer simple building primitives, like I, L, and U shaped primitives, which introduce geometry constraints for further improving models (Milde and Brenner, 2009; Oude Elberink and Vosselman, 2009; Verma et al., 2006). A topology graph is constituted by roof segments (graph nodes) and their adjacent relation (graph edge). If an intersection line exists between two roof segments, their corresponding nodes have an edge between them. A surface growing method (Vosselman, 2012) is applied to segment the point cloud into homogeneous planar patches, which are called roof segments. The topology graph only presents the topology relationship of the roofs, so is powerful to interpret building types. In order to identify building types precisely, the graph edges are labelled by the relative geometry of its two roof segments. Then the topology graph becomes a label graph. 2.2 Prior reconstruction methodology Existing literature describes how to produce topology graphs from segmented point clouds. These topology graphs are matched with a limited number of target graphs from a library (Verma et al, 2006 and Oude Elberink and Vosselman, 2009). As in this paper the focus is on comparing a new method with the target graph matching approaches, a short analysis on those existing methods is given here. The target graphs consist of a list of possible constraints that depend on the shape of the corresponding roof, represented by the graph. For example, a graph representing a pyramid roof contains constraints like slope symmetry for all four roof faces and enforcing horizontal gutter heights. Depending on whether a data or model driven reconstruction approach is followed, the constraints are either ignored or applied (Oude Elberink and Vosselman, 2009). Main limitation with the above mentioned approach is that there is no elegant solution in cases the topology graph from the data is affected by errors in segmentation and/or finding neighbourhood relations. Their pragmatic solution is to deliver all segments that did not match to a graph as a quality measure to 3D models which were reconstructed with the segments that did match (Oude Elberink and Vosselman, 2011).
This contribution has been peer-reviewed. The double-blind peer-review was conducted on the basis of the full paper. doi:10.5194/isprsannals-II-5-W2-337-2013 338
ISPRS Annals of the Photogrammetry, Remote Sensing and Spatial Information Sciences, Volume II-5/W2, 2013 ISPRS Workshop Laser Scanning 2013, 11 – 13 November 2013, Antalya, Turkey
One face model
Edge Edge Tag Tag
Horizontal ridge with one flat face Convex horizontal ridge
False segment
Missing segment
Concave horizontal ridge Convex oblique ridge Concave oblique ridge
Two faces model
Three faces model
False intersection line
Missing intersection line
Four faces model
N faces model
...
...
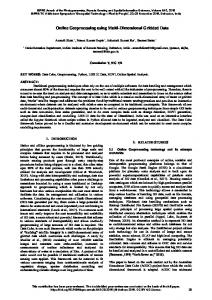
Figure 1. Building primitive library. Building primitives are grouped according to the number of nodes. In the first column, circles (graph node) present roof patches and lines (graph edge) denote the intersection line. Colours of graph edge present different edge attributes. Black line means the attribute is unknown.
2.3 New reconstruction methodology 2.3.1
A complete primitive library
We find the topology graphs only have three basic elements: loose nodes, loose edges, and independent cliques (IC). An independent clique is a group of nodes and edges in which each node can find a path to go back to itself without visiting an edge twice, but its subset could not form a cycle. The loose nodes and edges could not form a clique. As all topology graphs can be decomposed into the three basic elements, buildings with any complex structures are able to be represented by the primitives if they are defined based on these three elements. The building primitives introduce geometry regularities, which improve model quality in the reconstruction process. The regularities include boundary constraints and roof plane regularity. The roof plane regularities are symmetry, horizontal intersections, concurrent, and perpendicular. And the boundary regularities include identical height, perpendicular, and parallel. The building primitives are grouped according to the number of nodes and are shown in Figure 1. For visualization, only some frequent primitives are listed here. In order to make the graph of each primitive unique, graph edges are coloured according to the attributes of the intersections. The attributes describe the relative geometry of the two adjacent roof planes. Five attributes are used here (showed in Figure 1). The top three attributes are for horizontal intersections, which are differentiated by the roof geometry: the horizontal ridge with one horizontal face, the convex horizontal ridge has two sloped roof faces, which form a convex angle, and the concave horizontal ridge has two sloped roof faces, which form a concave angle. The bottom two attributes are for sloped intersection lines resulting from roof faces with a convex and concave angle, respectively. After construction of roof topology graph, building primitives are searching by finding basic sub-graph patterns. The searching results are then improved by checking the geometry of roof segments and ridge lines. Because the building primitives are
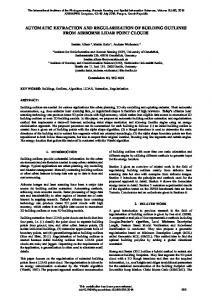
Figure 2. Four types of errors in the roof topology graphs.
defined based on the three basic graph elements, the searching of building primitives is looking up the basic elements in the roof topology graph. In order to speed up searching, we first search the loose edges and nodes, which are easy to find. Then they are removed from the roof topology graph for further searching of independent cliques. The independent cliques are searched based on a breath-first spanning tree. If a leaf of the spanning tree has an edge linking with a leaf from other branches, the nodes from current nodes to root node on both braches form a clique. 2.3.2
Automatic correction of erroneous roof topology graph
Errors in the topology graph are inevitable and negatively affecting the building reconstruction. Most 3D shape reconstruction methods request the topology relationship of primitive shapes, such as plane, sphere, cylinder, and so on. Because of outliers and occlusion, as well as the inevitable defects in the pre-processing steps, such as classification, segmentation, and intersection detection, the topology graph always have errors, which limit the correct construction. Although some reconstruction algorithms are robust to parts of the errors, the left ones still have serious negative impacts on reconstructed models.
Basic Error Pattern Input graph
Graph Edit Dictionary Correction
Output graph
Figure 3. Iteratively correction of roof topology graph by searching basic error types from graph edit dictionary.
The roof topology graph has four types of errors: false node, missing node, false edge, and missing edge (see Figure 2). The false and missing nodes denote the incorrect and missing detection of primitive shapes, which are planar roof segments in this paper. Even though the primitive shapes are detected with high accuracy, some of them will still be wrong or lost. The graph edges, which present the adjacency relationship of the shape primitives, are searched according to the predefined criteria. These criteria cannot be formulated such that all
This contribution has been peer-reviewed. The double-blind peer-review was conducted on the basis of the full paper. doi:10.5194/isprsannals-II-5-W2-337-2013 339
ISPRS Annals of the Photogrammetry, Remote Sensing and Spatial Information Sciences, Volume II-5/W2, 2013 ISPRS Workshop Laser Scanning 2013, 11 – 13 November 2013, Antalya, Turkey relationships are correctly detected. Furthermore, incorrect shape primitives will also result in incorrect adjacency relationships. The erroneous roof topology graphs should be corrected for further building structure interpretation and model reconstructions. We found that various types of error groups frequently occur in the reconstructed models. A graph edit dictionary is designed to recognise these error groups and apply a standard correction to the roof topology graph. The entries of this dictionary are pairs of erroneous sub-graphs of roof topology graphs and the corresponding corrected sub-graphs. By looking up an erroneous subgraph in the dictionary the translation to the correct subgraph can be found. As many roof topology graphs contain several erroneous sub-graphs, the input graphs need more than one correction by an individual edit rule. In this case the graph correction procedure iterates by again searching for the best match with sub-graphs in the dictionary. This procedure continues until the roof topology graph is accepted or until no further edit rules can be found that improve the roof topology graph. The workflow of roof topology graph correction is showed in Figure 3. An error in a roof topology graph is typically not a single basic error. If e.g. a roof segment is not detected in the point cloud, the node of this roof segment is missing in the roof topology graph as well as the edges representing the intersections with adjacent roof faces. Similarly, if a false edge is present in the graph, this will also impact the quality of the nodes on both sides. Consequently, the entries of the graph edit dictionary do not consist of the elementary graph errors only, but of compositions of various elementary errors. In addition to the nodes and edges that are incorrect, the dictionary entries also contain a few adjacent correctly reconstructed nodes and edges. These latter nodes and edges provide some further context in which the error happened and are valuable for the identification of the right error type and selection of the right graph edit rule. An example of graph edit dictionary is shown in Figure 4.
Figure 5. An example of graph edit dictionary. Top: typical errors and correction methods. Bottom: entries in the graph edit dictionary. The red dashed lines are false intersection lines in the building model and false edges in the top-graph. The red circles and lines represent new generated nodes and edges.
Once the graph edit dictionary has been composed it can be applied to the target graphs of building models that did not pass the overall acceptance test. First, the quality of all nodes and edges is evaluated leading to an attributed roof topology graph with one or more erroneous sub-graphs. Subgraph matching are then determined between the roof topology graph of a rejected model and the erroneous subgraph entries of the graph edit dictionary. Typically, multiple graph isomorphisms will be found as the sub-graphs in the dictionary are relatively simple. To select the best match the similarity of the sub-graphs is computed based on the quality attributes and labels of the nodes and edges. 3. EXPERIMENTS In this section we experimentally test the improvements of model quality by applying the new primitive library and automatic graph correction. Vaihingen (Germany) and Enschede (the Netherlands) dataset are chosen for the experiments. We use ALS data in the dataset to reconstruct
Figure 4. Reconstructed models in Enschede.
This contribution has been peer-reviewed. The double-blind peer-review was conducted on the basis of the full paper. doi:10.5194/isprsannals-II-5-W2-337-2013 340
ISPRS Annals of the Photogrammetry, Remote Sensing and Spatial Information Sciences, Volume II-5/W2, 2013 ISPRS Workshop Laser Scanning 2013, 11 – 13 November 2013, Antalya, Turkey buildings. The Vaihingen dataset is a public benchmark to compete the 3D building reconstruction algorithms. Three test sites were selected: Area 1 is characterized by dense development consisting of historic buildings having rather complex shapes. Area 2 is characterized by a few high-rising residential buildings. Area 3 is a purely residential area with detached houses. The ALS data were acquired using a Leica ALS50 system with 45° field of view and a mean flying height above ground of 500 m. The average strip overlap is 30% and the point density varies between 4 and 7 points/m2.
library plays crucial important role in the building reconstruction. Only the buildings which are already defined in the library could be well reconstructed. The buildings which are not predefined will be replaced by the most similar ones. Therefore sometimes they look good by visualization, or sometimes they are just odd. In fact, they are not correctly modelled. The library we introduced could present all building with planer surfaces in theory. Therefore, most of the buildings could be modelled correctly.
Figure 6. Reconstructed models of Vaihingen test areas. From left to right: area 1, area 2 and area 3.
Because the Vaihingen dataset only has about 100 buildings, not enough to test complexity of the primitive building library, we choose a much bigger dataset, Enschede (the Netherlands), with about 4500 buildings. Enschede is a middle city in the Netherlands, characterized by residential building with diverse structures in outskirt and a mall part of commercial buildings in downtown. The ALS has been acquired by the FLI-MAP system of Fugro Aerial Mapping B.V. The point density is on average about 20 points/m2. The reconstructed models by the new proposed method are showed in Figure 5 (Vaihingen) and Figure 6 (Enschede). The improvements by the new methods are discussed in following.
Figure 8. Two often wrong reconstructed buildings in the Vaihingen dataset. 1) Roof segments and ridges without correction; 2) Reconstructed models from 1); 3) Roof segments and ridges with correction; 4) Reconstructed models from 3).
>0.8m 0.5m 0.2m 0.1m