Available online at www.sciencedirect.com
ScienceDirect Procedia Environmental Sciences 24 (2015) 120 – 126
The 1st International Symposium on LAPAN-IPB Satellite for Food Security and Environmental Monitoring
Classification rules for hotspot occurrences using spatial entropybased decision tree algorithm Indry Dessy Nurpratami, Imas Sukaesih Sitanggang* Department of Computer Science, Bogor Agricultural University, Jl. Meranti Wing 20 Level 5 - 6, Bogor, 16680, Indonesia
Abstract Forest fire is a state where forest affected by fire that led to forest damage and may cause disadvantages in human life. Forest fire event can be monitored using satellite by detecting hotspots as fire indicators at certain times and locations. The purpose of this work is to develop a decision tree to predict hotspot occurrences in Bengkalis district, Riau province Indonesia using the spatial entropy-based decision tree algorithm. The data used are forest fire data in Bengkalis area. The data include city centre, river, road, income source, land cover, population, precipitation, school, temperature, and wind speed. The results of this work using the 5-fold cross validation test are decision trees with the average accuracy of 89.04% on the training set and 52.05% on the testing set. The tree has 560 nodes with the land cover layer as the root node. From the decision tree, as many 255 rules were obtained to classify hotspot occurrences. 2015Published The Authors. Published by Elsevier © 2015 by Elsevier B.V This is an openB.V. access article under the CC BY-NC-ND license (http://creativecommons.org/licenses/by-nc-nd/4.0/). Selection and peer-review under responsibility of the LISAT-FSEM Symposium Committee. Selection and peer-review under responsibility of the LISAT-FSEM Symposium Committee Keywords: Bengkalis; forest fire; hotspot; spatial decision tree; spatial entropy
1. Introduction Food and Agricultural Organization (FAO) place Indonesia on the 8th of ten countries with the largest natural forest in the world [1]. However, the area of forest in Indonesia is decreased every year with the rate of forest damages reached 1.87 million hectares per year in the period 2000 to 2005 [1]. One of the main causes of forest damages in Indonesia is forest fire.
* Corresponding author. Tel.: +62-251-862-5584; fax: +62-251-862-5584. E-mail address:
[email protected].
1878-0296 © 2015 Published by Elsevier B.V. This is an open access article under the CC BY-NC-ND license (http://creativecommons.org/licenses/by-nc-nd/4.0/). Selection and peer-review under responsibility of the LISAT-FSEM Symposium Committee doi:10.1016/j.proenv.2015.03.016
Indry Dessy Nurpratami and Imas Sukaesih Sitanggang / Procedia Environmental Sciences 24 (2015) 120 – 126
121
Forest fire led to the degradation of forests and caused losses in human life, including polluting the environment, disruption of human health and weakening economic wheel of the nation [2]. Forest fires can be monitored using satellites that detect hotspots at a particular time and location. A hotspot is an indicator of fire occurrence that is represented in points in a spatial dataset. According to data from NOAA-18 (National Oceanic and Atmospheric Administration) satellite, the number of hotspots in Indonesia from January to September 2012 had already reached 24663 points. Provinces with high hotspots concentration were West Kalimantan (5027 hotspots), Riau (4318 hotspots), South Sumatra (4297 hotspots), Jambi (1895 hotspots), Central Kalimantan (1736 hotspots), and East Kalimantan (1058 hotspots) [3]. Applications of data mining techniques including classification using decision tree have been done in several studies. A study proposed the procedure for building the decision tree on spatial data [4]. This work calculated the information entropy to determine the dataset partition. The dataset used in this work is The Yellow River Delta (YRD) soil dataset consisting of three explanatory attributes: soil structure, soil essence, soil salinity, and soil type as the decision attribute. All attributes are represented in polygons in thematic maps. This work yielded the association relationship between soil structure, soil essence, soil salinity and soil type in form of a decision tree and a set of classification rules. The decision tree rules were derived from the decision tree algorithm [4]. Another study applied the See5 decision tree algorithm to extract knowledge of soil-landscape models from a soil map [5]. See recursively grows a tree top-down through batch processing of the training data, using a greedy heuristic to search for a simple tree based on Information gain [5]. The training dataset consists of relevant environmental variables and spatial attributes including elevation, slope gradient, platform curvature, profile curvature, and geology, and the classified category (or ‘label’) is the soil type [5]. In addition to the aforementioned attributes, the study added the two variables representing the topological relations between soil types: the upslope neighbour and downslope neighbour of a given soil type [5]. In addition the conventional decision tree induction namely C4.5 was applied on Mangrove dataset [6]. The dataset consists of three groups: 1) a target containing analyzed objects i.e. the Mangrove area thematic layer, 2) geographical environment table factors of the target attribute including some thematic layers: district, landuse, substrate, geology, geomorphology, slope, and soil type, and 3) a target attribute: mangrove area and its categories. Predictive attributes are river, topography and other attributes obtained from geographical environment tables [6]. This work aims to apply the spatial entropy based decision tree algorithm on the forest fire dataset to classify the hotspot occurrences in Bengkalis, Riau Province, Indonesia. The classification was carried out to explore the relationship between the target object namely hotspot and non hotspot occurrences with other supporting factors. The criterion used to generate decision trees is spatial entropy. Integrating spatial entropy in classification can effectively reduce the number of classes generated by the decision tree [7]. The study [7] has built a decision tree based on entropy on spatial agricultural data in China. The data used are agriculture statistics for people in Republic of China in 1990 that have 22 attributes and 2743 entities. Type of data in this research is raster data model [7]. This research adopted the decision tree-model based on spatial entropy introduced by reference [6]. The forest fire data used in this research include city centre, river, road, income source, population, land cover, precipitation, temperature, school, and wind speed in the study area of Bengkalis district Riau Province, Indonesia. This research is expected to provide characteristics of areas where hotspots are potentially occurred. This information is useful in the prevention of forest fires. 2. Study Area and Data 2.1. Study Area This study is located in Bengkalis District, Riau Province, Indonesia. Bengkalis District has area of 7793.93 km2 which is divided into 8 sub-districts and 102 villages. Bengkalis District is lowland with the height in average between 2 to 6.1 meters above sea level. It has large organosol land that contains much organic material [8].
122
Indry Dessy Nurpratami and Imas Sukaesih Sitanggang / Procedia Environmental Sciences 24 (2015) 120 – 126
2.2. Data and Tools This research used hotspot data in 2008 obtained from FIRMS MODIS Fire/Hotspot, NASA/University of Maryland. Spatial data consists of 1) characteristic of regions in the study area including rivers, roads, and city centres, land cover and administrative boundaries; 2) weather data consisting of daily temperature, maximum daily rainfall, and wind speed obtained from BMKG; 3) peatland data from Wetland International consisting of type and the depth of peatland; 4) data socio-economic in 2008 which includes sources of income obtained from Statistics Indonesia. The tools used in this work are Python 2.7.5 as programming language, PostgreSQL 9.2.1 as a database management system, PostGIS as an extension to PostgreSQL for spatial data management, Quantum GIS 2.0.1 for spatial data processing and visualization. 3. Methods 3.1. Research Steps Classification is the process of finding a model (function) that explains and distinguishes classes or concept. The purpose of classification models is to determine unknown class labels in the new dataset. Classification is categorized as a predictive data mining task. The model is created in two main step namely learning and classification. In learning phase, data with class labels are trained to create the model. Furthermore, the model is tested on the testing set in order to calculate accuracy of the model. If the accuracy of the model is accepted then the model can be applied to predict unknown class labels in the new dataset [9]. In spatial classification, a classification method is applied spatial data. In this work a spatial classification model was developed using the spatial entropy-based decision tree algorithm. Spatial entropy-based decision tree algorithm generates a classification process adapted to geographical data [7]. This research was conducted in several steps as follows: 3.1.1. Calculate distance between spatial objects In this research there are two types of attributes, namely nominal and ordinal. For an ordinal attribute, values in each category were converted to a numerical values with the maximum values is the number of categories. Then the numerical values are normalized using the following formulas [9]: 堅沈捗 伐 な ...(1) """"""""""""""""""""堅沈捗 " 樺 岶な 警捗 岼 警捗 伐 な Where ø辿脱 is the ith value that is converted to a number. Mf is the number of categories in the data. Distance between object j and object k which have ordinal attribute dist(j,k), was calculated by applying the Euclidean distance formula as follows [9]: 権沈捗 噺 "
態
態
穴件嫌建岫倹 倦岻 噺 " 盤捲珍怠 伐 捲賃怠 匪 髪 盤捲珍態 伐 捲賃態 匪 髪 橋"髪 盤捲珍椎 伐 捲賃椎 匪
態
...(2)
Where xjp is a normalized value of the object j with the attribute p. xkp is a normalized value of the object k with the attribute p. Distance between the object j and the object k that have nominal values dist(j,k) is calculated as follows [9]: 穴件嫌建岫倹 倦岻 噺 "
喧伐兼 喧
...(3)
Where p is the total number of attributes describing the objects. m is the number of matches. Distance between the object j and the object k, dist(j,k), for mix attribute types is computed using the following formula [9]: 穴件嫌建岫倹 倦岻 噺 "
岫捗岻 岫捗岻 デ椎捗退怠 絞珍賃 " 抜 " 穴件嫌建珍賃 岫捗岻 デ椎捗退怠 絞珍賃
...(4)
123
Indry Dessy Nurpratami and Imas Sukaesih Sitanggang / Procedia Environmental Sciences 24 (2015) 120 – 126
If the value of dist(j,k) in an ordinal attribute or a nominal attribute is zero then Á棚谷 is set to zero, otherwise if the value of dist(j,k) is not equal to zero then Á棚谷 is set to one [9]. 3.1.2. Calculate intra-distance (diint) and extra-distance (diext) Intra-distance (diint) and extra-distance (diext) are calculated using the formula as follows [9]: な 布 布 穴件嫌建岫倹 倦岻""""""""""""""""件血" 系沈 伴 な 欠券穴"穴沈沈津痛 噺" ""膏 系沈 抜 " 岫 系沈 伐 な岻 珍樺寵日 賃樺寵日
穴沈沈津痛 噺 " 穴沈勅掴痛 噺 "
な 布 布 穴件嫌建岫倹 倦岻""""""""件血"系沈 塙 系 欠券穴"穴沈勅掴痛 噺" ""紅 系沈 抜 " 岫 系 伐 系沈 岻 珍樺寵日 賃樺岫寵貸寵日 岻
...(5)
...(6)
Where C is the set of spatial object of a given dataset, Ci denotes the subset of C whose objects belong to the ith category of the classification, diint is the average distance between the object of Ci, diext is the average distance between the objects of Ci and the entities of the other categories, dist(j,k) gives the distance between the entity j and the entity k, λ is a constant taken relatively small, and β is a constant taken relatively high. These constants avoid the ‘noise’ effect of null values in the calculation of the average distances [7]. 3.1.3. Calculate spatial entropy The formula of spatial entropy is an extension of those of non-spatial one as follows [8]: 継券建堅剣喧検鎚 岫罫畦岻 噺 " 伐"布
穴沈沈津痛 勅掴痛 "鶏沈 "健剣訣態 鶏沈 沈退怠 穴沈 津
...(7)
Where 2辿" is the number of objects that have the category i over the total number of objects, n is the number of categories in enumerated domain of the target attribute [7]. 3.1.4. Calculate information gain, that is formulated as follows: 罫欠件券鎚 岫罫畦 鯨畦岻 噺 継券建堅剣喧検鎚 岫罫畦岻 伐 " 布
塚"樺""蝶銚鎮通勅鎚"岫聴凋岻
罫畦塚 "継券建堅剣喧検鎚 岫罫畦塚 岻 罫畦
...(8)
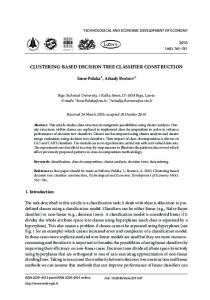
Gains (GA,SA) is value of information gain between the target attribut GA with the supporting attribut SA. Values(SA) gives the enumerated domain of the supporting attribute SA, GAv denotes a subset of GA where the corresponding value of SA is v for each record, |GAv| and |GA| denote the cardinality of GAv and GA [7]. The computation of decision tree is as follows: step 1: the supporting attribute that have the largest information gain will be selected as the label of the root node. Step 2: the dataset is divided into subsets according to the values of root node. Step 3: iteratively apply the step 1 and 2 to branches until there is no other supporting attributes available or the entropy is null [7]. 4. Results and Discussion 4.1. Data Pre-Processing In order to prepare a dataset for data mining task, the following data pre-processing steps are performed: 4.1.1. Create the target layer The target layer consists of hotspots and non hotspot data. The non hotspot data were prepared using the desktop GIS tool Quantum GIS. Non hotspot points in the target layer were generated randomly around the hotspot points. To perform this step, buffers with the radius of 0.907374 km [10] were created from each hotspot point. The results are 685 points which were randomly generated as non hotspots (Fig. 1).
124
Indry Dessy Nurpratami and Imas Sukaesih Sitanggang / Procedia Environmental Sciences 24 (2015) 120 – 126
Fig. 1. Hotspot and non hotspot points
4.1.2. Calculate distance from target objects to nearest city, river, and road This stage was done using spatial queries processing in DBMS PostgreSQL with the extension PostGIS by joining the objects in the target layer and the objects in the explanatory layers. Distance from target objects to nearest road (min_distance) was calculated using the spatial operation ST_Distance with the geometry in the target layer and the road layer as the parameters. Furthermore the distance was converted to categorical data (dist_road) based on the following categories [10]: ‚ Low : min_distance i 2500 m ‚ Medium : 2500 m < min_distance i 5000 m : min_distance > 5000 m ‚ High Distance from target objects to nearest river (min_distance) was calculated using the spatial operation ST_Distance with the geometry in the target layer and the river layer as the parameters. Furthermore the distance was converted to categorical data (dist_river) based on the following categories [10]: ‚ Low : min_distance i 1500 m ‚ Medium : 1500 m < min_distance i 3000 m ‚ High : min_distance > 3000 m The same procedure was applied to the city centre layer. Minimum distance from target objects to nearest city centre (min_distance) was determined using the operator ST_Distance. Furthermore the distance is converted to categorical data (dist_city) based on the following categories [10]: : min_distance i 7000 m ‚ Low ‚ Medium : 7000 m < min_distance i 14000 m ‚ High : min_distance > 14000 m 4.1.3. Integrate the target layer and the explanatory layers In this step, all explanatory layers and the target layer were integrated into a single layer. The result was a new layer with 1512 records. The objects in the new layer were used to create spatial classification models using the spatial entropy based decision tree algorithm. In order to obtain accurate classifiers, duplicate objects were removed. The result is a dataset of 600 objects as the input of the algorithm.
Indry Dessy Nurpratami and Imas Sukaesih Sitanggang / Procedia Environmental Sciences 24 (2015) 120 – 126
125
4.2. Spatial Decision Tree The dataset for creating the decision trees was divided into five subsets. There were five decision trees generated from the five training sets. The spatial decision trees were validated using the 5-fold cross validation. The accuracies of the trees are provided in Table 1. Table 1. Accuracy of the trees on training set and testing set Decision tree
Number of node
Number of rules generated
Accuracy on testing set
Accuracy on data training set
Tree 1 Tree 2 4.2.3. Tree 3 4.2.8. Tree 4 4.2.13. Tree 5 Average
579 560 4.2.4. 578 4.2.9. 535 4.2.14. 589
241 255 4.2.5. 256 4.2.10. 235 4.2.15. 255
54.17% 4.2.1. 56.00% 4.2.6. 50.98% 4.2.11. 50.50% 4.2.16. 48.62% 4.2.18. 52.05%
87.92% 4.2.2. 88.75% 4.2.7. 88.33% 4.2.12. 90.00% 4.2.17. 90.21% 4.2.19. 89.04%
Based on the results in Table 1 we conclude that the spatial entropy-based decision tree algorithm is well performed in the training set with average accuracy reaches 89.04%. However, the decision trees have low accuracy in the testing set with the average 52.05%. The decision tree with the highest accuracy on the testing set is the tree 2 with the land cover layer as the root node. Several rules resulted from the decision tree 2 are as follows: 1. IF land cover = un-irrigated agricultural field AND income source = plantation AND population density > 100 THEN hotspot occurrence is false. 2. IF land cover = un-irrigated agricultural field AND income source = plantation AND population density i 50 AND 1.5 km < distance to nearest river i 3 km AND distance to nearest city centre > 14 km AND 1 m/s i wind speed < 2 m/s AND 297 K i temperature < 298 K AND school density i 0.1 AND 3 mm/day i precipitation < 4 mm/day AND distance to nearest road > 5 km THEN hotspot occurrence is true. 3. IF land cover = paddy field AND income source = plantation AND distance to nearest city centre > 14 km THEN hotspot occurrence is true. 4. IF land cover = mix garden AND distance to nearest road > 5 km AND 1 m/s i wind speed < 2 m/s AND distance to nearest river i 1.5 km THEN hotspot occurrence is false. 5. IF land cover = plantation AND income source = forestry AND distance to nearest city centre > 14 km AND 1 m/s i wind speed < 2 m/s AND 1.5 km < distance to nearest river i 3 km THEN hotspot occurrence is true. The rule 1 states that the areas where hotspots are not probably occurred have the following criteria: 1) the land cover is un-irrigated agriculture field, 2) income source of community living in the area is plantation, and 3) population density is 100. Other rules require attributes such as road, city centre, river, school, precipitation, wind speed, and temperature to classify hotspot occurrences. 5. Conclusion This work results decision trees as the output of spatial entropy based decision tree algorithm. The algorithm was applied on the forest fire dataset for the study area Bengkalis district, Riau province Indonesia. The dataset contains 10 explanatory attributes indicating characteristics of the study area and a target attribute representing hotspots and non hotspots occurrences. The decision trees were tested using the 5-fold cross validation to obtain the best tree for hotspots classification. The average accuracy of the trees is 89.04% on the training set and 52.05% on the testing set. This work generated 255 rules from the best tree to classify hotspot occurrences based on city centre, river, road, income source, land cover, population, precipitation, school, temperature, and wind speed.
126
Indry Dessy Nurpratami and Imas Sukaesih Sitanggang / Procedia Environmental Sciences 24 (2015) 120 – 126
Reference 1.
[FWI] Forest Watch Indonesia. Potret Keadaan Hutan Indonesia Periode Tahun 2000-2009 [internet]. http://fwi.or.id/wpcontent/uploads/2013/02/PHKI_2000-2009_FWI_low-res.pdf; 2011. 2. Deliknews. Kebakaran Hutan di Riau, Sebabkan Kerugian Besar [internet]. http://www.deliknews.com/2013/06/21/kebakaran-hutan-di-riausebabkan-kerugian-besar/#.Up26NsQW15Y; 2013. 3. Sigit R. Kaleidoskop Tata Kelola Hutan di Indonesia: Hutan Masih Terbakar (Bagian-2) [internet]. http://www.mongabay.co.id/2012/12/31/kaleidoskop-tata-kelola-hutan-di-indonesia-hutan-masih-ter-dibakar-bagian-2/; 2013. 4. Jianting Z, Diansheng G, Qing W. Geospatial data mining and knowledge discovery using decision tree algorithm - a case study of soil data set of The Yellow River Delta. The Proceedings of Geoinformatics Conference, Ann Arbor 19-21 June 1999: pp 1-8. 5. Qi F, Zhu AX. Knowledge discovery from soil maps using inductive learning. International Journal of Geographical Information Science 2003; 17 (8):771–95. 6. Sitanggang IS, Napthalena HW. Application of spatial decision tree in identifying mangrove area using C4.5 algorithm. International Symposium and Exhibition on Geoinformation 2009. Kuala Lumpur, August 10-11, 2009. 7. Li X, Claramunt C. A spatial entropy-based decision tree for classification of geographical information. Transaction in GIS 2006; 10 (3): 451-67. 8. Riau. Kabupaten Bengkalis [internet]. http://www.riau.go.id/index.php?/detail/6; 2013. 9. Han J, Kamber M. Data Mining Concepts and Techniques. San Francisco: Morgan-Kaufmann; 2006. 10. Sitanggang IS, Yaakob R, Mustapha N, Ainudin AN. Predictive models for hotspots occurrence using decision tree algorithms and logistic regression. Journal of Applied Science 2013; 13 (2): 252-61. DOI:10.3923/jas.2013.252.261.