Benchmarks Detection of protein interactions based on GFP fragment complementation by fluorescence microscopy and spectrofluorometry Mario Torrado, Raquel Iglesias, and Alexander T. Mikhailov Institute of Health Sciences, University of La Coruña, La Coruña, Spain BioTechniques 44:70-74 (January 2008) doi 10.2144/000112685
We have developed a set of simple modifications of the green fluorescent protein (GFP) fragment reassembly assay in bacteria that permits: (i) fluorescent microscopy visualization of GFP reassembly only 1–2 h after induction of protein expression, thus approximating the detection of GFP reassembly to the real-time dynamics of protein complex formation in living cells; (ii) spectrofluorometric detection of reassembled GFP fluorescent signals directly in lysates from cell suspension thereby avoiding, in many cases, the need for tag-affinity isolation of protein complexes; and (iii) comparative quantification of signal intensity in numerous cell-sample lysates using a Bio-Rad IQ5 spectrofluorometric detection system (Bio-Rad Laboratories, Madrid, Spain). Collectively, the results demonstrate that the combination of microscopic and spectrofluorometric detection provides a time-saving and sensitive alternative to existing methods of fluorescence complementation analysis.
Protein fragment complementation methods based on the fusion of complementary fragments of a reporter protein to two putative interacting peptides allow protein interactions to be studied in living cells (reviewed in References 1–3). Among bimolecular fluorescence complementation methods, a complementation assay based on reassembly of green fluorescent protein (GFP) in doubly transformed Escherichia coli colonies (4) has been recently developed (5–7). Despite a promising success rate, certain technical challenges have limited the general applicability of this GFP reassembly assay. According to the experience of our laboratory, detection of protein fragment association using the original GFP reassembly protocol (5,6): (i) involved a considerable time lag (up to 10 days) to detect fluorescent colonies on the UV-exposed surface of agar plates; (ii) did not reflect the complex formation at one-cell level; and (iii) impeded the comparison of fluorescent signal intensity even in plate-matched colony samples. In addition, image capture of fluorescent colonies on agar plate by conventional photography is a state-of-art procedure that compensates for the dominant blue background generated by UV epi-illumination of the plates, making multiple plate analysis labor intensive and time consuming. To tackle these problems, we have developed a set of simple modifications of the original protocol (5–7) 70 ı BioTechniques ı www.biotechniques.com
that permits: (i) rapid fluorescent microscopy visualization of GFP reassembly in a single doubly transformed bacterial cell only 1–2 h after induction of protein expression; (ii) highly sensitive spectrofluorometric detection of reassembled GFP fluorescent signals directly in lysates from cell suspension thereby avoiding, in many cases, the need for tag-affinity isolation of protein complexes; and (iii) simultaneous comparative quantification of signal intensity in numerous cell-sample lysates using a Bio-Rad IQ5 spectrofluorometric detection system (Bio-Rad Laboratories, Madrid, Spain). Both microscopic and spectrofluorometric screens are performed at optimal fluorescence excitationemission wavelengths for detection of specific green fluorescence only. The latter results in a high signal-noise ratio and improved sensitivity. In model experiments, we used four plasmids obtained from Lynne Regan (Yale University): the two encoding Nand C-terminal segments of the GFP mutant sg100 (NGFP and CGFP) fused to two leucine zipper-coding sequences (designed here as LZ-1 and LZ-2, respectively) and two corresponding empty vectors. The GFP enhancedstability mutant sg100 contains F64L, S65C, Q80R, Y151L, 1167T, and K238N mutations from wild-type GFP, which leads to a single fluorescence excitation and emission maximum at 475 nm and 505 nm, respectively (4,7).
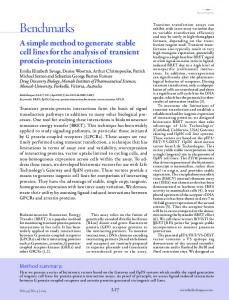
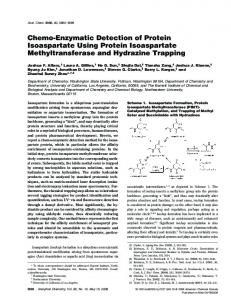
BL21-Gold(DE3) cells were cotransformed as described (5,6). To screen cells for GFP reassembly, instead of spreading transformed cells upon IPTGand arabinose-containing agar plates (5–7), we induced bacteria in liquid culture. Living cell-culture samples were removed at various times after induction and examined by fluorescent and phase contrast microscopy (see Supplementary Material available online at www.BioTechniques.com). Under the conditions used, the first green fluorescent cells were detected after 1-h incubation. Such a short time lag approximates the detection of GFP reassembly to the real-time dynamics of protein complex formation in living cells. Induction for 4 h yielded fluorescence in nearly all cells (Figure 1A). The identification of GFP reassembly with fluorescent cytological screen was in complete agreement with our results on subsequent screening for GFP reassembly in colonies originating from the same cell-suspension samples and cultured for 4 days on agar plates. In addition, fluorescent microscopic examination is characterized by higher sensitivity in terms of detecting GFP reassembly in any cell in which reassembly has already occurred as compared with visual detection of green fluorescent colonies on agar plates incubated for at least several days (5). We performed these experiments at the levels of induced protein expression necessary to detect the NGFP-LZ1 and LZ2-CGFP fusion proteins in total bacterial lysates by SDS-PAGE (Figure 1B), but fluorescent microscopy was found to be sensitive enough to detect GFP reassembly in a single cell at levels of this protein expression comparable to those of many endogenous E. coli proteins. The latter could be essential to ensure that a given complex formation may occur under conditions similar to total protein expression in transformed cells. Another benefit of testing GFP reassembly in liquid cell suspension versus agar-plated colonies (5,6) is that it allows for the extraction of protein complexes directly from cell pellets followed by highly sensitive spectrofluorometric detection of fluorescent signals in resulting protein extracts. We found that a significant portion of reassembled GFP complexes (up to 80% of reference fluorescent unit values corresponding to Vol. 44 ı No. 1 ı 2008
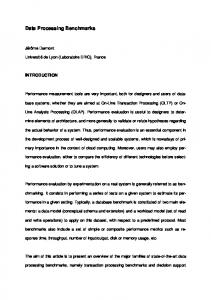
Benchmarks those of starting cell homogenate) can be extracted from doubly transformed bacterial cells using 0.2% Triton X-100 (see Supplementary Material), avoiding the need for tag affinity isolation of protein complexes. Moreover, the use of spectrofluorometric measurements is also advantageous because it allows previously uncorrectable background signals to be automatically detected and masked without losing data for any specific fluorescence (see Figure 1, C and D). Finally, signal intensities are highly correlated both for strong and weak signals, which is important for obtaining accurate and unambiguous signal intensity information from each test tube/well (see Figure 1, C and D). Moreover, the use of a Bio-Rad IQ5 spectrofluorometric detection system allows for simultaneous comparative quantification of signal intensity in numerous cell-sample lysates. We expect that this application will open an avenue for the routine usage of any qPCR equipment for multicolor experimentation for highly sensitive detection and comparative quantification of protein-protein interactions based on complementary reassembly of fluorescent reporter proteins in living cells. Described modifications extend the versatility of qPCR equipment use, although microplate spectrofluorometers are equally valid to screen GFP reassembly. In addition to using the artificial leucine zipper, we successfully applied the modified GFP reassembly screen described here to prove in vivo self-dimerization of cardiac ankyrin repeat domain 1 (ANKRD1) transcriptional co-factor, previously demonstrated by SDS-PAGE analysis of ANKRD1 amino- and carboxylterminal expressed proteins (8), as well as by the yeast two-hybrid system (9). It was found that ANKRD1 dimerization is mediated by its N terminus (NT) (8,9). In this work, the cells that were cotransformed with NGFP-NTANKRD1 + NT-ANKRD1-CGFP displayed GFP reassembly, as revealed by both fluorescence microscopy and spectrofluorometry. No fluorescence was detected in control cells cotransformed with NGFP-NT-ANKRD1 + CT-ANKRD1-CGFP (data not shown). Given that the ANKRD1 dimerization seems to be a weak interaction (9,10), the results highlight the sensitivity of the modified GFP reassembly assay. 72 ı BioTechniques ı www.biotechniques.com
A
C
B
Green Channel
Yellow Channel
Red Channel
D
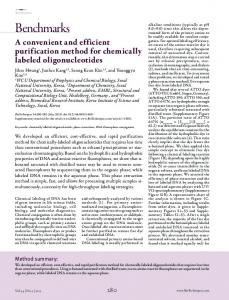
100,000 80,000 60,000 40,000 20,000 0
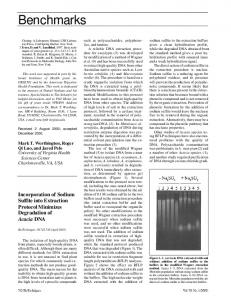
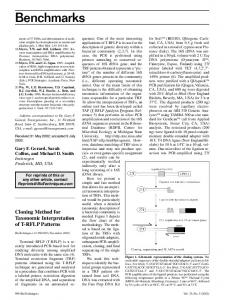
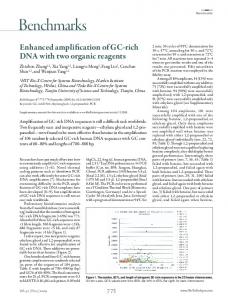
Figure 1. Microscopic and spectrofluorometric detection of green fluorescent protein (GFP) fragment reassembly in bacteria. (A) Detection of GFP reassembly in liquid cell cultures by fluorescent microscopy. Phase-contrast (left) and fluorescent (right) images of the cells cotransformed with NGFPLZ1 + LZ2-CGFP (row 1 and 2) and NGFP-LZ1 + CGFP (row 3, negative control). The images were acquired from living cells 4 h after induction of protein expression. Scale bar: 1 and 3 = 5 μm; 2 = 50 μm. (B) SDS-PAGE analysis of lysates obtained from cells transformed with NGFP-LZ1 + LZ2-CGFP (lane 1), NGFP-LZ1 + CGFP (lane 2), NGFP + CGFP (lane 3), and His-tagged NGFP-LZ1 isolated from the same bacterial extracts by Ni-agarose chromatography (lanes 4, 5, and 6, respectively). In both experimental variants, only cells cotransformed with NGFP-LZ1 + LZ2-CGFP (lanes 1 and 4) display the two bands (arrows) with apparent molecular weight (MW) values corresponding to the predicted sequence-derived MW of NGFP-LZ1 (23.9 kDa) and LZ2-CGFP (15.1 kDa). Co-purification of the LZ2-CGFP with His-tagged NGFP-LZ1 protein unequivocally confirms that GFP reassembly did take place in the cells cotransformed with NGFP-LZ1 + LZ2-CGFP but not in negative controls. (C and D) Spectrofluorometric detection and quantification of reassembled GFP signals in cell lysates. Serial dilutions of extracts from the cells cotransformed with NGFP-LZ1 + LZ2-CGFP or NGFP + CGFP (negative control) were run in a Bio-Rad IQ5 detection system (Bio-Rad Laboratories, Madrid, Spain). (C) Representative image on which reassembled GFP samples appear as white spots over the black background. Pink, saturated and partially saturated signals. (D) Subsequent quantification of signal intensity using excitation/emission filters for green fluorescence and Bio-Rad iQ software calibration options. For each measurement, the mean of triplicate tubes was calculated. RFUs, relative fluorescent units (see Supplementary Material for details).
To summarize, a combination of fluorescence microscopy analysis of doubly transformed bacterial suspension followed by detergent solubilization of the cells and spectrofluorometric analysis of cellular lysates improve sensitivity and reduce screening time to optimize the complementation assay
based on reassembly of GFP (4–7)—by modulation of cellular growth, induction of gene expression, or other culture conditions—in order to maximize the percentage of cells showing GFP fragment reassembly.
Vol. 44 ı No. 1 ı 2008
Benchmarks ACKNOWLEDGMENTS
Plasmid vectors encoding the fusions used were a generous gift from Dr. Thomas J. Magliery. This work was supported partially by a grant (no. SAF200401462) from the Spanish Ministry of Education and Sciences and partially by a grant (no. PGIDIT04BTF161001PR) from the Autonomous Government of Galicia, Spain. COMPETING INTERESTS STATEMENT
do you know enough about its dimerization properties? J. Muscle Res. Cell Motil. 27:203-204.
Received 28 September 2007; accepted 24 October 2007. Address correspondence to Dr. Mario Torrado, Institute of Health Sciences, University of La Coruña, Campus de Oza, Building “El Fortín,” La Coruña, 15006, Spain. e-mail:
[email protected] To purchase reprints of this article, contact:
[email protected]
The authors declare no competing interests. REFERENCES 1. Michnick, S.W. 2003. Protein fragment complementation strategies for biochemical network mapping. Curr. Opin. Biotechnol. 14:610-617. 2. Kerppola, T.K. 2006. Visualization of molecular interactions by fluorescence complementation. Nat. Rev. Mol. Cell Biol. 7:449-456. 3. Shyu, Y.J., H. Liu, and C.D. Hu. 2006. Identification of new fluorescent protein fragments for bimolecular fluorescence complementation analysis under physiological conditions. BioTechniques 40:61-66. 4. Ghosh, I., A.D. Hamilton, and L. Regan. 2000. Antiparallel leucine zipper-directed protein reassembly: application to the green fluorescent protein. J. Am. Chem. Soc. 122:5658-5659. 5. Wilson, C.G.M., T.J. Magliery, and L. Regan. 2004. Detecting protein-protein interactions with GFP-fragment reassembly. Nat. Methods 1:255-262. 6. Magliery, T.J., C.G.M. Wilson, W. Pan, D. Mishler, I. Ghosh, A.D. Hamilton, and L. Regan. 2005. Detecting protein-protein interactions with a GFP fragment reassembly trap: scope and mechanism. J. Am. Chem. Soc. 127:146-157. 7. Magliery, T.J. and L. Regan. 2006. Reassembled GFP: Detecting protein-protein interactions and protein expression patterns, p. 391-405. In M. Chalfie and S.R. Kain (Eds.), Green Fluorescent Protein: Properties, Applications and Protocols. John Wiley, Hoboken, NJ. 8. Torrado, M., E. Lopez, A. Centeno, A. Castro-Beiras, and A.T. Mikhailov. 2004. Left-right asymmetric ventricular expression of CARP in the piglet heart: regional response to experimental heart failure. Eur. J. Heart Fail. 6:161-172. 9. Witt, S.H., D. Labeit, H. Granzier, S. Labeit, and C.C. Witt. 2005. Dimerization of the cardiac ankyrin protein CARP: implications for MARP titin-based signaling. J. Muscle Res. Cell Motil. 26:401-408. 10. Mikhailov, A.T. and M. Torrado. 2006. The cardiac ankyrin repeat domain 1 protein: 74 ı BioTechniques ı www.biotechniques.com
Vol. 44 ı No. 1 ı 2008