our most ambitious attempt, ten sources (six speakers, rock music, raucous laughter, a gong and the Hallelujah chorus) were successfully separated, though this ...
BLIND SEPARATION AND BLIND DECONVOLUTION: AN INFORMATION-THEORETIC APPROACH Anthony J. Bell and Terrence J. Sejnowski Computational Neurobiology Laboratory, The Salk Institute, 10010 N. Torrey Pines Road, La Jolla, California 92037
1. INTRODUCTION AND ABSTRACT
(a)
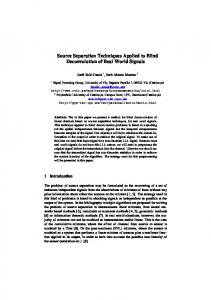
Blind separation and blind deconvolution are related problems in unsupervised learning. In blind separation [7], illustrated in Fig.1a, a set of sources, 1 ( ) N ( ), (di�erent people speaking, music etc) are mixed together linearly by a matrix a. We do not know anything about the sources, or the mixing process. All we receive are the superpositions of them, 1( ) N ( ). The task is to recover the original sources by nding a square matrix W which is a permutation of the inverse of the unknown matrix, A. The problem has also been called the `cocktail-party' problem. In blind deconvolution [6], illustrated in Fig.1b, an unknown signal ( ) is convolved with an unknown tapped delay-line lter, 1 L, giving a corrupted signal ( ) = ( ) � ( ) where ( ) is the impulse response of the lter. The task is to recover ( ) by convolving ( ) with a learnt lter 1 L which reverses the e�ect of the lter . Both problems are di�cult. In the case of blind separation, the approach is generally to assume that the sources, s, are statistically independent and nongaussian, then the problem of learning W becomes the problem of independent component analysis (ICA), [5]. In the case of blind deconvolution, the approach is often to assume that the original signal ( ) consisted of independent symbols (a white process), then deconvolution becomes the problem of removing from ( ) any statistical dependencies across time, introduced by the corrupting lter . This process is sometimes called the whitening of ( ). Both ICA and whitening require higher-order statistics. Only for gaussian signals is second-order decorrelation su�cient. Such higher-order statistics can come from the explicit estimation of cumulants and polyspectra [5, 6] or from the usage of static non-linearities in the stochastic weight update algorithm [3, 7]. The Taylor series expansions of these non-linearities produce higher-order moments. The particular higherorder moments produced are not rigorously related to s
N
x
t ; : : :; s
t ; : : :; x
t
a ; : : :; a
a t
s t
a t
s t
x t
w ; : : :; w
a
s t
x t
a
x t
A
(b)
u
x
u(t)
W
w(t)
BLIND DECONVOLUTION
x(t)
t
s t
x t
s
a(t) unknown mixing process
unknown convolution
s(t)
BLIND SEPARATION (learnt weights)
Figure 1: (a) Blind separation of 5 mixed signals. (b) Blind deconvolution of a single signal. those required to exactly calculate statistical dependencies, but nonetheless, these techniques have met with some success. In this contribution, static non-linearities are used in combination with an information-theoretic objective function, making the approach more rigorous than previous ones. We derive a new algorithm and with it perform nearly perfect separation of up to 10 digitally mixed human speakers, better performance than any previous algorithms for blind separation. When used for deconvolution, the technique automatically cancels echoes and reverberations and reverses the e�ects of low-pass ltering.
2. ENTROPY MAXIMISATION. The problem of reversing the convolution or static mixing of a signal or signals, s, is construed here as a maximisation of the entropy (y) of a non-linearly transformed signal y = (x) where is some function. Consider the joint entropy of two components of y (either two output channels in the case of separation, or two time points in the case of deconvolution): H
g
(
H y 1 ; y2
g
) = ( 1) + ( 2) ? ( H y
H y
I y 1 ; y2
)
(1)
Maximising this joint entropy consists of maximising the individual entropies while minimising the mutual
(a) y
fy(y)
1
w
y = g(x)
w
4
1
0
1
fy(y)
0
x
w0
0
fx(x) 0
y
1 2
x
x
wopt
3 0
w
y
f
H
x
y
information, ( 1 2 ), shared between the two. When this latter quantity is zero, the two variables are statistically independent. Both ICA and the `whitening' approach to deconvolution are examples of minimising ( 1 2) for all pairs 1 and 2 . This process is also known as redundancy reduction (Barlow 1989). By maximising (y), we will, in general, reduce (y). However there are cases where the absolute minimum will not be reached, because of interference from the other terms, ( i ). When is the hyperbolic tangent (or logistic) non-linearity, and the sources have super-gaussian (kurtosis 3) distributions, we have not found this to be a problem. However, on data other than speech, it may well pose problems. We describe how to maximise (y), rstly for blind separation. I y ;y
y
y
H
I
H y
g
>
H
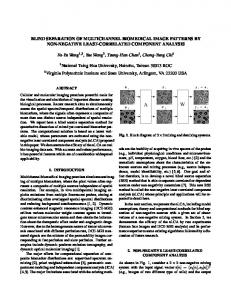
3. BLIND SEPARATION. When is a linear function (ie: i = Nj=1 ij j ), (y) can be increased merely by increasing the variances of the outputs without bound. Consider, however, the case when consists of a linear combination followed by a non-linear squashing function, such as y = (x) = tanh(Wx + w0) (2) where w0 is a vector of `bias' weights. In this case, too large a weight matrix W will lead to saturation of the outputs at �1. Too small a weight matrix will lead to outputs clustered around zero. Both extremes yield a low entropy probability density function (pdf) for y. In other words, (y) = ? [ln y (y)] (3) will be small. Fig.2a shows the highest entropy pdf of a single squashed output for a single input and a g
y
P
w
H
g
g
H
E
y
f
x
J
@y =@x
J
w
I y ;y
j j
where j j is the absolute value of the Jacobian of the transformation. The Jacobian is the determinant of the matrix of partial derivatives, [ i j ]ij . For a linear transformation followed by a non-linear function,
y
w
f
f
J
Figure 2: (a) Optimal information ow through a squashing function (Schraudolph et al 1992). Slope and threshold may be adjusted to maximise the entropy of y ( ). (b) y ( ) is plotted for di�erent values of the weight . The optimal weight, opt transmits most information. f
single weight . In Fig.2b, a family of such pdfs is shown for di�erent values of . To nd the optimal 's (those which maximise (y)), we use the following equation, relating the multivariate density functions of and y (Papoulis 1984): (4) (y) = x (x) w
(b) 1
x
= (det W)
N Y i=1
0
(5)
i
y
where i0 is the slope of the th output function. For (2), i0 = 1 ? i2 . Substituting (4) into (3) gives: (y) = [ln j j] + (x) (6) To maximise this by changing W, we need only concentrate on the rst term, which can be maximised using a stochastic gradient ascent rule, utilising (5): y
i
y
y
H
�W /
J
H
:
N X
W ln j j = W ln j det Wj + i=1 @
@
E
J
@
@
ln jy0 j
!
i
(7) This yields the simple rules for W and w0 : � � �W / WT ?1 ? 2yxT (8) �w0 / ?2y (9) The �w0 rule centres the tanh function on the input data x. The rst term in the �W rule forces the outputs y to represent di�erent components of the inputs (because any degenerate W will be an unstable point of the learning dynamics). The second term (an antiHebbian term) stops saturation. These opposing forces are exactly balanced to make the outputs nd independent components in the inputs, and adjust their weight vectors to achieve maximum entropy along each component [see (1)]. Because y is a non-linear function of the inputs, the anti-Hebbian term in (8) supplies the higher-order cross-moments necessary to nd the independent components (see discussion in [4, 5, 2]). The di�erence with the Herault-Jutten rule [7], is that the particular cross-moments used are well-motivated by our information-theoretic objective.
4. BLIND DECONVOLUTION. The same reasoning as above can be applied to the blind deconvolution problem. If we apply a static nonlinear function to produce ( ) in Figure 1(b), then we g
y t
can write the system either as a cascade of convolutions or as a matrix equation:
s
u
x
( ) = ( ( ) � ( )) = ( ( ) � ( ) � ( ))(10) y = (Wx) = (WAs) (11)
y t
g w t
x t
g w t
g
a t
s t
g
where y, x and s are vectors corresponding to time series, and A and W are matrices. When the ltering is causal, A and W will be lower triangular (Toeplitz). Because A?1 will also be causal, we can invert the effect of A with W. We can apply the same strategy as with blind separation, namely to maximise the entropy of the output vector y. Analogously to (7), this corresponds to maximising, by adjusting ( ), the log of the absolute value of the Jacobian of the transformation from x to y:
A
W
w t
ln j j = ln j det Wj +
M X
J
t=1
ln j 0 ( )j y
t
(12)
:
Here we sum over a time series of length , and 0 ( ) is the slope of the squashing function, , with respect to its input at time . The size of is chosen so as to be larger than the length of the lter ( ) but smaller than the length of the whole time series so that we have an ensemble of time series and may justify the maximisation of the entropy of the random vector y. Because W is lower-triangular, its determinant is simply the product of its diagonal values, which amounts to LM . This leads to the following simple1 rules for changing weights, when = tanh: M
y
t
g
t
M
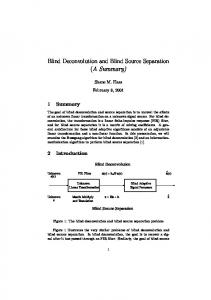
Figure 3: A 5 � 5 information maximisation network performed blind separation, learning the unmixing matrix w. The outputs, u = ?1 (y), are shown here unsquashed by the sigmoid. They can be visually matched to their corresponding sources, s, even though their order was di�erent and some (for example 1 ) were recovered as negative (upside down). g
u
w t
w
g
�
w
L
/
� L?j / w
M X t=1 M X t=j
�
1 ?2 L
w
x
�
(13)
t yt
(?2 t?j t ) x
(14)
y
Here, L is the `leading' weight, and the L?j , where 0, are tapp-ed delay lines linking t?j to t . In these rules, only the leading weight adjusts with a weightnormalisation term, while the delay weights attempt to simply decorrelate the past input from the present output. This latter process is what enables this technique to reverse the e�ect of low-pass ltering, and to remove echoes and reverberations from time series. w
w
j >
x
y
5. RESULTS. Results were obtained using 7 second speech segments from various speakers. All signals were sampled at 1 The corresponding rules for non-causal lters are substantially more complex.
8kHz from the output of the auxiliary microphone of a Sparc-10 workstation, and the waveforms were normalised to lie roughly between -3 and 3. Training of the weights was done with a `small-batch' variant of stochastic gradient ascent: in which weights were adjusted every 100 or so presentations of time points. To ensure stationarity in the training sequence, the time index was permuted before training. An important factor was the choice of learning rates|the proportionality constants in (8)-(9) and (13)-(14). A typical value was 0.001. It was helpful to reduce the learning rate during learning for convergence to good solutions.
5.1. Blind separation results. The architecture in Fig.1a and the algorithm in (8)(9) was su�cient to perform blind separation. A random mixing matrix, A, was generated with values usually uniformly distributed between -1 and 1. This was used to make the mixed time series, x from the original sources, s. The unmixing matrix, W, and the bias vector w0 were then trained. For two sources, convergence is normally achieved in less than one pass through the data. An example run with ve sources is shown in Fig.3. The mixtures, x, formed an incomprehensible babble. This unmixed solution was reached after around 106 time points were presented, equivalent to about 20 passes through the
complete time series.2 Any residual interference in Wx was inaudible, and the matrix WA was, on inspection, a permutation and rescaling of the identity matrix. In our most ambitious attempt, ten sources (six speakers, rock music, raucous laughter, a gong and the Hallelujah chorus) were successfully separated, though this took many hours. In all our attempts at blind separation, the algorithm has only failed when more than one of the sources were gaussian white noise or when the mixing matrix, A, was almost singular, both pathological conditions for blind separation algorithms. task
WHITENING
BARREL EFFECT
MANY ECHOES
no. of taps
15
25
30
tap spacing
1 ( = 0.125ms) 1
convolving filter ‘a’
10 ( = 1.25ms) 1
(a)
1
(e)
0.8
100 ( = 12.5ms)
1
15
ideal deconvolving filter ‘wideal ’ learnt deconvolving filter ‘w’
1
(i)
4
7
10
13
16
19
22
1
1
(j)
(f)
(b)
6 1
15
10
(c) 2
-0.75
-0.75
7
9
11
13
(k)
4
(g)
4
5
9
15 1
3
4
6
9
10
6
11
8
-10 -4
10
w*a
5
(d) 2
5
7
9
11
13
-4
(h)
(l)
4
15
4
-10
5
6
-1
2
6
7
8
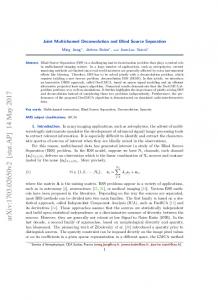
Figure 4: Blind deconvolution results. (a, e, i) Filters used to convolve speech signals, (b, f, j) their inverses, (c, g, k) deconvolving lters learnt by the algorithm, and (d, h, l) convolution of the convolving and deconvolving lters. See text for further explanation.
5.2. Blind deconvolution results.
Figure 4 shows various lters, their ideal inverses and the lters learnt by iteration of (13) and (14) using convolved speech signals. When lter taps were adjacent as in Fig.4a-d, the system learnt a whitening lter, Fig.4c, which attened the amplitude spectrum up to the Nyquist limit of 4kHz. Otherwise, when the taps were spaced further apart, and the speech was convolved with a nite lter, Fig.4e-h, or a truncated in nite lter, Fig.4i-l, good approximations to the inverse lters were learnt, without interference from `whitening' e�ects. The learning was sensitive enough 2 This took on the order of 5 minutes on a Sparc-10, using e�cient vectorised Matlab c code.
to replicate, in Fig.4k, the correction term on the left of Fig.4j, caused by truncation of the exponentially decaying echoes in Fig.4i. We have also combined the blind separation and deconvolution techniques, and performed simultaneous unmixing and deconvolution. More details appear in [2].
6. ACKNOWLEDGEMENTS. Many thanks to Nici Schraudolph, who initially described the idea in Fig.2a, shared his unpublished calculations [9], and provided detailed criticism. Constructive observations also came from Paul Viola, Barak Pearlmutter, Kenji Doya, Alex Pouget and Simon Haykin.
7. REFERENCES [1] Barlow H.B. 1989. Unsupervised learning, Neural Computation, 1, 295-311 [2] Bell A.J. & Sejnowski T.J. 1995. An information maximisation approach to blind separation and blind deconvolution, Neural computation, in press [3] Bellini S. 1994. Bussgang techniques for blind deconvolution and equalisation, in [6] [4] Comon P., Jutten C. & Herault J. 1991. Blind separation of sources, part II: problems statement, Signal Processing, 24, 11-21 [5] Comon P. 1994. Independent component analysis, a new concept? Signal Processing, 36, 287-314 [6] Haykin S. (ed.) 1994. Blind Deconvolution, Prentice-Hall, New Jersey. [7] Jutten C. & Herault J. 1991. Blind separation of sources, part I: an adaptive algorithm based on neuromimetic architecture, Signal Processing, 24, 1-10 [8] Papoulis A. 1984. Probability, random variables and stochastic processes, 2nd edition, McGrawHill, New York [9] Schraudolph N.N., Hart W.E. & Belew R.K. 1992. Optimal information ow in sigmoidal neurons, unpublished manuscript


![2mm Blind Image Deconvolution [PDF]](https://m.moam.info/img/260x300/2mm-blind-image-deconvolution-pdf_6479ba83098a9e024f8b45f4.jpg)