Brain Areas Specific for Attentional Load in a Motion-Tracking Task Jorge Jovicich1,2 , Robert J. Peters1 , Christof Koch1 , Jochen Braun1 , Linda Chang2 , and Thomas Ernst2
Abstract & Although visual attention is known to modulate brain activity in the posterior parietal, prefrontal, and visual sensory areas, the unique roles of these areas in the control of attentional resources have remained unclear. Here, we report a dissociation in the response profiles of these areas. In a parametric functional magnetic resonance imaging (fMRI) study, subjects performed a covert motion-tracking task, in which we manipulated ‘‘attentional load’’ by varying the number of tracked balls. While strong effects of
INTRODUCTION It has long been theorized that perceptual processing is limited in its capacity, that the massive amount of incoming sensory information is restricted at one or more points by a ‘‘bottleneck’’ (Broadbent, 1958). Inevitably, selective mechanisms must choose which input will be neglected in favor of attended objects that have preferential access to working memory and awareness. Although early psychological studies lead to disagreement about the site of selection (Treisman, 1969; Deutsch & Deutsch, 1963), Lavie (1995) proposed that the ‘‘attentional load’’ of a task may predict the processing stage targeted by selective mechanisms. Subsequent functional neuroimaging (Rees, Frith, & Lavie, 1997) and psychophysics (Alais & Blake, 1999) experiments have demonstrated effects of attentional load on sensory processing, but have not provided direct evidence for the brain mechanisms responsible for deploying attentional resources to the sensory areas. Following decades of neuropsychological studies of patients with attentional deficits and neglect (Driver & Mattingley, 1998; Posner, Walker, Friedrich, & Rafal, 1984), numerous functional brain imaging studies (Kanwisher & Wojciulik, 2000; Wojciulik & Kanwisher, 1999) have supported the idea that a distributed frontoparietal network of brain areas is a ubiquitous participant in a wide variety of tasks that demand visual attention. Furthermore, brain activity in many visual areas has been 1
California Institute of Technology, Center
2
Harbor-UCLA Medical
© 2001 Massachusetts Institute of Technology
attention—independent of attentional load—were widespread, robust linear increases of brain activity with number of balls tracked were seen primarily in the posterior parietal areas, including the intraparietal sulcus (IPS) and superior parietal lobule (SPL). Thus, variations in attentional load revealed different response profiles in sensory areas as compared to control areas. Our results suggest a general role for posterior parietal areas in the deployment of visual attentional resources. &
found to depend on attention (Gandhi, Heeger, & Boynton, 1999; Wojciulik, Kanwisher, & Driver, 1998; Beauchamp, Cox, & DeYoe, 1997; O’Craven, Rosen, Kwong, Treisman, & Savoy, 1997; Corbetta, Miezin, Dobmeyer, Shulman, & Petersen, 1990), even in the absence of changes in the visual stimulus. Using an ‘‘attentional pursuit’’ task, in which subjects covertly tracked a set of moving target balls among identical distracters, one study (Culham et al., 1998) found marked differences among visual, parietal, and frontal areas in the relative proportions of activation due to attentional task requirements and due to visual stimulation. Nevertheless, the quantitative relationship between attentional load and brain activity in these areas remains unsolved. One problem with comparing the performance of an attention-demanding visual task with passive visual stimulation is that task performance brings with it a host of other higher-order processes (e.g., vigilance, task set, response planning) which are presumably not attentional in character. Thus, the areas typically identified as ‘‘attentional’’ are likely to include areas that do not, strictly speaking, deserve this appellation. This problem can be addressed by considering activity that varies with attentional load, since this is likely to identify areas involved specifically in attentional selection, as opposed to other higher-order processes. The effects of attentional load can be studied using parametric functional magnetic resonance imaging (fMRI; Rees, Friston, & Koch, 2000; Buechel, Holmes, Rees, & Friston, 1998; Braver et al., 1997; Cohen, 1997; Boynton, Engle, Glover, & Heeger, 1996). Brain Journal of Cognitive Neuroscience 13:8, pp. 1048- 1058
activity is recorded while an experimental parameter, such as image contrast or motion coherency, is varied across multiple trials. Subsequently, the patterns of activation in each brain region are fitted separately to polynomial functions of the experimental parameter. The fitted polynomial coefficients can reveal what block-design experiments cannot: whether the relationship between brain activation and the experimental parameter includes constant (zero-order) effects, linear (first-order) effects, quadratic or higher-order effects, or some combination of these. In the context of visual attention, the zero-order term indicates effects of attention independent of attentional load, while first- and higher-order terms indicate direct effects of attentional load. However, the interpretation of the results of this approach is not always clear. Two studies (Sunaert, Hecke, Marchal, & Orban, 2000; Carpenter, Just, Keller, Eddy, & Thulborn, 1999) found a dissociation with weak or absent attentional load effects in task-relevant visual sensory areas (inferotemporal cortex for object processing, Carpenter et al., 1999; or V5/MT+ for motion processing, Sunaert et al., 2000), with stronger linear attentional load effects found in areas typically associated with the deployment of attentional resources. However, variations of task demand in these studies were dependent upon changes in the visual stimulus, confounding the interpretation of the attendant changes in brain activity as attentional load effects. We therefore sought evidence for attentional load effects in a parametric design fMRI experiment based on Pylyshyn’s ball-tracking paradigm (Pylyshyn & Storm, 1988), which requires covert attentional pursuit of a variable number of moving visual targets. This allows us to not only vary attentional load with a physically identical stimulus, but to cleanly distinguish
between the attentional and nonattentional processes that are associated with task performance.
RESULTS A ball-tracking paradigm (Pylyshyn & Storm, 1988) was used to evaluate human brain responses to different visual attentional load with blood oxygenation-level dependent (BOLD) contrast fMRI. In each trial, subjects were presented with a 2-D display showing 10 balls moving smoothly in random directions and in a nonoverlapping fashion (see Methods and Figure 1). Subjects were asked to track a cued subset of these 10 balls (none, 2, 3, 4, or 5 out of 10) for 14 sec while maintaining fixation. A parametric statistical model was used to characterize the relationship between attentional load and BOLD contrast throughout the brain, without a priori assumptions about either the form of that relationship or the location of the activated areas. Behavioral Responses Subjects’ accuracy at performing the tracking task was monitored during the fMRI sessions, and averaged 81 ± 17% for two balls, 83 ± 19% for three balls, 79 ± 11% for four balls, and 62 ± 5% for five balls. Note that except for the five-ball case, task performance did not change significantly with the number of balls tracked. This means that we could vary attentional load without significantly changing task difficulty (except for the five-ball case). Eye movements were recorded during training sessions outside the scanner (see Methods and Figure 2). Over all subjects and tasks, there were no smooth pursuits observed in any condition (0/min), but there were some small saccades (1.0/min) and large saccades (0.35/min), and a number of blinks (6.6/min). Paired t tests between
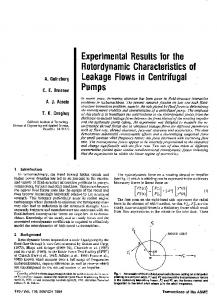
Figure 1. A schematic diagram of the visual stimulus used in (a) active-tracking and (b) passive-viewing trials. Each trial began with a text cue indicating the type of trial. This was followed by a period of static balls, in which the target balls were highlighted with white squares on active trials. These highlights then disappeared and the balls began a pattern of random, nonoverlapping motion. After 14 sec, the balls stopped moving, and on active-tracking trials subjects indicated (two-alternative forced choice, 2-AFC) whether a single highlighted ball was among the balls that they had been tracking. Following this response, the correct balls were rehighlighted to provide feedback to the subjects on the correctness of their response. These 20-sec ball-motion trials were interleaved with fixation-only periods (also 20 sec long), during which the subjects viewed a central fixation cross on an otherwise blank screen.
Jovicich et al.
1049
10
large saccades small saccade blinks
9 8 7
# per minute
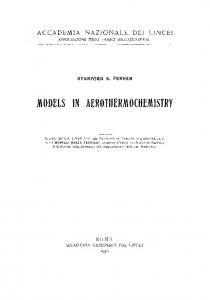
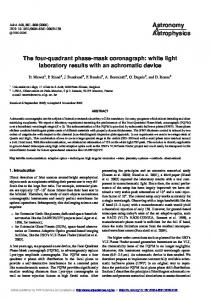
Figure 2. A summary of the eye movements observed in video recordings made outside the scanner. Shown here are the numbers of large saccades (>28), small saccades ( 18), and blinks under various conditions. Paired t tests showed no significant differences between the eye movements in passive-viewing and activetracking conditions, and there were no significant correlations between the number of balls being tracked and the number of eye movements. Smooth pursuits are not shown in this figure since none were observed in any condition. Overall, these results reveal that subjects were performing the tracking task properly—without eye movements, as they had been instructed.
6 5 4 3 2 1 0 all conditions
passive vie wing ( 0 balls)
active-tracking and passive-viewing conditions showed no significant differences in the number of small saccades ( p > .68) or large saccades ( p > .75). Furthermore, there was no significant correlation between the number of balls being tracked and the number of either small saccades (r = .13, p > .52) or large saccades (r = .08, p > .66). Taken together, the behavioral and eye movement results suggest that subjects were effectively tracking the targets covertly. In any case, it is unclear what benefit eye movements would accord in tracking multiple, independent targets. Therefore, differences in brain activity between the different tracking conditions cannot be attributed to eye movements, and more likely reflect different attentional processes. Functional Imaging A polynomial regression (Buechel, Holmes, et al., 1998) (see Methods) was used to characterize the BOLD contrast responses as a function of the visual attentional load at different levels (track 2- 5 balls). This amounts to modeling the brain activity A as a polynomial function of the attentional load L: A = a 0 + a 1 L + a 2 L2 + a 3 L3 + , where the coefficients a 0 , a 1 , a 2 , a 3 , . . . are determined separately for each brain region. Each component of this statistical model (i.e., zero-order a 0 , linear a 1 , quadratic a 2 , etc.) was tested to see if it accounted for a significant proportion of the variance, independently of the other components. In order to distinguish effects of attention from effects of the visual stimulus, a separate regressor 1050
Journal of Cognitive Neuroscience
all active tracking ( 2–5 balls)
2 balls
3 balls
4 balls
5 balls
was used to fit the brain response corresponding to the passive-viewing epochs (effectively, track 0 balls). In this part of the analysis the brain activity was averaged across all four subjects. We consider three categories of effects. Visual Motion Effects We first sought to determine which visual sensory areas were involved in passive processing of the motion stimulus, independent of task performance and attention. These areas are identified by the contrast in brain activity between the passive-viewing condition, in which subjects viewed the moving balls without attentive tracking, and the fixation condition, in which subjects viewed a central fixation cross on an otherwise blank screen. This contrast revealed strong bilateral activity in homologous positions consistent with human V5/MT+ complex (Tootell et al., 1995; Watson et al., 1993) (Figure 3a, Table 1). Additional significant bilateral activity was found in the primary visual cortex ( V1), the superior parietal lobules (SPL), the posterior intraparietal sulcus (PostIPS) and the frontal eye fields (FEF; Schall, 1997; Paus, 1996) (Figure 3a, Table 1). The coordinates of our FEF are within one standard deviation of those found in a meta-analysis investigating the location and function of the human FEF (Paus, 1996). V1 activation is likely to reflect differences between the physical stimuli compared. The activation in the parietal and FEF areas may be related to implicit attention processes (Corbetta, 1998); Volume 13, Number 8
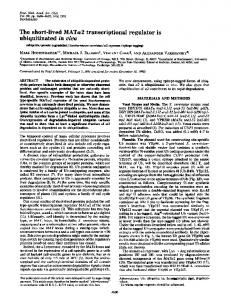
Figure 3. Average activation ( p < .05, corrected for multiple comparisons) across four subjects projected on posterior and superior views of a canonical brain surface rendered image. (a) Motion: areas that were significantly more activated during passive viewing of the moving balls compared to fixation. (b) Attention: areas that were significantly more active during attentive tracking of two to five targets than during passive viewing. (c) Attentional load: areas that exhibited a significant linear increase in activation with attentional load, determined by the number of targets being tracked. Abbreviations: See Table 1 for the definitions of the brain areas; L = left hemisphere; R = right hemisphere.
(a) Motion
(b) Attention
(c) Attentional Load
SPL
SPL
SPL
PostIPS
PostIPS PostIPS
L
R
V5/MT+
PostIPS
L
RL
V5/MT+
R
KO/LO
V5/MT+
V1
AntIPS
AntIPS TranPS L SPL
InfPreCS
TranPS
L
L
R
R
FEF
R
PMA/FEF
SMA
AC
however, because attention was not controlled in the passive-viewing conditions, a full interpretation of the activation in these areas is not possible based on this contrast.
activation in the cerebellum and weaker and less reliable activation (in two out of four subjects) in the basal ganglia. No significant attention effects were observed in V1 (Figure 3b, Table 1).
Effects of Task Performance Independent of Attentional Load
Effects of Attentional Load
Next, we determined which brain areas were activated by task performance independent of the attentional load. This activation presumably reflects a number of processes both attentional and nonattentional in nature. For example, task performance presumably involves a visual representation of tracked targets and attentional feedback to sustain this representations, as well as more generic processes such as task set, vigilance, and response preparation. The activation that results is indexed by the zero-order term of the polynomial regression, equivalent to contrasting the average brain activity while tracking two to five balls with the activity during passive viewing of the moving balls. Areas V5/MT+ and the posterior parietal cortex showed strong bilateral activation (Figure 3b, Table 1). The posterior parietal activity involved the SPL, extending ventrolaterally along the intraparietal sulcus (IPS), anterior (AntIPS) and posterior (PostIPS) to the SPL as well as the transverse parietal sulcus (TranPS). The strongest effect was observed in the SPL, bilaterally. Strong bilateral activity was also observed in primary motor areas (PMA) and supplementary motor areas (SMA), possibly hiding FEF active areas due to their close proximity (Paus, 1996). We also found significant
Finally, we searched for brain areas whose activity depended on attentional load, that is, the number of balls being tracked. This activation presumably reflects a smaller number of processes, most of which are attentional in nature. For instance, the number of tracked balls would be expected to change attentional feedback, and perhaps also the representation of tracked balls, but not more generic processes such as task set, vigilance, and response preparation. The activation in question is represented by the first- and higher-order terms in the polynomial regression. In particular, the first-order term modeled a linear relationship between brain responses and attentional load, after the zero-order attention effects had been taken into account. Several different brain areas showed a significant positive linear component. The strongest linear effect was found bilaterally in the posterior parietal cortex (Figure 3c, Table 1; SPL, AntIPS, and TranPS), where strong zeroorder attention effects were also measured. Significant linear effects were also observed bilaterally in the cerebellum (Table 1). Weaker but still significant positive linear effects of attentional load were found bilaterally in V5/MT+ ( p < .001, uncorrected due to a priori hypothesis) and posterior to the V5/MT+ complex, in locations consistent with Jovicich et al.
1051
Table 1 Talairach Coordinates of Brain Areas Showing Significant Activation Averaged Across All Four Subjects for the Different Contrasts Brain Areas
Talairach Corrdinates [xyz] Left Hemisphere
Middle
Motion Effects
Right Hemisphere
Attention Effects
Attentional Load Effects
(t value), Passive > Fixation
(t value), Tracking > Passive
(t value), Linear Increase with # Balls
13.8**
16.7**
6.2**
-
7.0**
6.4**
Parietal SPL
[ 27
57 69]
TranPS
[21
57 72]
[ 1 54 63]
AntIPS
[ 45
30 42]
[45
37 47]
-
8.6**
5.5**
PostIPS
[ 24
81 39]
[27
78 48]
9.7**
6.5**
-
[ 36
6 48]
[27
9 51]
5.8**
13.7**
-
-
7.6**
-
-
5.6**
4.9**
Frontal FEF/PMA SEF/SMA
[0 12 54]
InfPreCS
[ 51 9 33]
[51 3 30]
AC
[0 24 48]
-
-
4.7*
-
-
Occipital V1
[ 30
90
3]
[27
90
9]
14.1**
V5/MT+
[ 51
75
3]
[51
75
3]
12.7**
KO/LO
[ 33
87 3]
[36
90 0]
-
Cerebellum
[ 36
63
[36
57
34]
-
6.1**
5.4**
[12
12
9]
-
5.0**
-
33]
[0
63
34]
7.8** -
4.2* 5.2**
Subcortical Basal ganglia [ 15
18 6]
Only the most significant peaks within each activated area are reported with their corresponding t values. Motion effects indicate increased activity during the passive-viewing condition relative to the fixation condition. Attention effects indicate increased activity during attentive tracking (averaged across two to five balls) relative to passive viewing. Finally, attentional load effects indicate significant linear increases in activity with the difficulty of the active tracking task, as determined by the number of balls being tracked. SPL = superior parietal lobules; TranPS = transverse parietal sulcus; AntIPS = anterior intraparietal sulcus; PostIPS = posterior intraparietal sulcus; FEF = frontal eye fields; PMA = primary motor areas; SEF = supplementary eye fields; SMA = supplementary motor areas; InfPreCS = inferior precentral sulcus; AC = anterior cingulate; V1 = primary visual cortex; V5/MT+ = motor areas; KO/LO = kinetic occipital cortex. ‘‘- ’’ = nonsignificant activation. Significance levels: *p < .001, uncorrected for multiple comparisons (weaker test for areas with an a priori hypothesis); **p < .05, corrected for multiple comparisons (stronger test).
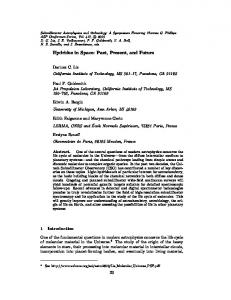
the ‘‘kinetic occipital’’ area (KO, p < .05, corrected) ( Van Oostende, Sunaert, Van Hecke, Marchal, & Orban, 1997) (Figure 4a, Table 1). Two areas in the frontal cortex showed a significant positive linear relationship between BOLD contrast and attentional load: the inferior precentral sulcus (InfPreCS, bilaterally but dominated by the left hemisphere, p < .05, corrected) and the anterior cingulate cortex (AC, p < .001, uncorrected due to a priori hypothesis), on the medial surface of the frontal lobes of the brain (Figure 4b,c, Table 1). No brain areas showed significant negative linear effects of attentional load. 1052
Journal of Cognitive Neuroscience
The second-order term in the polynomial regression modeled a quadratic relationship between brain responses and attentional load, after lower-order terms had been taken into account. Such a quadratic-order term did not significantly improve the overall statistical fit of the model in any brain areas; therefore, no higher terms were considered. To control for possible effects of task performance, we also investigated the correlation between BOLD activation and percentage correct responses in the brain areas that showed attentional load effects. No significant correlations were found. Volume 13, Number 8
Figure 4. Brain areas showing a significant positive linear relationship with attentional load ( p < .001, uncorrected for multiple comparisons): (a) loci corresponding to the stereotactic location (Table 1) of human V5/MT+ (Tootell et al., 1995) (red arrows) and human KO ( Van Oostende et al., 1997) (white arrows); (b) the InfPreCS; (c) the AC gyrus (linear effects in the midcerebellum and in the transverse IPS can also be seen). Brain activity was averaged across all four subjects and activation is overlaid on a canonical T1 anatomical image. Abbreviations: L = left hemisphere; R = right hemisphere; z values, Talairach coordinates.
(a)
(b)
(c) InfPreCS
L
R
V5/MT+
L
AC R
V5/MT+
KO
KO z = -9 mm
Characterization and Reproducibility of fMRI Responses In addition to the analysis based on a fixed-effects model of four subjects (Friston, Holmes, & Worsley, 1999) given above, the individual responses of each subject were also determined to assess intersubject variability. A few brain areas were selected to visualize both reproducibility across subjects and how attention modulated the BOLD signal: V5/MT+, basal ganglia, SPL, KO, AC, and InfPreCS. For each brain area, BOLD responses were plotted as a function of the number of tracked balls (Figure 5). As bilateral activation areas did not differ significantly in their activation, homologous regions were averaged between hemispheres. This provided a measure of the percentage signal change in BOLD contrast from the global mean, thus giving a direct measure of effect size. There was very good agreement in the form of response profiles across all subjects (Figure 5). Area V5/MT+ showed a strong attention effect during attentive ball tracking, but no linear modulation with attentional load. The same effect was present in the basal ganglia, however, here the effect was weaker and observed in two out of four subjects. The SPL, KO, InfPreCS, and AC showed a consistent linear modulation with attentional load. Given the good reproducibility of the responses across subjects, we calculated the average percentage BOLD signal change across all four subjects as a function of the number of attended targets in activated regions of interest (Figure 6). This revealed that (1) V1 shows strong visual activation but no significant attention or attentional load effects, (2) the motion-responsive areas show moderate attentional load effects (stronger in KO than in V5/MT+), (3) parietal areas show the strongest linear modulation effects (the strongest linear effects are
z = 30 mm
in SPL), and (4) frontal areas show little or no visual activation and relatively strong attentional modulation.
DISCUSSION Functional brain imaging in humans was used to investigate the neural basis for attentional load in a visual motion-tracking task pioneered by Pylyshyn and Storm (1988) and adapted to fMRI by Culham et al. (1998). Crucially, subjects viewed the same physical stimulus in all conditions. Brain activity was measured as subjects covertly, i.e., without moving their eyes, tracked a variable number of moving targets in a parametric study. This allowed us to distinguish the generic effects of task performance from more specific effects of tracking increasing numbers of targets. The latter (more specific) effects presumably reflect changes in the attentional feedback to, and the visual representation of, an increasing number of targets. Effects of Task Performance Independent of Attentional Load When comparing attentive tracking of two to five balls with passive viewing, the physical stimulus is identical. Thus, in the absence of any significant eye movements, differences in activity reflect all processes associated with task performance, including vigilance, attention, task set, and response preparation. In agreement with previous studies investigating task effects on visual motion (Sunaert et al., 1999; Buechel et al., 1998; Culham et al., 1998), we found that: (1) There is a distributed pattern of activation that includes posterior parietal areas (SPL, TranPS, AntIPS, and PostIPS), motion areas (V5/MT+), and frontal areas (InfPreCS), and (2) the degree of activation differs between areas, Jovicich et al.
1053
(a) V5 / MT+
(b) Basal Ganglia
% Signal change
% Signal change
3.5 3 2.5 2 1.5 1 0.5 0
0
2
3
4
5
0.6 0.4 0.2 0 -0.2 -0.4 -0.6 0
3
4
(c) Superior Parietal Lobes
(d) Kinetic Occipital
3.5 3 2.5 2 1.5 1 0.5 0 0
2
3
4
5
3 2 1.5 1 0.5 0 0
0 .5 0
3
4
5
-1
% Signal change
% Signal change
1
2
3
4
5
(f) Inferior Precentral Sulcus
1 .5
0
2
Number of balls tracked
(e) Anterior Cingulate
-0. 5
5
2.5
Number of balls tracked
2 1 .5 1 0 .5 0
0
2
3
4
5
-0 .5
Number of balls tracked
with the effects being strongest in the parietal areas (stronger in the SPL than in the IPS areas), smaller in V5/MT+, and nonsignificant in V1. These results are consistent with an attentional role of the activated areas (i.e., in generating the top-down signals that modulate incoming visual information; Wojciulik & Kanwisher, 1999) but fall short of demonstrating such a role conclusively. We also observed effects of task performance in the PMA, SMA, basal ganglia, and cerebellum, which may have been related to response preparation processes. In our experimental design, subjects were required to produce a two-alternative forced-choice response by pressing a button within a small time window (1 sec) after tracking. This complicates the interpretation of any activation in areas related to motor performance (Rizzolatti, Riggio, Dascola, & Umilta, 1987; Wise, 1985). Although the PMA, SMA, basal ganglia, and cerebellum are known to be associated with motor performance (Horwitz, Deiber, Ibanez, Sadato, & Hallett, 2000; Dei1054
2
Number of balls tracked
% Signal change
Number of balls tracked
% Signal change
Figure 5. For all four individual subjects, fMRI responses to attentional load are shown in representative brain areas: (a) V5/MT+, (b) basal ganglia, (c) SPL, (d) KO, (e) AC, and (f ) InfPreCS. The brain responses in each area are plotted as a function of the number of attended targets and expressed in percentage signal change relative to the global mean. This is equivalent to normalizing the responses to an overall mean of zero. Data are averaged between left and right hemispheres. The passive-viewing condition corresponds to zero tracked balls. Note the different scales used.
Journal of Cognitive Neuroscience
Number of balls tracked
ber, Ibanez, Sadato, & Hallett, 1996; Houk & Wise, 1995), we cannot rule out a secondary role in attention. Note that these areas were not reported to show attention modulation effects in studies in which behavioral performance was not recorded in the scanner (Buechel et al., 1998; Culham et al., 1998). These studies have, instead, reported attentional effects in FEF areas, which in our experiment are probably hidden by the PMA and SMA activation due to their spread and close proximity to FEF areas (Paus, 1996). Attentional Load Effects Many studies have found that activity in human extrastriate cortex is modulated when subjects are required to report on various aspects of visual motion (Sunaert et al., 2000; Buechel et al., 1998; Culham et al., 1998; O’Craven et al., 1997; Corbetta et al., 1990). We tried to identify activation specifically related to visual selective attention, that is, the process of distinguishing taskVolume 13, Number 8
change
( %)
3
BOLD signal
Figure 6. Brain activation produced during the ball-tracking task in regions of interest. The brain responses in each area correspond to the average effects across all four subjects and across the left and right hemispheres and are shown as a function of the number of tracked balls (zero balls corresponds to the passive-viewing conditions). The activation is expressed in percentage BOLD signal change relative to the global mean, as in Figure 5. See Table 1 for the definitions of the brain areas and the significance levels of the attention and attentional load effects. The strong attentional load effects in the posterior parietal and prefrontal areas contrast sharply with the pure sensory response in the primary visual cortex.
Number of balls tracked:
2.5
0 2 3 4 5
2 1.5 1 0.5 0 V 1 V 5 /MT + KO SPL Visual / Motion
relevant and task-irrelevant components of visual stimulation. To this end, we manipulated attentional selection—by varying the number of tracked targets—while keeping visual stimulation and motor responses the same. Moreover, task performance (percentage correct responses) remained largely the same, as well (at least while tracking two, three, or four balls). Our results show that the strongly load-dependent activity is restricted to a relatively small subset of the task-modulated areas (Figure 3b vs. Figure 3c). Attentional load effects were identified as first-order effects (linear relation between BOLD response and number of balls tracked). Although weak first-order effects were observed in motion-responsive areas (V5/MT+, KO) as well as the InfPreCS, AC, and the cerebellum, the strongest effects were found in the posterior parietal areas (SPL, AntIPS, and TranPS). All of these areas showed a positive linear relationship between BOLD responses and number of tracked balls. However, the particularly steep linear relation in the posterior parietal areas may point to a particularly direct role in attentional selection. Recent neuroimaging studies suggest that posterior parietal areas around the IPS play a general role in visual selective attention (Kanwisher & Wojciulik, 2000; Wojciulik & Kanwisher, 1999). It seems likely that this role includes the provision of feedback to visual areas in the occipital and temporal lobes, so as to differentiate between task-relevant and task-irrelevant responses to visual stimulation. We ex-
Ant IPS
Post Tran IPS PS
Parietal
InfPre AC CS Pre-frontal
pect that the generation of such feedback is one of the processes modulated by attentional load (number of tracked targets). Consistent with this expectation, our data reveal a strong and specific dependence of IPS activation on attentional load. Therefore, our results extend previous findings and suggest a specific role of the IPS in visual selective attention. The KO region has been implicated in the extraction of 2-D shape from motion, i.e., kinetic shape (Dupont et al., 1997; Van Oostende et al., 1997). During the training phase of our experiment, subjects reported that task performance is facilitated by tracking the imaginary 2-D polygon formed by the tracked balls. It is therefore possible that the linear effects found in the KO region may reflect processing of the increasingly complex spatial configurations created by the tracked balls. Finally, we observed a linear increase of BOLD signal in the AC with attentional load. This is consistent with proposals that AC activity reflects the selection demand of a task (Carter et al., 1998). However, the comparatively weak dependence of AC activation on attentional load suggests that any involvement of AC in visual selective attention is less direct than that of IPS. Conclusion Whereas previous studies have examined the general effects of attending and responding to visual motion, this study explores the specific effects of increased Jovicich et al.
1055
attentional load. To this end, we parametrically vary attentional load while keeping visual stimulation, behavioral task, and performance levels the same. The results demonstrate that attentional load affects a relatively circumscribed set of cortical areas to varying degrees. While attentional load makes only a marginal difference to motion-processing activity in areas V5/MT+, it has a somewhat stronger effect on other occipital and frontal areas (area KO, InfPreCS, and AC) and produces very strong and robust changes in the activation of posterior parietal areas (SPL, AntIPS, TranPS). These findings narrow down the possible neural substrates of visual selective attention in a covert visual-tracking task, highlighting in particular the importance of areas around the IPS.
METHODS Subjects Four neurologically healthy, right-handed volunteers (two males, two females; mean age, 24 years; range, 22- 28 years) with normal vision gave informed consent and participated in the study, which was approved by the Institutional Review Board at Harbor-UCLA Research and Education Institute. Stimulus Presentation Visual stimuli were presented on a shielded computer monitor, which subjects viewed through a small mirror mounted on the head coil. The stimulus presentation area covered 38 48 of visual angle. At the beginning of each trial (Figure 1), subjects first saw for 2 sec a word indicating whether their task would be active tracking (‘‘TRACK’’) or a passive viewing (‘‘PASSIVE’’). Next, 10 orange balls ( 0.38 diameter) appeared at random positions on the screen, along with a central fixation cross. Subjects were asked to fixate throughout the entire trial. In active-tracking trials, white squares appeared briefly (2 sec) around each of the two to five target balls that the subject was asked to track; on passive-viewing trials, the balls simply remained motionless for this 2-sec period. After this cue period, the balls started moving ( 28/sec) in random directions about the screen. When a ball approached another ball or the edge of the screen, it would change direction to avoid collision or overlap. After 14 sec, the balls stopped moving and a single ball, chosen at random with equal likelihood to have been a target or nontarget, was highlighted for 1 sec. Subjects pressed a button with one hand if the ball was among those that they were tracking, and otherwise pressed a button with the opposite hand. Subjects’ responses therefore provided an objective measure of tracking performance, with 50% being chance. In the fMRI sessions, subjects were scanned during eight 320-sec blocks, each of which 1056
Journal of Cognitive Neuroscience
consisted of eight ball motion trials (20 sec each) interleaved with eight fixation-cross intervals (20 sec each), in which subjects viewed a central fixation cross on an otherwise blank screen. The ball motion trials required either active tracking of two, three, four, or five balls, or passive viewing. Eye Tracking Subjects were trained outside of the MRI scanner until they were able to accurately (>90%) track two, three, four, or five balls. Once subjects reached this criterion, a close-up video recording was made of their right eye in order to measure the accuracy of fixation while they performed both the active-tracking and passive-viewing tasks. For each subject, 320 sec of video were recorded while the subject performed 24 trials (3 trials for each two to five balls, and 12 trials for passive viewing). These videotapes were scored by one of the authors, who was blinded to the ordering of the tasks, for four types of eye movements: blinks, small saccades ( 18), large saccades (>28), and smooth pursuits. Data Acquisition A 1.5-T MRI system (General Electric, SIGNA 5.7, Milwaukee, WI) was used to acquire single-shot spiral T2 *weighted fMRI image volumes covering the whole brain with a standard head coil. The imaging parameters were: repetition time 2500 msec; flip angle 908; echo time 50 msec; slice thickness 4 mm; slice gap 1 mm; in-plane resolution 3.125 3.125 mm. Each experimental condition lasted 320 sec (128 volume scans). The first eight volumes (obtained while the subjects viewed the fixation cross) were discarded to allow for equilibration of T1 saturation effects. A standard T1 -weighted anatomical MRI (0.9 0.9 3.5 mm3 voxel size) was acquired at the beginning of the session. Data Preprocessing Image preprocessing and statistical analysis were carried out using SPM99b (Wellcome Department of Cognitive Neurology, London: http://www.fil.ion.ucl.ac.uk/spm). Image volumes were realigned to the first volume (Friston et al., 1995). Only data with less than 1 mm maximal displacement and less than 18 rotation during an entire scan (320 sec) were considered for further analysis. For each subject, the anatomical MRI was coregistered with the spiral images (Itti, Chang, Mangin, & Darcourt, & Ernst, 1997). The structural image was spatially normalized to a standard template (Talairach & Tournoux, 1988), using a nonlinear transformation, with subsampling to a resultant voxel size of 3 3 3 mm3 . The data were then smoothed using a 10-mm isotropic Gaussian kernel, full width at half maximum. Volume 13, Number 8
Statistical Analysis A parametric statistical model (Buechel, Holmes, et al., 1998) was used to characterize the form of the relationship between the experimental parameter (attentional load; two to five tracked balls) and hemodynamic responses. For each voxel, the form A(t) = a 0 + a 1 L(t) + a 2 L(t)2 + a 3 L(t)3 + + e was used to express the timevarying BOLD signal [A(t)] in terms of a linear combination of basis functions (polynomial with coefficients a 0 , a 1 , a 2 , a 3 , . . .) of the time-varying experimental parameter [L(t)] and a residual error term e after each component has been fitted to the data. Time-varying regressors were created to model the expected brain response for each term in the polynomial expansion of attentional load. The regressors represented the interaction between attentional load and a train of box-car functions modeling the individual experimental trials convolved with a canonical hemodynamic response function. A separate regressor was created to reflect the brain response during the passive-viewing epochs. This enabled us to separate attention from passive-viewing effects. The brain activation during fixation cross was modeled implicitly. For the box-car definition, only the 14 sec corresponding to the ball-tracking period of each trial were considered. This prevented any confounding effects of the slightly different visual cues (i.e., the number of highlighted balls) at the start of each trial. Before regression, high-pass filtering removed low-frequency drifts in the signal, and global changes in activity were removed by proportional scaling. The resultant parameter estimates for each regressor in the polynomial expansion were compared using F tests at each voxel to determine whether significant activation due to each component had occurred. Starting from the zeroorder component, progressively higher-order components were added to the regression until no significant improvements in the overall fit occurred as assessed by F tests. Statistical results are given based on a single-voxel t threshold of 4 (corresponding to p < .001, uncorrected for multiple comparisons) in areas for which we had an a priori hypothesis (visual motion areas, AC). For all other areas, we used a stronger statistical threshold of p < .05, corrected for multiple comparisons across the whole brain volume.
Acknowledgments We wish to thank G. Rees and N. Kanwisher for very helpful discussions and G. Rees and D. Dubowitz for careful reading. This work was supported by funds from the W.M. Keck Foundation Fund for Discovery in Basic Medical Research at Caltech, the National Science Foundation through its Engineering Research Center at Caltech, the National Institute of Mental Health (1R01 MH61427-01), the Howard Hughes Medical Institute, and by the NIDA (Scientist Development Award for Clinicians for L.C., 5 K20 DA00280).
Reprint requests should be sent to Jorge Jovicich, 77 Massachussetts Ave., NE20-464, Department of Brain and Cognitive Sciences, MIT, Cambridge, MA 02139, or via e-mail:
[email protected].
REFERENCES Alais, D., & Blake, R. (1999). Neural strength of visual attention gauged by motion adaptation. Nature Neuroscience, 2, 1015- 1018. Beauchamp, M., Cox, R., & DeYoe, E. (1997). Graded effects of spatial and featural attention on human area MT and associated motion processing areas. Journal of Neurophysiology, 78, 516- 520. Boynton, G. M., Engle, S. A., Glover, G. H., & Heeger, D. J. (1996). Linear systems analysis of functional magnetic resonance imaging in human V1. Journal of Neuroscience, 16, 4207- 4221. Braver, T. S., Cohen, J. D., Nystrom, L. E., Jonides, J., Smith, E. E., & Noll, D. C. (1997). A parametric study of prefrontal cortex involvement in human working memory. Neuroimage, 5, 49- 62. Broadbent, D. (1958). Perception and communication. London: Pergamon. Buechel, C., Josephs, O., Rees, G., Turner, R., Frith, C. D., & Friston, K. J. (1998). The functional anatomy of attention to visual motion: A functional MRI study. Brain, 121, 12811294. Buechel, C., Holmes, P., Rees, G., & Friston, K. J. (1998). Characterizing stimulus- response function using nonlinear regressors in parametric fMRI experiments. Neuroimage, 8, 140- 149. Carpenter, P. A., Just, M. A., Keller, T. A., Eddy, W., & Thulborn, K. (1999). Graded functional activation in the visuospatial system with the amount of task demand. Journal of Cognitive Neuroscience, 11, 9- 24. Carter, C. S., Braver, T. S., Barch, D. M., Botvinick, M. M., Noll, D., Cohen, J. D. (1998). Anterior cingulate cortex, error detection, and the on-line monitoring of performance. Science, 280, 747- 749. Cohen, M. S. (1997). Parametric analysis of fMRI data using linear systems analysis. Neuroimage, 6, 93- 103. Corbetta, M. (1998). Frontoparietal cortical networks for directing attention and the eye to visual locations: Identical, independent, or overlapping neural systems? Proceedings of the National Academy of Sciences, U.S.A., 95, 831- 838. Corbetta, M., Miezin, F. M., Dobmeyer, S., Shulman, G. L., & Petersen, S. E. (1990). Attentional modulation of neural processing of shape, color, and velocity in humans. Science, 248, 1556- 1559. Culham, J. C., Brandt, S. A., Cavanagh, P., Kanwisher, N. G., Dale, A. M., & Tootell, R. B. (1998). Cortical fMRI activation produced by attentive tracking of moving targets. Journal of Neurophysiology, 80, 2657- 2670. Deiber, M. P., Ibanez, V., Sadato, N., & Hallett, M. (1996). Cerebral structures participating in motor preparation in humans: A positron emission tomography study. Journal of Neurophysiology, 75, 233- 47. Deutsch, J. A., & Deutsch, D. (1963). Attention: Some theoretical considerations. Psychological Review, 87, 272- 300. Driver, J., & Mattingley, J. B. (1998). Parietal neglect and visual awareness. Nature Neuroscience, 1, 17- 22. Dupont, P., De Bruyn, B., Vandenberghe, R., Rosier, A. M., Michiels, J., Marchal, G., Mortelmans, L., & Orban, G. A. (1997). The kinetic occipital region in human visual cortex. Cerebral Cortex, 7, 283- 292. Jovicich et al.
1057
Friston, K. J., Ashburner, J., Poline, J. B., Frith, C. D., Heather, J. D., & Frackowiak, R. S. (1995). Spatial registration and normalization of images. Human Brain Mapping, 2, 165189. Friston, K. J., Holmes, A. P., & Worsley, K. J. (1999). How many subjects constitute a study? Neuroimage, 10, 1- 5. Gandhi, S. P., Heeger, D. J., & Boynton, G. M. (1999). Spatial attention affects brain activity in human primary visual cortex. Proceedings of the National Academy of Sciences, U.S.A., 96, 3314- 3319. Horwitz, B., Deiber, M. P., Ibanez, V., Sadato, N., & Hallett, M. (2000). Correlations between reaction time and cerebral blood flow during motor preparation. Neuroimage, 12, 434441. Houk, J. C., & Wise, S. P. (1995). Distributed modular architectures linking basal ganglia, cerebellum, and cerebral cortex: Their role in planning and controlling action. Cerebral Cortex, 5, 95- 110. Itti, L., Chang, L., Mangin, J. F., Darcourt, J., & Ernst, T. (1997). Robust multimodality registration for brain mapping. Human Brain Mapping, 5, 3- 17. Kanwisher, N., & Wojciulik, E. (2000). Visual attention: Insights from brain imaging. Nature Reviews Neuroscience, 1, 91100. Lavie, N. (1995). Perceptual load as a necessary condition for selective attention. Journal of Experimental Psychology: Human Perception and Performance, 21, 451- 468. O’Craven, K. M., Rosen, B. R., Kwong, K. K., Treisman, A., & Savoy, R. L. (1997). Voluntary attention modulates fMRI activity in human MT-MST. Neuron, 18, 591- 598. Paus, T. (1996). Location and function of the human frontal eye-field: A selective review. Neuropsychologia, 34, 475- 483. Posner, M. I., Walker, J. A., Friedrich, F. J., & Rafal, R. D. (1984). Effects of parietal lobe injury on covert orienting of visual attention. Journal of Neuroscience, 4, 1863- 1874. Pylyshyn, Z. W., & Storm, R. W. (1988). Tracking multiple independent targets: Evidence for a parallel tracking mechanism. Spatial Vision, 3, 179- 197. Rees, G., Frith, C. D., & Lavie, N. (1997). Modulating irrelevant motion perception by varying attentional load in an unrelated task. Science, 278, 1616- 1618.
1058
Journal of Cognitive Neuroscience
Rees, G., Friston, K., & Koch, C. (2000). A direct quantitative relationship between the functional properties of human and macaque V5. Nature Neuroscience, 3, 716- 723. Rizzolatti, G., Riggio, L., Dascola, I., & Umilta, C. (1987). Reorienting attention across the horizontal and vertical meridians: Evidence in favor of a premotor theory of attention. Neuropsychologia, 25, 31- 40. Schall, J. D. (1997). Visuomotor areas of the frontal lobe. In K. Rockland, A. Peters, & J. Kaas (Eds.), Cerebral Cortex, (vol. 12, pp. 527- 638). Sunaert, S., Van Hecke, P., Marchal, G., & Orban, G. A. (1999). Motion-responsive regions of the human brain. Experimental Brain Research, 127, 355- 370. Sunaert, S., Hecke, P.V., Marchal, G., & Orban, G. A. (2000). Attention to speed of motion, speed discrimination, and task difficulty: An fMRI study. Neuroimage, 11, 612- 623. Talairach, J., & Tournoux, P. (1988). Co-planar stereotaxic atlas of the human brain. New York: Thieme. Tootell, R. B., Reppas, J. B., Kwong, K. K., Malach, R., Born, R. T., Brady, T. J., Rosen, B. R., & Belliveau, J. W. (1995). Functional analysis of human MT and related visual cortical areas using magnetic resonance imaging. Journal of Neuroscience, 15, 3215- 3230. Treisman, A. M. (1969). Strategies and models of selective attention. Psychological Review, 76, 282- 299. Van Oostende, S., Sunaert, S., Van Hecke, P., Marchal, G., & Orban, G. A. (1997). The kinetic occipital (KO) region in man: An fMRI study. Cerebral Cortex, 7, 690- 701. Watson, J. D., Myers, R., Frackowiak, R. S., Hajnal, J. V., Woods, R. P., Mazziotta, J. C., Shipp, S., & Zeki, S. (1993). Area V5 of the human brain: Evidence from a combined study using positron emission tomography and magnetic resonance imaging. Cerebral Cortex, 3, 79- 94. Wise, S. P. (1985). The primate premotor cortex: Past, present, and preparatory. Annual Reviews in Neuroscience, 8, 1- 19. Wojciulik, E., & Kanwisher, N. (1999). The generality of parietal involvement in visual attention. Neuron, 23, 747- 764. Wojciulik, E., Kanwisher, N., & Driver, J. (1998). Covert visual attention modulates face-specific activity in the human fusiform gyrus: fMRI study. Journal of Neurophysiology, 79, 1574- 1578.
Volume 13, Number 8