Caches As Filters: A New Approach To Cache Analysis Dee A. B. Weikle†, Sally A. McKee‡, Wm.A. Wulf† †
Dept. of Computer Science University of Virginia Charlottesville, VA 22903 {daw4q @virginia.edu |
[email protected]} Abstract
‡Dept.
of Computer Science and Engineering Oregon Graduate Institute of Science and Tech. Portland, OR 97921
[email protected]
As the processor-memory performance gap continues to grow, so does the need for effective tools and metrics to guide the design of efficient memory hierarchies to bridge that gap. Aggregate statistics of cache performance can be useful for comparison, but they give us little insight into how to improve the design of a particular component. We propose a different approach to cache analysis — viewing caches as filters — and present two new metrics for analyzing cache behavior: instantaneous hit rate and instantaneous locality. We demonstrate how these measures can give us insight into the reference pattern of an executing program, and show an application of these measures in analyzing the effectiveness of the second level cache of a particular memory hierarchy.
miss once every (k+1) references in both cases, but the sequences of memory requests coming out of the cache are quite different. For the direct-mapped cache this sequence is [ 0, N ]∗ , but for the fully-associative cache it is [ 1, 2, … , ( N – 1 ) ] ∗ . In the past, this difference was not especially important: the primary goal was to minimize the number of cache misses. In modern systems that employ multiple levels of cache, however, the difference might be crucial. By influencing the nature of the request string coming from lower level caches, we may be able to influence the effectiveness of higher level caches. In the example above, a relatively small but fully-associative L2 cache (i.e., a victim cache [1]) would be effective backing an L1 cache with conflicts on only two locations, whereas it might take a much larger cache to compensate for an L1 that distributes its evictions over more memory locations.
1. Introduction
2. Caches as filters
The growing disparity between the speeds of microprocessors and DRAM memory makes it imperative to use effective caches or other structures between them. The traditional measures of the quality of a caching strategy have been the aggregate miss rate, or fraction of accesses that cannot be serviced by the cache, and the execution time of a benchmark. We argue that other metrics — specifically ones that focus on characteristics of the reference string — provide greater insight and guidance in the design of multi-level cache systems. Our approach is motivated by a simple observation: two caches with precisely the same miss rate (or execution time) may achieve that performance in quite different ways. For example, consider two caches of size N — a direct-mapped cache and a fully-associative cache with LRU replacement. Consider the (admittedly contrived) reference string:
The goal of this research is to gain insight into the design of multi-level cache systems. In a sense, designing memory hierarchies is akin to designing a compound optical lens: no single lens has all the desired properties, but by cascading several lenses, optical designers can achieve amazing acuity. Likewise, we can view a cache as a filter that converts an input sequence of data references into an output sequence representing a subset of its input. By composing a series of such caches, we attempt to filter as many references as possible from the request string before it is presented to main memory. To get the best overall performance, however, the goal of a particular level of cache is not just to filter out the most references, but to condition the reference string so that the next cache level will be most effective. In the following analysis, we describe reference strings as sequences of addresses, 〈 a 0, a 1, a 2, a 3, a 4, …〉 . Note that the subscript denotes the position in the reference string, and is only loosely related to wall-clock time: after several levels of cache we expect the references to be spaced unevenly in real time even though they appear adjacent in the reference string.
k
k
k
k
k
k
[ 0 , 1, N , 2, 0 , 3, N , 4, 0 , …, ( N – 1 ), N ]
∗
where a superscript k denotes a specific number of repetitions and * denotes an indefinite number of repetitions. For this string, the addresses 0 and N will conflict in the direct-mapped cache, but 1 through N-1 will remain in the cache. For a fully-associative scheme, whenever a new item is brought in, the least recently used references will be 1 through N-1, and so these will cycle through the cache. After the caches are primed, there is a
cache filter
Making an analogy to signal analysis, the signal is the reference string transformed by some measure (possibly the identity function) computed on the reference string. Comparing a cache’s input and output signals reveals what kind of filtering effect the cache is having on that input. The signal analysis analogy has appeal, but it only goes so far: tools like Fourier and Laplace transforms don’t immediately apply, because caches-as-filters are not linear. (Being linear requires that an input equal to the sum of two other inputs generates an output equal to the sum of the corresponding two outputs. In terms of a cache, this would require that earlier references not affect the output of later references, which would mean that the cache has no state.) This leads us to the development of new measures specific to our application domain to use as transforms instead.
3. New measures of effectiveness Alternative measures to miss rate (which can also be thought of as alternative transforms to Fourier or Laplace transforms in signal analysis) that we are developing are described below. We do not claim the precise definitions of the measures we have created are the best possible measures. Rather, we choose them for their simplicity and correlation to intuition, to explain the concept of cachesas-filters, and to explore the usefulness of non-aggregate measures to memory hierarchy analysis. To describe properties of reference strings, we define two measures. The first is the instantaneous hit rate, h i . The usual definition of hit rate averages over all references in a string; by contrast, h i is a function measured at each point in the reference string, to emphasize recent behavior. The definition we use is: hi = δi + σ ⋅ hi – 1
where δi and 0 ≤ σ ≤ 1 . This definition exhibits the desirable property of decreasing the contribution of hits and misses according to how far they occurred in the past. Throughout the rest of the paper we choose σ = 1/2, because this measure may be useful at run-time to indicate phases of reference behavior and dividing by two has a fast implementation. Note that with σ = 1/2, hi has a maximum value of 2. This happens because a series of cache hits yields the sequence: 1, 3/2, 7/4, 15/8, ... Each element of this sequence can be represented by the expression below, which has a maximum value of 2. is 0 if the ith reference is a miss and 1 if it is a hit,
n
2 –1 1 -------------- = 2 – -----------n–1 n–1 2 2
Another particularly useful notion is that of locality in the reference string. To give substance to the intuitive notion, we define the instantaneous locality, li, of a reference in a string 〈 a 0, a 1, a 2, …〉 as: i–1
li =
× ------------∑ --------------------------ai – a j + 1 j – i 1
1
j=0
The precise form of this definition is immaterial, but this particular form attempts to follow our intuition: - The first term in the product corresponds to spatial locality; by forming the difference between two
references, the term is larger when the two addresses are closer together. - The second term loosely corresponds to a notion of temporal locality; weighting the spatial components by the difference in subscripts makes the term larger for references that are closer together in the reference string. The product of these terms is largest for references that are close both spatially and temporally. By summing over all previous references, we get a measure that is large when there are many prior references that are spatially and temporally local. As a practical matter, since reference strings can be exceedingly long, we generally do not sum from j = 0 , but rather sum from j = ( i – w ) for some window size w. If w is sufficiently large, the terms for smaller j are irrelevant to our results, and we can safely ignore them: i–1
li ≈
∑
j = i–w
1 1 --------------------------- × ------------ai – a j + 1 j – i
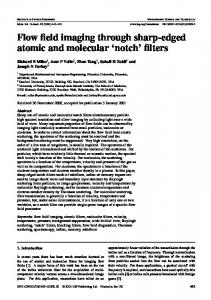
This definition of instantaneous locality has at least two immediate uses. First, it provides an alternative and enlightening figure of merit for caches. The ideal composite of cache filters is one that removes all the locality in the input reference string and produces an output reference string that has zero locality everywhere. (Note that to truly have an output reference string with zero locality everywhere, it would necessarily be the null string or a single reference. Any reference string of two or more references will have some locality.) We believe li is a more informative measure than an aggregate miss ratio. This new figure of merit corresponds closely to our intuition about the quality of a cache. Caches exploit locality to intercept and remove references; thus any locality left in the output string signals a failure of the cache (or that the corresponding misses are compulsory), although it is the existence of this locality that gives us hope that another level of cache can be effective. Alternatively, if there is no locality in the input to start with, a high miss ratio is not a sign of cache failure. The second immediate use of this locality measure is also a use of the instantaneous hit rate. They give us insight into the underlying patterns of the reference string and the effect of a cache on that string. For example, they reveal that locality is “bursty” — real reference streams tend to have regions of high locality separated by regions of relatively low locality. [2, 3,4] Even after a reference string is filtered by a cache, we may still see regions of relatively high locality. These observations are demonstrated in the example output of Figure 1. The top graph is of the locality of the input reference string. The middle graph is of the instantaneous hit rate as determined by an 8K, directmapped, 1-byte line size cache, and the bottom graph is of the instantaneous locality of the reference string output from this same cache. The experiments described throughout this paper have the following characteristics unless noted otherwise: 1) both instructions and data references are included; 2) each dot and hash mark graphed represents one reference in the original string;
b) instantaneous hit-rate
a) input locality
Trace: traces/sparc/dc1bkenS.00000
Output: printouts/Stake/fig2.ps Starting X: 222286 Date: Wed Jun 12 15:08:37 1996 Version: 0.85
VPD: 1
1.59e+00
7.94e−01
222286 Hit Rate (traces/sparc/dc1bkenS.00000)
222421 Event Time
222555
222421 Event Time
222555
222421 Event Time
222555
2.00e+00
1.00e+00
222286 Locality Out (traces/sparc/dc1bkenS.00000)
c) output locality
Y zoom: 90.9419576333%
Locality In (traces/sparc/kenS.00000)
1.59e+00
7.95e−01
222286
Figure 1 Example Measure Output from MACE System
3) the window, w, of previous references in li is 100; and 4) the value of σ in hi is 0.5. Notice how ‘bursty” all three graphs are. This burstiness indicates that there are periods during which a cache can be very effective in eliminating references, but other periods in which it is not at all effective, resulting in bursts of misses to main memory. The extent of the burstiness is important because it affects how well memory latencies can be tolerated. Specifically, the closer together references to main memory are in real-time, the harder it is to minimize the memory latency seen by the processor. The filtering effect of the cache is also visible in Figure 1. Notice how the spikes in the input locality graph, (a), are filtered out in the output locality graph, (c). Finally, these new measures allow us to identify and analyze regions of higher locality to examine the fine structure of their references. An example of this is included in Section 5.3. As mentioned above, we do not claim that the precise definitions we use for hi and li are the best possible measures and we have not run exhaustive experiments on the effect of each parameter on each measure under consideration. Experiments to date have focussed on the qualitative aspects of these measures and their ability to provide more insight into the nature of reference patterns. Experiments to determine the precise effect of the parameters and relating the measures to execution time are one aspect of future work.
4. A tool for observing new measures Unlike the traditional cache measures of hit or miss rates, our new measures have values for each point in the
reference string. These measures are more difficult to represent, thus it is important to have a toolset to both compute the measures and to allow them to be viewed in a way that contributes to our understanding of the reference string and cache behavior. To this end we have designed and prototyped the MACE (Memory ACess Evaluation) system. generic address trace
format filter
memory component filter
formatted trace
formatted and annotated trace
view characteristic: locality hit rate time since last access code vs. data supervisor vs. user zoom compare with other trace view part of reference string pattern match
00010100 00110011 00101101
Figure 2 MACE System Diagram
The structure of the system is shown in Figure 2. MACE takes as input trace files of memory references,
5. Preliminary results 5.1 A motivating example Applying these new measures to the example in Section 1 yields the results in Figure 3 and Figure 4. Recall the example input reference string: k
k
k
k
k
k
[ 0 , 1, N , 2, 0 , 3, N , 4, 0 , …, ( N – 1 ), N ]
∗
In these experiments, k is 1 and N is 8192, and the cache line size equals the size of each datum. Figure 3(a) shows the instantaneous locality after the above expression has been run through once, and the caches are primed. The output locality of the direct-mapped cache shown in Figure 3(b) exhibits a steady-state instantaneous locality close to 2, once the cache is primed. Figure 3(c) and 3(d) display the instantaneous locality of a fully-associative cache. Random replacement yields more hits and a very different output pattern, shown in Figure 3(c). The line from the last locality point visible in Figure 3(c) connects it to the one for the next reference. Since the next miss coming out of the cache happens far in the future, it does not appear on this graph. This separation occurs because references retain their positions from the original input trace in this analysis mode. With LRU replacement, the reference string from the primed fully-associative cache would repeat [ 1, 2, 3, 4, …, ( N – 1 ) ]∗ , and the graph of its instantaneous locality would resemble the picture in Figure 3(d), leveling off at a value close to 1, and dipping slightly when the pattern begins again. (Note that Figure 3(d) is an example of what this locality graph would look
a) input locality for b) direct-mapped output locality c) random associative output locality d) “lru” associative output locality
puts the references in a common format, and enables the user to analyze the traces by running them through cache filters and observing the locality of the reference strings before and after each cache. At this time, MACE is not available for distribution. These results were generated with an initial version that allowed us to develop features of the interface quickly. The user interface is implemented in TkInter/TCL and the tools, such as the cache filters, are implemented in C. It all runs under the Solaris 2.5.1 operating system. This version is easy to modify, but slow for interactive execution. A second version, implemented in JAVA and C++, is under development. All indications are that this version will be useful as an interactive tool. Sample output of the two-dimensional graphing function is shown in Figure 1. Three graphs are included as described in Section 3. The user can zoom in on regions of interest to inspect the underlying form of the reference pattern, or zoom out to see more global effects. (See Section 5.4 for a “zoomed out” example.) In each graph, the y-axis corresponds to the unitless instantaneous locality value or hit rate as appropriate. The x-axis can be configured to use the position in the original or top trace to compare graphs from before and after a cache filter, or can refer to the position within the reference string under analysis to compare different, perhaps unrelated, reference strings. In graphs that use the position in the original trace as an x-axis, the references that hit in the cache are denoted by small hash marks just above the x axis in the output locality graph. Graphs, such as this one, that are completely “zoomed in” display one locality value or hash mark for each address in the reference string used as the xaxis.
1.8
0.9
position in original trace
2.2
1.1
position in original trace
2.2
1.1
position in original trace
2.2
1.1
position in original trace
Figure 3 Instantaneous Locality in Steady-State
like, but not an actual simulation. This explains the x-axis discrepancy.) The fact that the direct-mapped cache produces higher li values indicates that there is more locality left in the output string, and hence another level of cache would be more effective here than it would be backing the fullyassociative cache. It also means that the direct-mapped cache is not as effective at exploiting the locality in its input string, and perhaps a stand-alone direct-mapped organization is not the best design choice for this level of the hierarchy with this reference string. A direct-mapped cache backed by a small victim cache, however, might be more effective than one or more levels of associative cache. Figure 4 graphs the instantaneous hit rate after the caches are primed, with the input from Figure 3(a). Unlike an aggregate measure, the instantaneous hit rate shows for what part of the trace the cache is performing well, and for what part it is not. Further attention can then be given to the problem regions. For example, looking at the instantaneous locality for a region of poor performance can determine if the input string has any significant amount of locality for the cache to use. Looking at the trace itself in that region will identify the reference pattern that exhibits the problem.
2.0
1.0
position in original trace
2.0
1.0
for i = 1 to 10000 y[i] = y[i] + a * x[i] for i = 1 to 10 for k = 1 to 10 reg = x[i][k] for j = 1 to 10 z[i][j] += reg * y[k][j]
Figure 5 Pseudocode for Program Constructs
Figure 7 shows the locality graphs at start-up for the data portion of the daxpy trace. It’s easy to see the pattern in the input of Figure 7(a): the first three references, to a, x[1], and y[1], have relatively little locality, but the
a) input locality
.47
position in original trace .32
b) output locality
To get a better feel for what the instantaneous locality measures can tell us, we used a trace-description language [5] to describe a simple loop accessing multiple data streams (daxpy) and a loop nest accessing twodimensional arrays (matmul). Figure 5 shows pseudocode for these program fragments. We ran these constructs through an interpreter to generate synthetic traces, which we analyzed with MACE. Figure 6 through Figure 11 show the locality measures for our 8K example caches. In the discussion that follows, three categories of program constructs are identified. One is a stream, or vector-like access. The other two are code loops; one single loop and one doubly-nested loop. Figure 6 shows input and output locality from start-up for the code portion of a 10,000-element daxpy computation. Each loop iteration is easily discerned in the input locality pattern in Figure 6(a): each single loop forms a hump in the locality graph. Once the loop is loaded, all references hit in the instruction cache, thus all of the locality from the input in Figure 6(a) is filtered out in the output in Figure 6(b). This output was generated with a direct-mapped cache, but because this loop fits in cache, results for both replacement policies are nearly identical (e.g., see the combined reference string output of both caches in Figure 8).
.16
position in original trace
Figure 6 Instantaneous Locality for daxpy Instructions 1.0
a) input locality
5.2 Recognizing program constructs
matmul
.94
position in original trace
Figure 4 Instantaneous Hit Rate in Steady-State
daxpy
instantaneous locality value shoots up at the second reference to y[1]. The rising curve defined by every fourth dot represents the repeated references to scalar a. In the direct-mapped cache output of Figure 7(b), the locality from the repeated references to a and y[i] are filtered out (the repeated sets of two ticks just above the x axis indicate where these cache hits occurred). Since the data set does not fit in an 8K cache, the patterns at the right end of the locality graphs in Figure 7 will repeat throughout the computation for both the direct-mapped and associative data caches. Notice how in both parts of Figure 7 the locality values representing sequential references to any particular vector ramp up to a point and then become a straight line. This ramping up to a straight line is the basic pattern behind every stream. The actual value the line approaches is dependent on the stride of the stream and the separation between individual references to that stream.
0.5
position in original trace 1.0
b) output locality
b) instantaneous hit rate, associative
a) instantaneous hit rate, direct-mapped
.
0.5
position in original trace
Figure 7 Instantaneous Locality for daxpy Data
Figure 8 shows what happens with daxpy for a combined instruction and data cache, either direct-mapped or 4-way set associative. The loop iterations are still evident in the repeated patterns in the input of Figure 8(a). It is also possible to see the stream patterns from Figure 7(a). The output locality in Figure 8(c) and Figure 8(d) resembles the output locality of Figure 7(b) spread out in time. In all these traces, each new reference
.32
a) input locality at start-up
.45
.22
position in original trace
b) hit rate at start-up
2.0
1.0
position in original trace .45
.22
position in original trace .45
position in original trace
b) instantaneous hit rate
2.0
d) input locality after j-loop
a) input locality
.64
associative cache. Once the loops are loaded, the computation runs entirely out of the cache. Since there are no cache misses until all 10 iterations of the j-loop have finished, there is no locality left in the output of Figure 9(c).
c) output locality at start-up
to x and y misses the cache, but all other instruction and data references hit. The instantaneous hit rate in Figure 8(b) demonstrates this graphically: the value of hi drops at precisely two points during each loop iteration. The replacement policy never comes into play. Figure 9 through Figure 11 illustrate results for matrix multiply on 10x10 matrices. We chose the small problem size to make patterns in the resulting graphs more readily apparent. The code description for this computation was modeled after the assembly language output of gcc on an HP PA-RISC. There are 36 static instructions in the j-loop, 27 more in the k-loop, 5 more in the surrounding i-loop, and 5 in the prologue. The nested loops give rise to a more complex locality pattern than the simple daxpy loop, as evidenced by the graph in Figure 9(a). The prologue and the first iteration of each loop generate roughly the first inch of the input locality graph in Figure 9(a); the instruction addresses for this segment are sequential, so input locality rises steadily as for a stream. The numerical value of any locality point is much less important than the patterns the points create. The larger dips signal the backward branch at the end of the jloop. The entire segment depicts 3+ iterations of the innermost loop, or roughly 140 total instructions.
e) hit rate after j-loop
position in original trace
.54
c) output locality direct mapped
position in original trace 2.0
1.0
1.0
position in original trace
position in original trace
.54
f) output locality after j-loop
.45
.27
d) output locality 4-way associative
.22
.22
position in original trace
Figure 9 Results for matmul Instruction Trace
.27
position in original trace
Figure 8 Results for daxpy Combined Trace
Figure 9(b) shows the instantaneous hit rate, which is the same for both the direct-mapped and the 4-way set
Figure 9(d)-Figure 9(f) show the locality and hit rate graphs at the end of the first iteration of the k-loop. The dip in input locality in Figure 9(d) at the same place that the instantaneous hit rate drops in Figure 9(e) marks the execution of the remaining instructions in the intermediate loop (and the corresponding cache misses), then the pattern for the inner loop picks up again in the right half of Figure 9(d). Notice the pattern of the doubly nested loop apparent in the combination of Figure 9(a) and (d).
b) hit rate at start-up
a) input locality at start-up
2.8
1.3
position in trace 2.0 1.0
c) output locality at start-up
position in trace 2.8
1.3
position in trace
Figure 10 Results for matmul Data Trace
Smaller dips indicate the backward branch in the inner loop and the less frequent large dip in (d) corresponds to the backward branch of the outer loop. By this point, all instructions for all three loops are resident in cache, and there are no more instruction misses in the entire trace. This can be seen in the lack of output locality in Figure 9(f) and in the absence of a line connecting the locality point for the last k-loop cache miss to another on its right. a) input locality after j-loop
.56
.28
position in original trace
c) output locality after j-loop
b) hit rate after j-loop
2.0
1.0
position in original trace .56
.28
position in original trace
Figure 11 Results for matmul Combined Trace
Figure 10 illustrates data locality at the beginning of the matmul trace. The peaks in the input locality graph represent references to automatic or temporary variables on the stack in between references to arrays y and z. We can see one iteration of the k-loop ending where the
locality pattern in Figure 10(a) dips slightly when we load the next element of x. The locality output in Figure 10(c) shows that stack references and repeated accesses to z are filtered out by the cache. Recall that we modeled a cache with very short lines; one with longer lines could take more advantage of spatial locality among the array references Figure 11 shows the combined code and data string as the k-loop completes its first iteration. The hit rate in Figure 11(b) drops as the cache services the compulsory instruction misses we saw in Figure 9(e). The locality output in Figure 11(c) reflects the drop in hit rate during this transition from inner loop to intermediate loop. In this section, we have taken two program fragments, and have decomposed the full reference traces coming from the CPU, separating the strings into individual “signals” representing code and data. In applying our locality measures to the individual and merged strings, we have observed that one can discern the contributions of individual scalars or data strings in the locality graphs, as for the scalar variable a in daxpy, the stack references in matmul, or the vector accesses in both benchmark fragments. In addition, loops are also clearly visible as “hump” patterns. This suggests that other decompositions of a reference string into its component signals will also prove enlightening. Exploring these decompositions is part of our plan for future work.
5.3 Introducing more realistic reference strings The examples above illustrate some of the uses we envision for these new measures. It is also interesting to see how these measures apply to real program references. For the first set of experiments, we chose to use the BACH traces from Brigham Young University [6, 7, 8]. These traces exhibit minimal space and time dilation effects, are available for more than one processor, and are easy to obtain (see http://pel.cs.byu.edu/). The results described below are preliminary, and have all been run on the first 450,000 references of a trace generated with the 061.kenbus1 benchmark from the SPEC SDM suite (see http://www.spec.org/osg/sdm91/). This workload consists of UNIX shell scripts that exercise the operating system as well as the CPU and I/O components of a system. It was collected on a SPARC 1+ with 40 MB of memory running SunOS, and because of the external MMU of the SPARC chip set, all addresses are virtual. This particular trace simulates 20 users, includes operating system references, and tracing began 120 seconds into the benchmark. We chose the first section of this trace because it was easily available via ftp, and because the specifics of the trace did not seem crucial for our initial explorations. One of our first observations is that the locality of realistic reference streams is “bursty” in nature. Sometimes the locality is high, reflecting references that are close in space and time, and then the locality will suddenly drop and stay low for some period. This is evident in the input locality shown in Figure 12. In addition, these bursts often occur in patterns that are repeated in the trace. Our results from Section 5.2 and our examinations of the addresses in the trace indicate that this
a) input locality
position in original trace
b) output locality from 8K direct-mapped cache
position in original trace
Figure 12 Locality for 061.kenbus1 Trace
pattern recurrence results from repeated loops that generate very similar reference streams. Indeed, we believe loops to be responsible for most of the high locality areas in the output. This makes intuitive sense, and we have examined many portions of the trace to test this hypothesis. For example, Figure 13 shows the reference addresses corresponding to the marked section of the locality graph in Figure 12(a). trace position
instruction address
iteration label
222995 222996 222997 222998 222999 223000 223001 223002 223003 223004 223005 223006 223007 223008 223009 223010 223011 223012 223013 223014 223015 223016 223017 223018 223019 223020 223021 223022 223023 223024
0x04d64 0x04d68
1
0x04d6c 0x04d70 0x04d74 0x04d78 0x04d7c 0x04d80 0x04d64 0x04d68 0x04d6c 0x04d70 0x04d74 0x04d78 0x04d7c 0x04d80 0x04d64 0x04d68 0x04d6c 0x04d70 0x04d74 0x04d78 0x04d7c 0x04d80
data address
data label
0x193b7
A
0x1aa4d
B
0x193b8
A
0x1aa4a
B
0x193b9
A
0x1aa5d
B
1
1 2
2
2 3
3
3
Figure 13 Detail of 061.kenbus1 Input Trace Section
The boxed references in Figure 13 represent repeated addresses that correspond to instructions in the loop. Instructions are labeled according to their iteration number
within this window on the trace. The remaining items are clustered data references: addresses near each other are labeled with the same letter. The address sequence continues like this for several more iterations.
5.4 A practical application It is not yet clear how to use this approach to determine what kind of cache to build at a particular level of the memory hierarchy for a class of traces exhibiting given qualities, although it is our hope that this work will eventually lead to tools that will help us do just that. In the meantime, we can use these tools to determine what kind of cache won’t work well in a given situation. Consider a cache hierarchy similar to one of the Intel Pentium Pro chip sets [9], with L1 instruction and data caches that are both of size 8K with 32-byte lines. The L1 data cache is 2-way set associative, and the instruction cache is 4-way set associative. The L2 cache is combined, 256K, 4-way set associative with 32-byte lines. We compared this L2 with two other combined, 256K caches, both direct-mapped, but the first has 32-byte lines, and the second has 128-byte lines. Our experiments used random replacement, which differs from the LRU and pseudoLRU policies of the Pentium Pro, but this difference in policies does not materially affect our conclusions When we analyzed the 061.kenbus1 trace for these hierarchies, we found that the direct-mapped L2 with 128byte lines performs much better than the L2 caches with 32-byte lines, both of which performed very similarly. Figure 14 shows input and output localities for a section of the trace. It is evident that the associative L2 cache with 32-byte lines fails to capture much of the available locality in the reference string: the locality output graph in Figure 14(c) is almost identical to the locality input graph in Figure 14(a). In contrast, there is relatively little locality left in Figure 14(e) for the direct-mapped L2 with 128byte lines. This example is intended to be illustrative, not definitive. We recognize that such a small input sample provides insufficient data on which to base architectural
design decisions. Furthermore, our input trace was generated on a processor very different from the one whose memory hierarchy we modeled, and we did not model all details of that hierarchy exactly. a) input locality
1.0
0.5
We cannot draw conclusions about the L2 replacement policies, since 450,000 references is not enough to observe performance differences between direct-mapped and setassociative L2 caches of this size. Nonetheless, we expect that making the L1 and L2 replacement algorithms different will also yield better performance. Future work will test this hypothesis for a range of replacement policies.
6. On locality measures
b) hit rate 4-way, random 32-byte lines
53900
2.0
1.0
c) output locality 4-way, random 32-byte lines
53900
position in original trace
1.0
0.5
position in original trace
2.0
α q i = ----------------------------------- + ( 1 – α ) ⋅ q i – 1 where i > 0 , α ≤ 1 Ai – 1 – ai + 1
Where the historical address, A i , is: A0 = a0
1.0
53900
A i = βa i + ( 1 – β ) ⋅ A i – 1 where i > 0 , β ≤ 1
position in original trace
1.0
e) output locality direct mapped 128-byte lines
Our initial locality measures have proved useful in preliminary investigations, but there are several ways in which they might be improved (or changed to illustrate other properties of memory system behavior). We describe some potential differences here, but presenting results for these is beyond the scope of this paper. To reduce the amount of computation time and state required for each memory reference, we have developed a simpler measure that has similar analytical characteristics to the instantaneous locality measure described in Section 2. This measure introduces the concept of an historical address that attempts to summarize information about all previous addresses in the string. It does this by applying an exponentially smoothed weighting factor, β, to each address. Assuming a reference string 〈 a 0, a 1, a 2, a 3, a 4, …〉 , this “quick” instantaneous locality measure, qi, is defined as: q0 = 0
53900
d) hit rate direct mapped 128-byte lines
position in original trace
0.5
53900
position in original trace
Figure 14 Comparison of Two L2 Configurations
Based on our analyses, our intuition is that the cache at level N+1 should be designed with a different organization and/or replacement policy from the cache at level N, otherwise both caches are likely to miss on the same kinds of inputs. For instance, our results suggest that longer lines are preferable in an L2 cache backing L1 caches similar to the Pentium Pro’s. Comparing aggregate hit-rates should indicate that other L2 configurations may perform better than the implementation with 32-byte lines, but would not be as useful in explaining why.
This measure is sensitive to the values of weighting factors α and β, so care must be taken in choosing them, but preliminary investigations show that this formula produces similar curves to those presented in Section 5. Other formulas for the spatial locality component may be more useful than the difference in bytes between two addresses. We are investigating measures that use a step function to incorporate the notion of cache line sizes or bus fetch sizes, so that items that are equally “close” in terms of the memory system organization will have the same spatial locality value. Similarly, for memory components that perform automatic prefetching, the spatial locality component could reflect the prefetch distance, since items that lie within the prefetch distance are “closer” than those beyond this distance. In the temporal component of a locality measure for cache hierarchies, it may make more sense to use the number of unique addresses between two references (the LRU distance), instead of the total number of addresses. Another potentially interesting variant entails incorporating optimal replacement (the OPT distance, or the number of unique addresses between the current reference and the next reference to it in the future) into the temporal locality component.
Another measure we are considering in conjunction with locality measures, is an entropy measure to determine the predictability of a reference string.
7. Related work The traditional measures of the quality of a caching strategy have been aggregates such as the miss rate. Other measures break down summary performance data spatially or according to bandwidth requirements. For instance, Tyson et al. perform a detailed characterization of cache behavior for individual load instructions [10], and Abraham et al. study the memory referencing behavior of individual machine-level instructions [11]. Both studies confirm that a very small number of load and store instructions account for a majority of data cache misses. Evidence that misses are bursty in both time and space are available in Thiebaut’s work regarding the fractal dimensions of computer programs and the work of Voldman and Hoevel regarding software-cache interactions. [12, 13] Johnson et al. measure spatial reuse fractions for cache lines, finding that over half the time data fetched in a cache with a uniform, large line size wastes bus bandwidth and cache space [14]. Huang and Shen measure the average bandwidth requirements of a program as a function of available local memory [15], and Burger et al. calculate traffic ratios, traffic inefficiencies, and effective pin bandwidths for different levels of the memory hierarchy, arguing that pin bandwidth will be a severe performance bottleneck for future microprocessors [16]. New approaches to characterizing program locality make it possible to represent and discuss locality and caching properties in concrete terms. Brehob and Enbody propose a mathematical model of locality that uses the distance between references in a trace to capture temporal locality, and a correspondence to cache lines to capture spatial locality [17]. Grimsrud et al. introduce a method of quantifying the locality in a trace and visually representing it as a three dimensional surface [18]. They explore some of the properties of this formulation, and show the correlation between graphical features and specific reference patterns, demonstrating the utility of their locality measure through two applications as a visualization tool: characterizing and summarizing workload locality, and evaluating the effectiveness of benchmarks in exercising memory hierarchies. Although these kinds of summary data provide some insight into characteristics of the benchmark being analyzed, they do not provide details about cache behavior during specific phases of the program’s execution or how cache behavior changes over time. McKinley and Temam take a step towards more detailed analysis by quantifying the locality characteristics of numerical loop nests [19]; their locality measurements reveal important differences between loop nests and whole programs, and refute some popular assertions, but like Brehob and Enbody’s, their approach presents results as histograms of the locality distributions for the parts of programs in question. In contrast, our approach aims to provide much more than summary information.
8. Conclusions We have introduced the concept of viewing caches as filters, and have presented the results of and observations on some initial experiments with this new approach to memory hierarchy performance analysis. Even though this work is preliminary, we have demonstrated that the instantaneous hit rate and the instantaneous locality measures can give us more insight into memory referencing behavior than the traditional aggregate hit rate, and we have shown a practical application of these measures in analyzing the effectiveness of a particular memory hierarchy. Future work will expand these results by: - running more experiments on longer traces; - developing new measures of locality and cache efficiency; - applying our measures to the design of multi-level cache/memory hierarchies; - using our measures to characterize workloads and to evaluate their effectiveness with respect to exercising memory hierarchies; - defining the mathematical properties required in a locality measure; - integrating our analysis tools with the SimpleScalar toolset from the University of Wisconsin [20], so that we can work with execution-driven simulation and reference streams generated by both in-order and outof-order processors; and - evaluating the application of digital signal analysis techniques to cache analysis in general. Acknowledgments Alan Batson, Mark Brehob, Mike Haertel, Mike Nahas, Craig Williams and Nick Wade all provided insightful comments on this work. Robert Bingler wrote much of the initial implementation of the MACE toolset. We are also grateful to the MASCOT reviewers for their suggestions. References [1] N. P. Jouppi, “Improving direct-mapped cache performance by the addition of a small fully-associative cache and prefetch buffers,” Proceedings of the 17th Annual International Symposium on Computer Architecture, May, 1990. [2] A.P. Batson and A.W. Madison, “Measurements of Major Locality Phases In Symbolic Reference Strings”, Proc. International Symposium on Computer Performance, Modeling, Measurement and Evaluation, March 1976. [3] A.P. Batson, D.W.E. Blatt, and J.P. Kearns, “Structure Within Locality Intervals”, Proc. Third International Symposium on Modeling and Performance Evaluation of Computer Systems, 1977. [4] A.W. Madison and A.P. Batson, “Characteristics of Program Localities”, CACM, May 1976, 19:5, pp. 285-294. [5] S.A. McKee, Wm.A. Wulf, D.A.B. Weikle, “TSpec: A Specification Language for Reference Traces”, Univ. of Virginia Dept. of Computer Science Technical Report CS-9719, August 1997. [6] J. Flanagan, B. Nelson, J. Archibald, K. Grimsrud, “BACH: BYU Address Collection Hardware; The Collection of Complete Traces”, Proc. 6th International Conference on
Modeling Techniques and Tools for Computer Performance Evaluation, September 1992. [7] J. Flanagan, B. Nelson, J. Archibald, K. Grimsrud, “Incomplete Trace Data and Trace-Driven Simulation: A Case Study”, Proc. of International Workshop on Modeling, Analysis, and Simulation of Computer and Telecommunication Systems, January 1993. [8] K. Grimsrud, J. Archibald, M. Ripley, K. Flanagan, and B. Nelson, “BACH: A Hardware Monitor for Tracing Microprocessor-Based Systems”, TR-G150-92.1, Dept. of Electrical and Computer Engineering, Brigham Young Univ., October 1992. [9] D. Bhandarkar and J. Ding, “Performance Characterization of the Pentium Pro Processor”, Proc. HPCA-3, San Antonio, TX, February 1997. [10] G. Tyson, M. Farrens, J. Matthews, and A. Pleszkun, “A Modified Approach to Data Cache Management”, MICRO-28, December, 1995. [11] S.G. Abraham, R.A. Sugumar, D. Windheiser, B.R. Rau, and R. Gupta, “Predictability of Load/Store Instruction Latencies”, Proc. MICRO-26, December 1993. [12] D. Thiebaut, “On the Fractal Dimension of Computer Programs and its Application to the Prediction of the Cache Miss Ratio”, IEEE Transactions on Computers, Vol. 38, No. 7, July 1989. [13] J. Voldman and L. W. Hoevel, “The software-cache interaction”, IBM Journal of Research and Development, Vol. 25, November 1981. [14] T.L. Johnson, M.C. Merten, and W. Hwu, “Run-time Spatial Locality Detection and Optimization”, Proc. MICRO-30, December 1997. [15] A. S. Huang and J. P. Shen,”The Intrinsic Bandwidth Requirements of Ordinary Programs”, Architectural Support for Programming Languages and Operating Systems VII, October, 1996. [16] D. Burger, J.R. Goodman, A. Kagi, “Quantifying Memory Bandwidth Limitations of Current and Future Microprocessors”, Proc. 23rd ISCA, May 1996. [17] M. Brehob and R. Enbody, “A Mathematical Model of Locality and Caching”, Michigan State Univ. Computer Science Dept. Technical Report, TR-MSU-CPS-96-42, November 1996. [18] K. Grimsrud, J. Archibald, R. Frost, and B. Nelson., “Locality as a Visualization Tool”, IEEE Transactions on Computers, Vol. 45, No. 11, November 1996. [19] K. S. McKinley and O. Temam, “A Quantitative Analysis of Loop Nest Locality”, Architectural Support for Programming Languages and Operating Systems VII, October 1996. [20] D. Burger and T.M. Austin, “Evaluating Future Microprocessors: the SimpleScalar Tool Set”, Univ. of Wisconsin-Madison Computer Science Dept. Technical Report 1342, June 1997.