. In the case of laminar flow, steady state, negligible ...
CANOPY MODELLING WITH A CFD CODE A. R. GRAVDAHLa
G. CRASTOb
S. QUINNc
N. MANDASb
F. CAMBULIb
[email protected]
[email protected]
[email protected]
[email protected]
[email protected]
a) WindSim AS Jarlsø – N-3124 Tønsberg – Norway Tel. +47 33 38 18 00 – Fax +47 33 38 18 08
b)UNIVERSITÀ DEGLI STUDI DI CAGLIARI
http://www.windsim.com
http://supersonica1.unica.it
c) SgurrEnergy Ltd 69 Dixon Rd—Glasgow, G76 7AH—Scotland Tel.+44 141 433 9060—Fax +44 141 423 9276
DIPARTIMENTO DI INGEGNERIA MECCANICA
Piazza d’Armi – 09123 CAGLIARI – ITALY Tel. +39 070 6755951 – Fax +39 070 6755717
http://www.sgurrenergy.com
5. SIMULATIONS WITH WINDSIM, STEP CHANGE IN ROUGHNESS
SUMMARY
Several simulations have been performed for a flat terrain reproducing a smooth to rough change in roughness, the inlet roughness-length is typical of a low vegetation while the second one is typical of a forest. The grid has been refined over the border of the forest with a minimum horizontal resolution of 32,7 m. The boundary conditions set at the inlet were profiles of mean velocity (log-law from the ground to z = 500 m and a constant wind of 10 m/s outside the boundary layer), profiles of turbulent kinetic energy and its dissipation rate. An internal boundary layer develops starting from the edge of the forest (x 2000 m). Vertical profiles of mean velocity are extracted at the position x 7500 m, y 1000 m and then compared with measurements relative to wind tunnel and field experiments from Kaimal and Finnigan (1994).
Forested areas are usually avoided for the erection of wind farms. However, forestry effects on wind flow are extensive and forested areas are often close enough to wind farms to influence the wind field. An effective model of the wind flow over canopies is therefore required for accurate site energy assessment. This study illustrates the use of the canopy model implemented in the CFD code WindSim to simulate the flow over and inside canopies. Porosity and momentum sinks are applied inside the canopy in order to mime the effects of drag forces exerted by the vegetation. The numerical predictions show a good agreement with data found in the literature.
1. THE CFD CODE flow direction
The code used is WindSim, which employs a finite volumes CFD solver (PHOENICS) to asses the energy production (AEP) of wind farms. The solved equations are the continuity and the momentum equation Reynolds averaged (RANS). To close the set of equations the turbulence model employed is the standard k-ε. The previous version of the code has been modified and a new module inserted to emulate the presence of a forest by a layer of porous material. The canopy is further described by its height (hc) and roughness length (z0).
1000 m
Refined Area x = 1500 - 2500 m y = 50 - 1950 m Dimensions domain
2. POROSITY
9000 m
Number of spacings
2000 m
Nx
In the new model implemented in WindSim the porosity of the forest is given by:
Ny
Nz
61
35
124 Resolution
volume of voids β= total volume Each cell in the canopy can be therefore described by its porosity β. The only effect of the porosity β on the flow is to speed-up a flow passing from a fluid cell to a porous one, in order to satisfy the mass conservation. The present model makes use also of extra source terms added at the momentum equation. Two different extra sources have been tested, one proportional to the velocity and one proportional to the square of the velocity.
3. MOMENTUM SINKS
1000 m
min ∆x
min ∆y
33,3 m
31,1 m
Cells in the canopy N
10
264740
min ∆z
Height Distribution Factor
min ∆z HDF = = 0,0204 max ∆z
1m
Case A
Case B
Case C
Case D
Case E
Case F
β
15
50
84
15
50
84
C1
0,1451
0,01002
0,001393
0
0
0
1/s
C2
0
0
0
0,8535294
0,0055978
0,0004313
m2/m3
u5m
0,17
1,79
3,23
0,15
1,73
3,21
m/s
S
2,93E-02
2,13E-02
5,35E-03
2,93E-02
2,13E-02
5,35E-03
N/m3
Equivalent values of C1 and C2 for the studied cases.
h/hc
The concept of porosity alone is therefore not sufficient to describe completely the effects of forestry on wind. The forces exchanged between trees and fluid inside the canopy are therefore introduced in the model by adding sink terms in the momentum RANS equations. This sink of momentum is the sum of two terms, one proportional to the velocity and a second term proportional to the square of the velocity.
2,0
no canopy (porosity 100%) Case A Case B Case C Case D Case E Case F
1,5
In the case of laminar flow, steady state, negligible advection and diffusion, the source term can be considered only due to viscosity, leading to Darcy’s law, which is not applicable for the flow inside a canopy but here reported to introduce the concept of permeability k. Even if Darcy’s law is not applicable, when the porosity and the source term proportional to the velocity are applied it’s still possible to speak about an equivalent permeability k*. This value is not implemented in the code but can be related to the porosity and C1 when C2=0.
Sj =-ρC1Uj -ρC2 Ui Ui Uj
RANS momentum equation in the j-direction (with β=0):
∂U j
∂ ρ Ui = ∂x i ∂x i
∂U j ∂P µ t ∂x − ∂x + ρ fj + S j i j
0,0 0,00
sink U proportional
0,50
1,00
1,50
u/uc
m2 [C2] = m3
1 C1 = [ ] s
FORESTED SITE 1 AND 2 A lot of runs have been performed by SgurrEnergy in two forested areas, namely FS1 and FS2. The roughness parameters of the canopy have been changed to minimize the average error in correlating the measurements in FS2 and then applied to FS1. Finally a comparison is presented between wind speed prediction errors for site FS1 obtained using two codes: WAsP and WindSim.
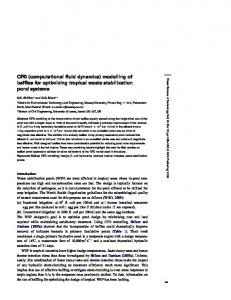
The relation k* vs. β is proposed: (C is a constant)
Values of porosity have been obtained by other authors (Wei Li et al.) and reported in the table below. These values have been obtained by optical methods, the porosity is estimated measuring clear areas on black-white pictures taken over a bright background.
0,5
2
sink U proportional
4. PERMEABILITY VS. POROSITY
1,0
β2 k* = C 1 - β2
Wind speed predictions errors at 70 m for the four FS1 masts
2
[m ]
Model WAsP
2
υ υ 1-β C1 = = k * C β2
[1/ s] WindSim
k* [m2]
C1 [1/s]
Fluid
100
-
-
Beech
84
1,108E-02
1,394E-03
Black cherry
77
6,731E-03
2,294E-03
Birch
55
2,004E-03
7,703E-03
Lime
54
1,902E-03
8,116E-03
50
1,541E-03
1,002E-02
Ash
48
1,384E-03
1,116E-02
Mature maple
47
1,310E-03
1,178E-02
Scots pine
38
7,800E-04
1,980E-02
Spruce
29
4,244E-04
3,638E-02
Cypresses
15
1,064E-04
1,451E-01
Solid
0
-
-
0,012
HAR
Predicted at: HSR HOL 2% 1%
HSR
2%
HOL
3%
3%
WST
11%
11%
12%
4%
1%
4%
5%
7%
HAR
1%
WST 14%
HSR
4%
HOL
2%
5%
WST
3%
8%
Average
14% 14% 7.2%
3% 2%
4.0%
0,010 permeability(m2)
β [%]
Species of tree
Predicted by: HAR
CONCLUSIONS
0,008 0,006 0,004 0,002 0,000 0
20
40
60
porosity (%)
80
100
A new canopy model has been developed for the code WindSim. The parameters describing the canopy are roughness length, height of canopy, porosity and two drag coefficients C1 and C2. A guideline has been provided to assign values of the describing parameters. Further validation of the model is needed against turbulence data but the results are already encouraging in terms of predicted wind speed.