S. Lison and M. Spannagl, Wiener Medizinische Wochenschrift,. 2011, 161, 58-62. 2. W. Korte, K. Gabi, M. Rohner, A. Gähler, C. Szadkowski, T. W.. Schnider, J.
View Article Online View Journal
Lab on a Chip Accepted Manuscript
This article can be cited before page numbers have been issued, to do this please use: O. Cakmak, E. Ermek, N. Kilinc, S. Bulut, . Baris, . H. Kavakli, G. G. Yaralioglu and H. Urey, Lab Chip, 2014, DOI: 10.1039/C4LC00809J.
This is an Accepted Manuscript, which has been through the Royal Society of Chemistry peer review process and has been accepted for publication. Accepted Manuscripts are published online shortly after acceptance, before technical editing, formatting and proof reading. Using this free service, authors can make their results available to the community, in citable form, before we publish the edited article. We will replace this Accepted Manuscript with the edited and formatted Advance Article as soon as it is available. You can find more information about Accepted Manuscripts in the Information for Authors. Please note that technical editing may introduce minor changes to the text and/or graphics, which may alter content. The journal’s standard Terms & Conditions and the Ethical guidelines still apply. In no event shall the Royal Society of Chemistry be held responsible for any errors or omissions in this Accepted Manuscript or any consequences arising from the use of any information it contains.
www.rsc.org/loc
Page 1 of 9
Lab on a Chip
Lab on a Chip
View Article Online
DOI: 10.1039/C4LC00809J
RSCPublishing
Cite this: DOI: 10.1039/x0xx00000x
Cartridge Based Sensor Array Platform for Multiple Coagulation Measurements from Plasma O. Cakmaka E. Ermekb , N. Kilinc b,c , S. Bulut d , I. Baris e, I.H.Kavakli d,e, G.G. Yaralioglu f and Hakan Urey b
Received 00th January 2014, Accepted 00th January 2014 DOI: 10.1039/x0xx00000x www.rsc.org/
This paper proposes a MEMS-based sensor array enabling multiple clot-time tests from plasma in one disposable microfluidic cartridge. The versatile LoC (Lab-on-Chip) platform technology is demonstrated here for real-time coagulation tests (activated Partial Thromboplastin Time (aPTT) and Prothrombin Time (PT)). The system has a reader unit and a disposable cartridge. The reader has no electrical connections to the cartridge. This enables simple and low-cost cartridge designs and avoids reliability problems associated with the electrical connections. The cartridge consists of microfluidic channels and MEMS microcantilevers placed in each channel. Microcantilevers are made of electro-plated nickel. They are actuated remotely using an external electro-coil and the read-out is also conducted remotely by a laser. The phase difference between the cantilever oscillation and the coil drive is monitored in real-time. During coagulation, the viscosity of the blood plasma increases resulting in a change in phase read-out. The proposed assay was tested with human and control plasma samples for PT and aPTT measurements. PT and aPTT measurements with using control plasmas are comparable with manufacturer’s data sheet and commercial reference device. The measurement system has an overall 7.28 % and 6.33 % CV for PT and aPTT, respectively. For further implementation, the microfluidic channels of the cartridge are functionalized for PT and aPTT tests by drying specific reagents in each channel. Since the simultaneous PT and aPTT measurements are needed in order to properly evaluate the coagulation system, one of the most prominent features of the proposed assay is the enabling parallel measurement of different coagulation parameters. Additionally, the design of the cartridge and the read out system, the obtained reproducible results with 10 µl plasma samples suggesting an opportunity of a possible Point-of -Care application.
Introduction Blood coagulation testing measures the time of onset of blood clotting, which involves an activating cascade of coagulation factors that ends with the formation of a cross-linked fibrin clot. Coagulation time tests are required for patients who are receiving anticoagulant therapy 1, undergoing pre-operation evaluation2, or suffering from hepatic or renal disorders 3, monitoring the disease progression such as dengue hemorrhagic fever4. Also patients with a risk of embolism, stroke or atrial fibrillation require their coagulation time to be measured and adjusted periodically by suitable oral anticoagulants. Thus, fast, reliable and simple assays are needed to monitor the coagulation parameters 5, 6. Prothrombin time (PT) and activated partial thromboplastin time (aPTT) are the most frequently performed tests to determine the functionality of the blood coagulation system7. The measurement of PT and aPTT depends on activation by the tissue factor (extrinsic system) or surface (intrinsic system), respectively. In clinical use, aPTT is performed by manually mixing blood plasma samples with phospholipids and an activator (silica, celite, kaolin or ellagic
This journal is © The Royal Society of Chemistry 2013
acid). For the PT test, a reagent containing tissue factor is added to a plasma sample to induce coagulation through the extrinsic pathway. In general practice, patients need to visit a hospital or a central laboratory periodically for coagulation tests. Such a procedure puts a significant burden on the health-care provider and increases the return time and the cost of the test. To alleviate these problems, some portable devices have been developed for PT measurements 8, 9. Although these systems are practical and require low sample volume, they are capable of conducting only one type of measurement with one sample. There is no commercial device which is suitable for both PT and aPTT measurements. These tests give specific information about intrinsic and extrinsic pathways which are not independent from each other 10. Hence obtaining both of the results enables a more comprehensive assessment. Furthermore, these devices require electrical connections between the disposable cartridge and the analyser unit which can create reliability problems in long-term use. On the other side, the system developed in this study measures the clot-time directly by monitoring the mechanical properties of blood with a non-
Lab Chip, 2014, 00, 1-3 | 1
Lab on a Chip Accepted Manuscript
Published on 10 October 2014. Downloaded by Koc University on 13/10/2014 06:26:52.
ARTICLE
Lab on a Chip
Page 2 of 9
Lab on a Chip
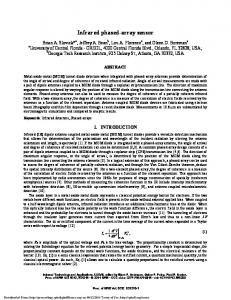
Fig. 1: (A) Schematic view of the measurement setup. Electro-coil is used for actuating the nickel cantilevers. There is no electrical connection between cartridge and reader. (B) Photo of the measurement setup.
contact actuation and detection method. Also it is the only platform that can perform multiple tests with the same sample. There have been recent studies to measure clot-time with low sample volumes using MEMS and microfluidics technology. Magnetoelastic sensors 11, 12, Quartz Crystal Microbalance (QCM)13-15 and Contour-Mode Film Bulk Acoustic Resonator (C-FBAR) based techniques 16 have been utilized to measure coagulation times. However in these studies mixing of the blood samples with the reagents were conducted manually on the sensors. Hence, functionalized sensors with microfluidic platforms are not proposed. A commercial device17 based on static mode microcantilevers is in preparation for launch soon. These cantilevers require electrical connections to the cartridge due to the use of piezo-resistive elements for sensing and actuation18. Microfluidic devices is also used for aPTT test 19 and PT test20. To the best of our knowledge, the studies in the published literature are limited to single tests and not multiplexed. Most of the clinical applications require, both PT and aPTT tests. A MEMS based microfluidic device enabling both tests with one sample is a promising tool for Point-ofCare. In our previous studies, we conducted blood plasma viscosity measurements through phase measurements with high sensitivity using the proposed scheme 21, 22. During blood coagulation, a sudden change in the blood plasma viscosity occurs due to fibrin generation 13. By monitoring the viscosity over a course of time, sudden increase in viscosity can be used as an indication of coagulation time for the given sample. In this study we have introduced a novel method using the microcantilevers and the sensing method for fast and convenient blood coagulation time measurements. To our knowledge, this is the first study using dynamic-mode cantilevers for coagulation time monitoring. The principle of the assay was introduced and the assay was tested with known plasma controls and the results are compared with reference datasheet and reference commercial device. Additionally, for further implementation, the microfluidic channels of cartridge are functionalized for PT and aPTT tests by drying specific reagents in each channel. PT and aPTT testing of control
This journal is © The Royal Society of Chemistry 2013
plasma samples revealed that coagulation times could be successfully detected for normal and abnormal plasma controls.
Materials and Methods Sensor and cartridge fabrication Sensor and Cartridge fabrication was performed using a procedure as reported in our earlier studies 21, 23, 24. Briefly the nickel cantilevers were fabricated by a simple, one mask process utilizing sputter, photolithography, electrodeposition and wet etching steps. The fabricated nickel cantilevers had 200 μm length, 20 μm width and 2 μm thickness. These dimensions were chosen to keep the resonant frequency within the operating frequency of the lock-in amplifier that was used in the experiments. After the microfabrication, the MEMS dies were placed into microfluidic cartridge. The microfluidic cartridge is consisting of two parts: the substrate and the lid. Both of the parts are made of poly methyl methacrylate (PMMA) and the specific geometries on each are patterned by precision machining. We bonded MEMS dies into the wells on the substrate. UV cured epoxy (Norland Optical Adhesive 81) was used for bonding. The microfluidic channels are patterned on the lid part. Each microchannel has 200 um depth and 1 mm width. These channels can be functionalized for different tests. The lid and substrate are bonded to each other by UV cured epoxy. This type of epoxy bonding also provides excellent sealing between the parallel channels. Each channel has a total volume of 10 µl. This volume can be further reduced with optimized cartridge geometry. Measurement setup The schematic of the experimental setup and the principle of operation were shown in Fig. 1a. The PMMA cartridge contains the MEMS dies with 2.5mm x 2.5 mm size. The nickel cantilevers are actuated magnetically with a coil placed in close proximity of the backside of the PMMA flow cell21. The coil is driven with a high power broadband current
Lab Chip, 2014, 00, 1-3 | 2
Lab on a Chip Accepted Manuscript
Published on 10 October 2014. Downloaded by Koc University on 13/10/2014 06:26:52.
ARTICLE
View Article Online
DOI: 10.1039/C4LC00809J
Lab on a Chip
Published on 10 October 2014. Downloaded by Koc University on 13/10/2014 06:26:52.
Lab on a Chip amplifier. Since no direct electrical contacts are required on the chip, magnetic actuation with an external coil has a significant advantage for in-liquid operation. The optical read-out can also be conducted remotely with laser-based techniques. The results presented in this study are obtained with a Laser Doppler Vibrometer (LDV). The vibration amplitudes are measured with a LDV. Optical measurement techniques based on grating interferometer, and knife-edge methods have also been successfully implemented in our group. Therefore, the LDV can be changed with other techniques to provide measurement parallelism21, 25. The phase difference between the coil drive and LDV is monitored with a Lock-in Amplifier (Zurich Instruments HF2LI) and recorded simultaneously using a Labview interface. All experiments are conducted at 37±0.1 oC. Temperature stability is an important aspect since it has a strong effect on viscosity 26. A temperature controller unit was built around the cartridge as shown in Fig. 1b. The unit consists of an AD590 temperature sensor, a controller circuit and heating wires entangled inside the aluminium block as shown in Fig. 1b. The system is capable of controlling the temperature with a 0.1 oC precision on the microfluidic channel. PT and aPTT measurements with control plasma samples PT and aPTT measurements were performed using healthy donor’s plasma samples and commercially available control plasma samples. Healthy volunteers signed an informed consent and the study was approved by Koç University Ethical Committee. For PT and aPTT Tests, Calcium Freeze Dried Rabbit Brain Thromboplastin (DIAGEN, UK, Lot No: T74) and Micronised Silica Platelet Solution (Lot No: SP63, DIAGEN, UK) reagents are used, respectively. Three different control plasma samples used were The Normal (Lot No: KP93, DIAGEN, UK,), Abnormal 1 (Lot No: AB1-80, DIAGEN, UK,) and Abnormal 2 (Lot No: AB2-79, DIAGEN, UK,). The blood samples were taken from a healthy 28 year old male donor into a citrated vacutainer tube (Greiner Bio One Vacuette 454326 Polyethylene Therephthalate Sodium Citrate Blood Collection Coagulation Tube, 3.2% Sodium Citrate). Afterwards the plasma is separated with centrifugation at 5000 g x 10 min. Before measurements, all the reagents and samples were prewarmed at 37 oC. Briefly, for the aPTT tests, 10 μl of test plasma (or control) is mixed with 10 μl of Micronised Silica/Platelet Substitute Mixture and the tube gently tilted at intervals for exactly five minutes. After the incubation, the sample is mixed with 10 µl 25 mM CaCl 2 solution and the clock is started (t=0). Immediately we place 5 µl of this mixture on the MEMS chip with manual pipetting. Real-time phase and amplitude read-out is conducted. For the PT tests a similar strategy is followed. The reagent used in PT measurements (Calcium Freeze Dried Rabbit Brain Thromboplastin) is involves Ca2+ inside. Briefly, 20 μl of Calcium Rabbit Brain Thromboplastin is mixed with 10 μl of plasma and a stop watch started (t=0). After mixing the mixture is introduced to the system like in the aPTT test.
This journal is © The Royal Society of Chemistry 2012
View Article Online
DOI: 10.1039/C4LC00809J
ARTICLE The PT and aPTT were calculated when the slope of the first- order derivative of the coagulation curve, recorded from change of the phase was maximal. Sample preparation for scanning electron microscopy (SEM) Samples were prepared as described for the test on the MEMS chip and then fixed for 4 h in 2.5% glutaraldehyde at room temperature. Dehydration with increasing ethanol concentrations (30%-100 % v/v) was followed by drying. The samples were coated with 3 nm Au-Pd and imaged by Zeiss Ultra Plus FE-SEM.
Results and Discussion Characterization of the system When the cantilevers are operated in a viscous liquid media, the viscosity influences the resonant frequency and the quality factor of the system. In our previous works we measured the viscosity changes with a sensitivity of 0.01 cP, by tracking frequency at constant phase difference 21 or by tracking phase changes at constant frequency22. During blood coagulation a sudden change in blood plasma viscosity occurs. When the coagulation is initialized, thrombin acts on fibrinogens that result in the fibrin generation, then fibrins aggregate and form insoluble clots. After coagulation measurement, MEMS chips were investigated with SEM and clot formation was clearly observed on MEMS cantilevers (Fig. 2). Changes in the viscosity of plasma were caused by the formation of the fibrin clot14, and we monitored this significant change in the viscosity by real-time tracking of the phase and amplitude.
Fig. 2: SEM images of fibrin networks formed after the coagulation on the MEMS chip (A), more detailed (B), less concentrated (C) form of the fiber structure. Dried fibrins pulled the cantilever and stock it to the silicon surface.
Lab Chip, 2014, 00, 1-3 | 3
Lab on a Chip Accepted Manuscript
Page 3 of 9
View Article Online
Lab on a Chip
Page 4 of 9
DOI: 10.1039/C4LC00809J
Before the coagulation measurements we characterized the system in air, Deionized (DI) water and blood plasma. Fig. 3 shows the frequency response and the phase of the system in different mediums. The resonant frequency of the cantilever is 39206 Hz when it is operated in air. Also the Quality Factor (Q) is around 178. However when it was operated in DI water the frequency drops down to 22185 Hz and the Q is around 5. This harsh decrease is due to hydrodynamic loading which has both 27. inertial and viscous components The response in blood plasma before coagulation is similar to DI water. The resonant frequency is 20267 and the Q is around 3.6. This is due to the higher viscosity and density of blood plasma with respect to DI water. Detailed information can be obtained from our previous 21, 22 studies on blood plasma viscosity .
Lab on a Chip driven by a constant amplitude. Also, the effect of viscosity change can be observed as a phase shift between the drive signal and the phase of the mechanical displacement. Depending on the drive frequency the phase shift could be either positive or negative. The effect of viscous loading on mechanical resonators have been further investigated in the literature28-30. After coagulation, the quality factor and the resonant frequency is changed. The significant difference in the phase curve after the coagulation is shown in Fig. 3a. According to our method we excited the system at a certain frequency around the resonant peak. The phase difference at that certain frequency changed during coagulation. Hence simultaneous monitoring of the phase gave a unique signature which indicates the coagulation time. Fig. 3b shows the long-term phase stability of the system in citrated blood plasma. The cantilever was driven at its resonant frequency. The phase was recorded for 30 minutes. The standard deviation of the phase during this measurement is 0.015o which can be defined as the noise floor of the system. As will be shown during coagulation measurements, this value is highly sufficient for sensing blood coagulation. Experimental Procedure
Fig. 3: (A) Frequency response and phase of the system in air, in DI water and in human blood plasma before and after coagulation. (B) Phase stability result with citrated (non-coagulating) blood plasma. f = 20 kHz, Standard Deviation = 0. 015o
During blood coagulation, a sudden change in the blood plasma viscosity occurs due to fibrin generation 13. This kind of viscosity change creates an increase in the hydrodynamic loading of the vibrating structures in viscous liquids according to Sader’s theory27. For example, increasing viscosity reduces the vibration amplitude of the vibrating mechanical structure
4 |Lab Chip, 2014, 00, 1-3
In this study we conducted both the aPTT and PT tests with our system. In order to investigate the sensitivity and reproducibility of the system, we used commercially available control plasma samples. The coagulation time measurements with Normal, Abnormal 1 and Abnormal 2 control plasma samples are conducted and the results are compared with the standard values provided by the manufacturer and a commercial reference device CoaguCheck XS (Roche, Germany). Afterwards different channels of the same cartridge are functionalized for different tests and both PT and aPTT tests are performed on the same cartridge. Briefly, for the PT and aPTT tests, 10 μl of test plasma (or control) is mixed either with 20 μl of with Calcium Freeze Dried Rabbit Brain Thromboplastin reagents or with 10 μl of Micronised Silica/Platelet Substitute Mixture, respectively. A stopwatch started (t=0) and 5 µl of this mixture was placed immediately on the MEMS chip. Real-time phase and amplitude read-out is conducted. The phase and amplitude of the system during a PT test is shown in Fig. 4a. The sharp change of the phase and amplitude during coagulation can be seen. The first 5 seconds is the time passed during the mixing of reagent and plasma and introducing the mixture to the system. The amplitude data is noisier than the phase read-out. This can be related with the relatively small vibration amplitudes. The RMS value of the displacement is in the order of 10 nm. This is a very small value compared to cantilever dimensions (Length: 200µm, Width: 20µm, Thickness: 2 µm). Also during coagulation, as a result of increased viscosity, the vibration is being damped and the amplitude decreases to even lower values. The amplitude readout is susceptible to the environmental noise. However the phase read-out approach is more immune to external noise
This journal is © The Royal Society of Chemistry 2012
Lab on a Chip Accepted Manuscript
Published on 10 October 2014. Downloaded by Koc University on 13/10/2014 06:26:52.
ARTICLE
Lab on a Chip
Published on 10 October 2014. Downloaded by Koc University on 13/10/2014 06:26:52.
Lab on a Chip sources since a reference signal (coil input) is being used. Phase gives clearer information since the Signal-to-Noise Ratio (SNR) is higher. It is more convenient to use phase for tracking coagulation. After the data is collected a polynomial is fitted to the phase data which is shown in Fig. 4b. The first derivative of this polynomial is used to obtain quantitative data. The time where the derivative is zero (df/dt→0) indicates the coagulation start time whereas the local minimum (df/dt→min.) shows the midpoint of the coagulation process (Fig. 4b). In Fig. 4c the fit functions obtained from the repetitive PT measurements with Normal, Abnormal1 and Abnormal2 plasma are shown. Fig. 4d shows the first derivatives of these functions. The difference between the coagulation times with different samples can be seen. They can be clearly distinguished from each other. The
View Article Online
DOI: 10.1039/C4LC00809J
ARTICLE same data acquisition and processing protocol is also applied in aPTT measurements. After the measurements, the values are normalized with respect to the mean value of the normal plasma sample. The commercial devices report the coagulation times in terms of International Normalized Ratio (INR) 5. There will be a variation between the test results (in seconds) of a normal individual. This is due to the variations in the batches of reagent and test conditions. The INR is devised to standardize these results. It is related between the tested individual’s PT time and normal PT time20. International Normalized Ratio (INR) for PT measurements and normalized ratio for the aPTT measurements are obtained. The mean value, standard deviation and coefficient of variation for the PT and aPTT measurements are shown in Table 1.
Fig. 4: (A) The change of the phase and amplitude during PT test with an Abnormal 1 control plasma sample. (B) Polynomial fit to the phase data and the first derivative of the fit function, the time where df/dt→0 indicates the onset of the coagulation which is reported as coagulation time. (C) PT tests with normal, abnormal 1 and abnormal 2 control plasmas, n=3 for each measurement (D) First derivatives of the phase curves.
This journal is © The Royal Society of Chemistry 2012
Lab Chip, 2014, 00, 1-3 | 5
Lab on a Chip Accepted Manuscript
Page 5 of 9
View Article Online
Lab on a Chip
Page 6 of 9
DOI: 10.1039/C4LC00809J
ARTICLE
Lab on a Chip
Table 1. PT results in terms of INR and aPTT results in terms of normalized ratio. The results are compared with the reference datasheet of control plasmas and reference commercial device.
PT (INR)
Normal Abnormal 1 Abnormal 2
Mean 0.95 1.47 2.74
Within Day σ 0.07 0.16 0.26
CV (%) 7.73 10.54 9.63
Mean 1.00 1.60 2.75
Datasheet (INR) Between Day σ CV (%) 0.08 7.79 0.11 6.85 0.20 7.20
Mean 1.03 1.74 2.83
σ 0.07 0.35 0.40
Reference Device (INR)
1.30 1.60 3.30
aPTT (Normalized Ratio) MEMS results (Ratio) Within Day
Datasheet (Ratio) Between Day
Mean
σ
CV (%)
Mean
σ
CV (%)
Mean
σ
Normal
1.04
0.05
5.24
1.01
0.04
3.94
1.01
0.08
Abnormal 1
1.19
0.04
3.10
1.19
0.11
9.11
1.36
0.20
Abnormal 2
1.89
0.20
10.65
1.78
0.10
5.87
1.93
0.28
The start-point of the coagulation obtained with our system has a better coherence with the reference data than the coagulation mid-point. Also another reference PT measurement is conducted with a reference commercial device CoaguCheck XS. Again the coagulation times are in a good agreement with the commercial reference device measurements. Our proposed novel assay can significantly differentiate coagulation times between normal, abnormal 1, and abnormal 2 samples (p 0.05). Measurements with surface functionalized channels: All above measurements were performed with samples prepared outside the cartridge and placed on MEMS chips. For further implementation, the microfluidic channels of cartridge are functionalized for PT and aPTT tests by drying specific reagents in each channel. Then we performed PT and aPTT measurements with surface functionalized cartridges.
6 |Lab Chip, 2014, 00, 1-3
Fig. 5: The INR and Normalized Ratio values of PT and aPTT tests. The reference value is provided from the manufacturer’s data sheet. The error bars on the reference values shows the standard deviations obtained by the range indicated at the datasheet. The error bars on the MEMS Sensor shows the standard deviations of the measurements.
The surface functionalized channels of the cartridge are shown in Fig. 6a. For the aPTT Test, Micronised Silica Platelet Solution (Lot No: SP63, DIAGEN, UK) was used whereas for the PT Test Freeze Dried Rabbit Brain Thromboplastin (Lot
This journal is © The Royal Society of Chemistry 2012
Lab on a Chip Accepted Manuscript
Published on 10 October 2014. Downloaded by Koc University on 13/10/2014 06:26:52.
MEMS results (INR)
Lab on a Chip
Published on 10 October 2014. Downloaded by Koc University on 13/10/2014 06:26:52.
Lab on a Chip No: DT139, DIAGEN, UK) was used. Briefly, 10 µl of each solution was poured into the microchannels. 10 µl of 25 mM CaCl2 was also poured into the channels at the opposite side (Fig. 6a). Afterwards the cartridge was placed into a vacuum chamber for drying. The vacuum drying operation was conducted at around 100 mmHg vacuum for 20 min to dry the reagents. For each test 10 µl of blood plasma sample at 37 oC is poured into the reagent coated channel. For aPTT test 5 min of incubation is chosen whereas for the PT test this time is 1 min. After the incubation, the sample is pushed to the opposite channel that is coated with CaCl 2. When the sample touches to the channel walls, the sample is pulled back to the cantilever site and the clock is started (t=0). Real-time phase and amplitude read-out was conducted. Though the tests are conducted one at a time within the scope of this paper, tests can be performed simultaneously using multiple photodetectors for the readout. Since the electromagnetic actuation is at a constant frequency, using a detector array will enable simultaneous
View Article Online
DOI: 10.1039/C4LC00809J
ARTICLE monitoring of the phases of different cantilevers in parallel channels. The results of the PT and aPTT test proceeded on the same cartridge is shown in Fig. 6b. As expected, when the coagulation started a sharp change in the phase was observed. The reference curve is obtained by addition of Ca 2+ to the citrated blood plasma. According to the first derivative of the phase data the coagulation time is 645s for the reference channel. This is an expected value since no external reagent is added to the system. According to the first derivative of the phase data the coagulation time for aPTT test was 67s whereas for PT test it was 22s. According to the reference values in the reagent datasheets these values supposed to be between 35-40s and 14-17s for aPTT and PT tests, respectively. This slight difference was probably due to reagent mixing inefficiency in microchannels and further improvements are needed to obtain more accurate PT and aPTT values.
Fig. 6: (A) Scheme of the functionalization procedure. Channels are functionalized for aPTT, PT and reference tests. (B) aPTT and PT Tests and the reference measurement conducted in different channels of the same cartridge.
This journal is © The Royal Society of Chemistry 2012
Lab Chip, 2014, 00, 1-3 | 7
Lab on a Chip Accepted Manuscript
Page 7 of 9
Lab on a Chip
Published on 10 October 2014. Downloaded by Koc University on 13/10/2014 06:26:52.
Conclusions In this paper we demonstrated, a LoC (Lab-on-Chip) sensor array platform enabling multiple coagulation tests. The system has independent reader and cartridge units. The cartridge consists of microfluidic channels and MEMS microcantilevers placed inside them. The magnetic microcantilevers are made of electro-plated nickel. In different channels of the cartridge aPTT and PT tests were conducted with blood plasma taken from a healthy donor. The sample volume used for each test was 10 µl which could be decreased with further design improvements. In order to improve the system to commercial medical device level, standardized clinical tests are required. The effect of surface properties will be investigated and the mixing conditions will be optimized to obtain high repeatability. Nevertheless, obtained results gave satisfactory information about the proof of concept. To the best of our knowledge this is the first demonstration of the use of a dynamic microcantilever based system for coagulation time measurement. The independence of the cartridge and reader unit increases the potential of this approach as a Point-of-Care system. In this study we used a bench-top prototype reader unit based on an LDV. In the future, the LDV will be replaced by an optical read-out based on optical lever method. The reflected beams will be measured using a photodetector array. This will enable manufacturing of a handheld device capable of measuring multiple tests. The ultimate goal of this project is to develop a system that is capable of making measurements from whole blood. Towards this goal, in this study we demonstrated the system using blood plasma. In the future, the tests will be conducted also with whole blood samples.
Acknowledgements This work is supported by TÜBİTAK 111E184 and 113S074 grants. The authors thank to Dr. Caglar Elbuken, Dr. Erdem Alaca, Aref Mostafazadeh, M. Kivanc Hedili, Umit Celik and Dr. Ahmet Oral for valuable discussions about this study.
Notes and references Koç University, Mechanical Engineering, Rumeli Feneri Yolu, 34450 Sariyer, Istanbul, Turkey b Koç University, Electrical and Electronic Engineering, Rumeli Feneri Yolu, 34450 Sariyer, Istanbul, Turkey c Gebze Institute of Technology, Department of Physics, Kocaeli, Turkey d Koç University, Chemical and Biological Engineering, Rumeli Feneri Yolu, 34450 Sariyer, Istanbul, Turkey e Koç University, Department of Molecular Biology and Genetics, Rumeli Feneri Yolu, 34450 Sariyer, Istanbul, Turkey f Ozyegin University University, Faculty of Engineering, Cekmekoy, Istanbul, Turkey a
This journal is © The Royal Society of Chemistry 2013
Page 8 of 9
Lab on a Chip 1. S. Lison and M. Spannagl, Wiener Medizinische Wochenschrift, 2011, 161, 58-62. 2. W. Korte, K. Gabi, M. Rohner, A. Gähler, C. Szadkowski, T. W. Schnider, J. Lange and W. Riesen, Thrombosis and Haemostasis, 2005, 94, 211-215. 3. V. L. Ng, Clinics in laboratory medicine, 2009, 29, 265-282. 4. S.-W. Lin, Y.-C. Chuang, Y.-S. Lin, H.-Y. Lei, H.-S. Liu and T.-M. Yeh, Journal of Infection, 2012, 64, 325-334. 5. L. F. Harris, V. Castro-López and A. J. Killard, TrAC Trends in Analytical Chemistry, 2013, 50, 85-95. 6. M. T. Ganter and C. K. Hofer, Anesthesia & Analgesia, 2008, 106, 1366-1375. . 7. C. P. Hayward, K. A. Moffat, E. Plumhoff and E. M. Van Cott, American journal of hematology, 2012, 87, S45-S50. 8. Coagucheck XS System, Roche, Germany http://www.coaguchek.com/coaguchek_patient/landing,, Accessed 15.06.2014. 9. Alere-INRatio, United Kingdom, http://www.alere.com/ww/en.html, Accessed 15.06.2014. 10. M. B. Gorbet and M. V. Sefton, Biomaterials, 2004, 25, 5681-5703. 11. L. G. Puckett, G. Barrett, D. Kouzoudis, C. Grimes and L. G. Bachas, Biosensors and Bioelectronics, 2003, 18, 675-681. 12. L. G. Puckett, J. K. Lewis, A. Urbas, X. Cui, D. Gao and L. G. Bachas, Biosensors and Bioelectronics, 2005, 20, 1737-1743. 13. L. M ller, S. Sinn, . Drechsel, C. iegler, .-P. Wendel, H. Northoff and F. K. Gehring, Analytical Chemistry, 2009, 82, 658-663. 14. C. Y. Yao, L. Qu and W. L. Fu, Sensors, 2013, 13, 6946-6956. 15. R. S. Lakshmanan, V. Efremov, S. M. Cullen and A. J. Killard, Sensors and Actuators B: Chemical, 2014, 192, 23-28. 16. W. Xu, J. Appel and J. Chae, Microelectromechanical Systems, Journal of, 2012, 21, 302-307. 17. Microvisk, Microvisk, U.K., http://www.microvisk.com/technology/, Accessed 21.02.2014, 2014. 18. V. Djakov, R. J. Dunn and E. Huq, Google Patents, 2012. 19. B. Ramaswamy, Y.-T. T. Yeh and S.-Y. Zheng, Sensors and Actuators B: Chemical, 2013, 180, 21-27. 20. C.-H. Shih, C.-H. Lu, J.-H. Wu, C.-H. Lin, J.-M. Wang and C.-Y. Lin, Sensors and Actuators B: Chemical, 2012, 161, 11841190. 21. O. Cakmak, C. Elbuken, E. Ermek, A. Mostafazadeh, I. Baris, B. Erdem Alaca, I. H. Kavakli and H. Urey, Methods, 2013, 63, 225-232. 22. O. Cakmak, E. Ermek, H. Urey, G. G. Yaralioglu and N. Kilinc, SENSORS, 2013 IEEE, 2013, 1-4. 23. O. Cakmak, N. Kilinc, E. Ermek, A. Mostafazadeh, C. Elbuken, G. G. Yaralioglu and H. Urey, Micro Electro Mechanical Systems (MEMS), 2014 IEEE 27th International Conference on, 2014, 330-333. 24. E. Timurdogan, N. Ozber, S. Nargul, S. Yavuz, M. S. Kilic, I. H. Kavakli, H. Urey and B. E. Alaca, Biosensors and Bioelectronics, 2010, 26, 195-201. 25. O. Çakmak, Ç. Elb ken, E. Ermek, S. Bulut, Y. Kılınç, I. Barış, . Kavaklı, E. Alaca and . Ürey, New Biotechnology, 2012, 29, S162-S163.
Lab Chip, 2014, 00, 1-3 | 8
Lab on a Chip Accepted Manuscript
ARTICLE
View Article Online
DOI: 10.1039/C4LC00809J
Page 9 of 9
Lab on a Chip
ARTICLE
26. J. W. M. Chon, P. Mulvaney and J. E. Sader, J. Appl. Phys., 2000, 87, 3978-3988. 27. J. E. Sader, J. Appl. Phys., 1998, 84, 64-76. 28. A. Maali, C. Hurth, R. Boisgard, C. Jai, T. Cohen-Bouhacina and J. P. Aime, J. Appl. Phys., 2005, 97. 29. J. E. Sader, J. W. M. Chon and P. Mulvaney, Rev. Sci. Instrum., 1999, 70, 3967-3969. 30. I. A. M. Dufour, Y. Amarouchene, C. Ayela, B. Caillard, A. Darwiche, M. Guirardel, and E. L. H. Kellay, F.Mathieu, C. Pellet, D. Saya, M. Youssry, L. Nicu, and A. Colin, Journal of Sensors, 2012, 2012, 1-9. 31. Coagucheck XS, Evaluation Report 06024, Roche, Germany, http://www.roche.co.uk/content/dam/internet/corporate/roche/e n_GB/documents/Evaluation_Report_-_CoaguChek_XS.pdf, Accessed 15.06.2014.
This journal is © The Royal Society of Chemistry 2012
Lab on a Chip Accepted Manuscript
Published on 10 October 2014. Downloaded by Koc University on 13/10/2014 06:26:52.
Lab on a Chip
View Article Online
DOI: 10.1039/C4LC00809J
Lab Chip, 2014, 00, 1-3 | 9