Available online at www.CivileJournal.org
Civil Engineering Journal Vol. 4, No. 4, April, 2018
Fuzzy Analytic Hierarchy Process Evaluation Method in Assessing Corrosion Damage of Reinforced Concrete Bridges Zhicheng Gao a*, Jiliang Li b a b
Doctor of Philosophy, Department of Civil Engineering, University of Akron, Akron, OH 44325-390, USA.
Assistant Professor,PhD, PE, M.ASCE, M.ASEE, Department of Mechanical and Civil Engineering, Purdue University Northwest, Westville, IN46391, USA. Received 29 March 2018; Accepted 26 April 2018
Abstract Effective method used to deal with the corrosion damage condition of any concrete bridge superstructure will help decision makers of bridge management agencies to better choose repair material, and optimize repair method. Simplified corrosion index (SCI) is a very useful and simple index to characterize the actual corrosion damage condition of a reinforced concrete bridge superstructure. In this paper, SCI is calculated by combining the Corrosion Damage Index (CDI), Environment Change Factor (ECF) and Material Vulnerability Factor (MVF). The Analytic Hierarchy Process (AHP) method is applied to decide the weight factors of CDI, ECF and MVF. The Fuzzy-AHP evaluation method is used in this study to deal with the fuzzy problem of differentiating the different levels of corrosion indicators and to determine the appropriate weight factors. The asymmetric nearness degree method is applied to re-analyze the evaluation vector from Fuzzy-AHP method to calculate the corrosion damage level based on all corrosion indicators. A numerical example was presented to demonstrate the procedure and the benefits of the AHP method, and the proposed Fuzzy-AHP approach, along with the asymmetric nearness degree method, in dealing with the fuzzy nature of SCI calculation problem. Keywords: Fuzzy-AHP; Corrosion Damage; Index; Weigth Factors; Concrete; Bridge.
1. Introduction Corrosion of reinforcing steel in reinforced concrete structures has caused deterioration and damage that require repairs and maintenance to extend their service life [1-4]. Consequently, there is an urgent need to develop adequate and simple tools for assessing objectively the corrosion damage condition of reinforced concrete bridge superstructure. An effective assessment of corrosion damage level is needed to allow for the decision makers of bridge management agencies to better determine the timing of repair/maintenance. There are several aspects that need to be considered in assessing the structures corrosion condition. It is common that different researchers may have different opinions as to the selection of appropriate corrosion indicators or the criteria for differentiating corrosion damage levels. As an example, the procedures outlined in CONTECVET manual [5] provide a very simple and linear approach to calculate Simplified Corrosion Index (SCI) based on Corrosion Damage Index (CDI) and Environment Aggressivity (EA). CDI is calculated according to the descriptive criteria of several indicators: chloride level, crack width due to corrosion, etc. As another example, Fazal [6] and Yehia [7] provided forty-three rules in developing decision-making tools for selecting appropriate repair methods and repair materials. Among the indicators considered include total delamination area, crack width, and others. AASHTO [8] and ACI 224R-01 and ACI 201.2R [9, 10] provide suggested critical values on concrete surface crack * Corresponding author:
[email protected] http://dx.doi.org/10.28991/cej-0309138 This is an open access article under the CC-BY license (https://creativecommons.org/licenses/by/4.0/). © Authors retain all copyrights.
843
Civil Engineering Journal
Vol. 4, No. 4, April, 2018
width for controlling corrosion damage, and the minimum chloride concentration on reinforcement surface to initiate corrosion. However, these critical values in the standards or codes do not provide linkage between indicators and damage levels. The assessment of the corrosion damage level of reinforced concrete bridge superstructure based on inspection data is a complex task. This is because that there are many corrosion indicators that need to be considered. These corrosion indicators may be interrelated. More critically, determining these corrosion indicators based on inspection data may inevitably introduce uncertainty. When one attempts to relate inspection data to corrosion indicators, and eventually to corrosion damage level, the task has pronounced fuzzy characteristics. This is due to the fact that many inspection data cannot be clearly and quantitatively linked to structure corrosion damage level. Furthermore, some of inspection data is hard to collect correctly or completely. It is very difficult to or even impossible to obtain clear functional relationships between the changes of corrosion indicators and the changes in corrosion damage level. As often is the case, experts make decisions based on the corrosion damage level of a reinforced concrete structure, as recommended in [5-7]. In this paper, fuzzy algorithms [11-13] are used in developing tools for judging the corrosion damage level of reinforced concrete bridge superstructure. Fuzzy theory is a mathematical method to comprehensively evaluate things that are not easy to be clearly defined in the real world by using the thinking and methods of fuzzy mathematics [1418]. Through the fuzzy evaluation information about the priority of various alternatives can be achieved as a reference for decision makers to make a decision. The motivation of adopting AHP algorithm, a multi-criteria decision-making approach pioneered by Saaty [19-22], is that the linear combination method (or equal weight approach) in combining with equal weight of all corrosion indicators to calculate the corrosion damage level in [5] may not be reasonable. It is ideally to have the ability to assign different weight factor for each corrosion indicator, as elucidated in [23]. Typically, the AHP method [24] contains three principal steps: a) Compose hierarchical structure; b) Establish a pair-wise comparison decision matrix; c) Calculate criteria weight. The main objective of this paper is to present a new approach for determining corrosion damage level based on a comprehensive list of corrosion indicators from field inspection data. A comprehensive set of corrosion indicators are identified. Next, the AHP is adopted to help determine the weight factors for three important factors in determining corrosion damage level expressed by SCI; namely, CDI, ECF, and Material Vulnerability Factor (MVF). ECF is the same index value with EA in [5] used to calculate the SCI in this paper. To calculate CDI from the selected corrosion indicators, the Fuzzy-AHP method is used together with the asymmetric nearness degree method proposed by Wang [25].
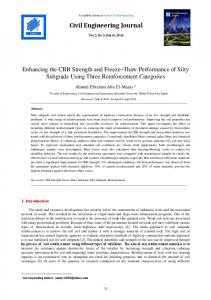
2. Technical Approach The CONTECVET manual [5] proposed a linear method to calculate the SCI for assessing the corrosion process in reinforced concrete structures. The corrosion process is classified into four levels according to the following criteria: I: No corrosion, II: Low corrosion, III: Moderate corrosion, IV: High corrosion. SCI is determined based on two main factors (Figure 1): actual corrosion damage level represented by CDI and EA. The CDI is determined from six corrosion indicators as shown in Table 1. Table 1. Corrosion indicators and damage levels Corrosion indicators
Level I
Level II
Level III
Level IV
Carbonation depth(m)
𝑋𝑐𝑜2 = 0
𝑋𝑐𝑜2 < 𝑐
𝑋𝑐𝑜2 = 𝑐
𝑋𝑐𝑜2 > 𝑐
𝑋
𝑋
𝑋
𝑋𝐶𝑙− > 𝑐
Chloride level(m)
𝐶𝑙 −
=0
𝐶𝑙 −
0.3𝑚𝑚
Spalling and generalized cracking
Resistivity(Ω m)
> 1000
500 − 1000
100 − 500
< 100
Bar section loss (%)
10
Corrosion rate of main reinforcement (𝜇𝐴/𝑐𝑚 2 )
< 0.1
0.1 − 0.5
0.5 − 1.0
> 1.0
Notes: 𝑋𝑐𝑜2 is the actual carbonation depth; 𝑋𝐶𝑙− is the actual chloride threshold depth; 𝑐 is the concrete cover; 𝜔 is the crack width.
Environment Aggressivity EA (0-4)
Corrosion Damage Index CDI (0-4)
Simplified Corrosion Index SCI (0-4)
Figure 1. SCI calculation scheme
844
Civil Engineering Journal
Vol. 4, No. 4, April, 2018
The CDI is calculated by averaging all levels of six indicators as given in following equation. n
CDI
Corrosion _ Indicator _ damage _ level i 1
(1)
i
n
Thus, CDI value can be any number between 1 and 4. This number is difficult to use by the decision makers. For example, a CDI value of 1.1 and 1.9 may be considered as having the same damage level by the decision makers. Andrade [23] suggested that it is desirable to consider different importance for each indicator in the calculation of the CDI. The EA index is based on the environmental exposure classes taken from EN206 [26]. The higher environmental aggressiveness affects the structure, the higher the EA index value will be. For example, for the concrete inside buildings with very low air humidity, there is no risk of corrosion or attack. For this reason, the EA index value of 0 is assigned to this class. If the concrete structures expose to tidal, splash and spray zones in parts of marine, then there is an extremely high corrosion risk due to the presence of chlorides accompanied with dry/wet cycles. For this reason, the EA index value is assigned as 4. More detailed discussion of the rationales can be found in [5]. At the present time, calculation of SCI is made by averaging the EA and CDI values as follows:
SCI
EA CDI 2
(2)
An alternative approach to assessing corrosion damage levels has been proposed by Fazal [6] and Yehia [7], in which three aspects of structure conditions are incorporated in the assessment matrix: delamination, crack width, and crack depth. Quantitative criteria adopted in [6-7] for making decisions are presented in Table 2. Table 2. Quantitative criteria for delamination, crack width, and crack depth Indicators
Different levels
Percentage of delamination
0%-25%
Crack width (mm)
25%-70%
0.6 152-300
It was pointed out in [27] that different structure elements may require different attention level in assessing corrosion damage levels. Consequently, MVF was introduced. Table 3 provides suggested values for MVF for different types of structural elements. Table 3. MVF rating
MVF
1
2
3
4
Steel
Reinforced Concrete
Precast Concrete and other material
Pre-stressed concrete
3. Fuzzy Theory Applied to Calculation of CDI 3.1. Corrosion Indicators
In this paper, the corrosion indicators adopted in [5, 6] and additional indicators from [28] to make it comprehensive and applicable to practiced usage. As a result, a total of nine corrosion indictors, summarized in Table 4, are used as important corrosion indicators. Table 4. Corrosion indicators Corrosion indicators Chloride level The total percentage of delamination (%) Cracking width due to corrosion (mm) Cracking depth (mm) Cracking area (%) (*) Bar exposed (%) Bar section loss (%) Resistivity (Ω m) Corrosion rate of main reinforcement (𝜇𝐴/𝑐𝑚 2 ) Note: Base on the test technology you can choose some of them to calculate the CDI; (*) were added based ODOT’s inspection manual
845
Civil Engineering Journal
Vol. 4, No. 4, April, 2018
3.2. Fuzzy Theory Applied To Calculation Of CDI
The steps involved in developing fuzzy theory based method are as follows: 1) Determine the corrosion indicators set-U; 2) Determine the evaluation (comments) set-V; 3) Determine the weight factor of each corrosion indictor; 4) Establish the fuzzy evaluation matrix-R-from U to V, for which all the items are obtained from the membership function of each indicator; 5) Obtain the results of evaluation; 6) Obtain the conclusion of judgment. 3.3. Building Membership Functions
The most important step of utilizing the Fuzzy theory is to determine the membership function. Ideally, the process of the determination of membership function should be objective. However, since different experts or practitioners may have different opinions; therefore, certain subjectivity is still needed. The value in the range [0, 1], known as membership degree, represents the relationship of the element and the fuzzy set. If membership degree is close to 0, then it indicates that the possibility of that element belongs to the fuzzy set is low. If membership degree is close to 1, then it indicates that the possibility of element belonging to the fuzzy set is high. Common membership functions may exhibit different shape, principal value interval, and symmetrical characteristics, etc. Zhao and Bose [29] compared the effects of different membership functions and concluded that the triangular membership function is the easiest function type for implementation, while the trapezoidal membership function is very close to triangular membership function. In this paper, nine corrosion indicators are adopted; the two critical points are 0, 1, and the fuzziest point is 0.5. Therefore, these three points can be connected with a straight line. The transitional zone (principal value interval) should not be a value but a region. Based on the above discussions, the trapezoidal distribution fuzzy membership function, presented in Table 5, is used to determine the membership degree matrix in this paper. Table 5. Trapezoidal membership functions Deflection Minor Type
Middle Type
A(x)
A(x)
a
A(x)
1
1
0
Deflection Large Type
b
x
Trapezoidal distribution
1, x a b x A( x) ,a x b ba 0, x b
0
1
a
b
c
d
x
0, x a xa ,a x b ba A( x ) 1, b x c dx ,c x d d c 0, x d
0
a
b
x
0, x a xa A( x) ,a x b ba 1, x b
The detailed mathematical expressions for each of the four levels adopted in this paper are shown below: 1) The membership function of
1 c x rij ( x) 2 c2 c1 0
x in level I:
x c1 c1 x c2
(3)
c2 x
2) The membership function of
x in level II:
846
Civil Engineering Journal
Vol. 4, No. 4, April, 2018
x c1
0 x c1 c c 2 1 r ij ( x) 1 c4 x c c 3 4 0
c1 x c2 c2 x c3 c3 x c4 x c 4
3) The membership function of
x in level III:
x c3
0 x c3 c4 c3 r ij ( x) 1 c6 x c6 c5 0
c3 x c4 c4 x c5
(5)
c5 x c6 x c 6
4) The membership function of
0 x c 5 rij ( x) c6 c5 1
(4)
x in level IV:
x c5 c5 x c6
(6)
c6 x
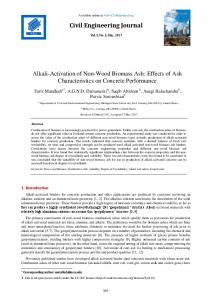
Where:𝑥 is the corrosion indicators; 𝑐𝑖 is the corresponding corrosion level; 𝑟𝑖𝑗 (𝑥) is the membership degree of the index 𝑖 corresponding to level 𝑗. Using the mathematical expressions given above, the membership degree function figures of the nine corrosion indicators (Table 4) can be obtained. The rationale for the membership functions is discussed herein. The upper and lower critical values of the nine indicators are selected based on interpretation of various literature and the related standards in North America. 1) The chloride concentration indicator ACI 222R [30] and ACI 201.2R-08 [10] provide the chloride limit value (0.15%-average value) of the chloride concentration by the mass of cement for concrete structure with testing the sample gotten by core drilling. But the direct data gotten from field tests is the percent by the mass of concrete. Therefore, the chloride limit value of ACI 222R [30] and ACI 201.2R-08 [10] is divided by 7 (a conversion coefficient between the percent chloride by the mass of concrete and the mass of cement), resulting in about 0.02%. The membership function of Chloride concentration is shown in Figure 2a. 2) Delamination indicator Delamination is an act of splitting or separating a laminate or solid into layers. Based on [5, 6], different researchers have considered different critical values and different methods to divide the concrete delamination condition into four levels. According to [28], the critical condition for concrete delamination condition is 30% of the component area. The membership function of delamination is shown in Figure 2b. 3) Cracking width indicator AASHTO [6] provides the crack width of 0.017 in (0.43 mm) as a critical value requiring attention. A more conservative value of 0.3 mm suggested in [1] is selected in this paper. The value of crack width is the average value per crack after measuring all the cracks of the critical evaluation area. The membership function of crack width is shown in Figure 2c. 4) Crack depth indicator The crack depth is used to determine the suitable repair method (Table 2); therefore, crack depth is included as one of the indicators. Our selection of 300 mm as a critical value is based on gathering of experts’ opinion from Department
847
Civil Engineering Journal
Vol. 4, No. 4, April, 2018
of Transportation, which is also the average value similar as crack width. The membership function of crack depth is shown in Figure 2d. 5) Crack area indicator The crack area [28] can be measured as the total area contains all the cracks appearing in surface of the structure components. The critical value is when the total crack area has reached 30% of the total components area. The membership function of crack area is shown in Figure 2e. 6) Reinforcement exposure indicator The condition of primary bars exposure should be considered during field inspection and condition rating work. It is stated in [28] that if 30% of all the primary bars were exposed in one transverse section, that would be considered as the critical value. The membership function of bar exposure is shown in Figure 2f. 7) Reinforcement section loss indicator It was pointed out that the critical condition for the section loss of the reinforcing bars is 10% of the original section area [5, 28]. The membership function of bar section loss is shown in Figure 2g. 8) Concrete resistivity indicator It was mentioned that the concrete resistivity provides information about the potential for corrosion [5, 31], in which 100 Ω. 𝑚 is considered as the critical value. The membership function of concrete resistivity is shown in Figure 2h. 9) Corrosion rate indicator Non-destructive testing evaluation using the galvanostatic plus measurement is a useful and effective method to 𝜇𝐴 obtain the information of corrosion rate [7, 31-32]. A critical value of 1 ⁄𝑐𝑚2 [1] is established to build the membership function, which is shown in Figure 2i. II Level
III Level
1
IV Level
I Level 1
Membership degree
Membership degree
I Level
0.8 0.6 0.4 0.2
III Level
0.6 0.4 0.2 0
0 0.004 0.008 0.012 0.016 0.02 Chloride concentration (% by the mass of concrete )
-3
0
3 6 9 12 15 18 21 24 27 30 Delamaination area (% of the whole component area)
(a) II level
(b) I level 1
IV level
III level
Membership degree
Membership degree
I level 1 0.8 0.6
0.4 0.2
II level
0.6 0.4 0.2 0
0
0.03 0.06 0.09 0.12 0.15 0.18 0.21 0.24 0.27 0.3 Crack width(mm)
-30
0
30
60
90
120 150 180 210 240 270 300 Crack depth(mm)
(c) II level
(d) III level
IV level
Memebership degree
Memebership degree
I level 1 0.8 0.6 0.4 0.2
I level 1
II level
III level
IV level
0.8 0.6 0.4 0.2
0 -3
IV level
III level
0.8
0 -0.03
IV Level
0.8
0 -0.004
II Level
0 0 3 6 9 12 15 18 21 24 27 Crack area (% of the whole component area)
30
-3
0
3
6
9
12
15
18
21
24
Reinforcement exposed percentage (%)
(e)
(f)
848
27
30
33
Civil Engineering Journal
II level
III level
IV level
IV level 1
Membership degree
Membership degree
I level 1
Vol. 4, No. 4, April, 2018
0.8 0.6 0.4 0.2
(g)
II level
I level
0.8 0.6 0.4 0.2
0 -1
III level
0 0
1 2 3 4 5 6 7 8 9 10 Section loss percentage of reinforcement (%)
Membership degree
I level 1
100
280
460 640 820 Concete resistivity (Ω.m)
(h)
II level
III level
1000
IV level
0.8 0.6 0.4 0.2
0 0.1
0.28
(i)
0.46 0.64 0.82 Corrosion rate (μA/cm2)
1
Figure 2. Chloride concentration membership degree function
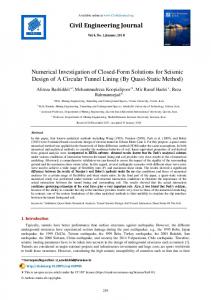
4. Steps of Fuzzy-AHP Method to Determine Corrosion Damage Index (CDI) The calculation steps of determining the corrosion damage level based on CDI using fuzzy-AHP mathematics are detailed herein and the flowchart is shown in Figure 3: 1) Determine the evaluation indicator set The corrosion indicator set is identified in Table 4: 𝑈 = {𝑢1 , 𝑢2 , 𝑢3 , 𝑢4 , 𝑢5 , 𝑢6 , 𝑢7 , 𝑢8 , 𝑢9 }, where to represent the nine corrosion indicators, respectively. 2) Determine the assessment level set The assessment level set is: 𝑉 = {𝑣1 , 𝑣2 , 𝑣3 , 𝑣4 }, where to represent the level I, level II, level III and level IV, respectively, given in Figure 2a to 2i. 3) Determine the weight factors of nine corrosion indicators The AHP method is used here to determine the weight factors of nine corrosion indicators 𝐴 = {𝑎1 , 𝑎2 , 𝑎3 , 𝑎4 , 𝑎5 , 𝑎6 , 𝑎7 , 𝑎8 , 𝑎9 } , where A is the weight factor set: to represent the weight factors related to the nine corrosion indicators. Rather than prescribing a ‘correct’ decision, the AHP method helps decision makers find one that best suits their goal and their understanding of the problem. The basic principle of AHP is to make the complex decision making problem hierarchically, then rank the degree of association of each criterion relative to the others, using the scale of association from 1 to 9 as shown in Table 6. Table 6. The scale of comparison decision matrix scale and their meanings Scale
Meaning
1
Equal importance
3
Moderate importance, former moderately important than latter
5
Strong importance, former important than latter
7
Very strong importance, former very strongly important than latter
9
Extreme importance, former extremely important than latter
2, 4, 6, 8
Intermediate values, the median value of above judgment:1-3, 3-5, 5-7, 7-9 If the ratio of the importance between element 𝑖 and element 𝑗 is 𝑏𝑖𝑗 (any value between 1-9), the ratio
Reciprocal
of the importance between element 𝑗 and element 𝑖 is 𝑏𝑗𝑖 =
1 𝑏𝑖𝑗
Notes: ‘former’ and ‘latter’ means there are two criteria which will compare with each other, one of them should be chosen as basic one-former, another is the comparative-latter
849
Civil Engineering Journal
Vol. 4, No. 4, April, 2018
4) Determine the fuzzy evaluation matrix For each objective evaluation goal, the relationship between the evaluation elements and the evaluation level, i.e., the fuzzy relation between 𝑈 and 𝑉 can be represented by the fuzzy evaluation matrix, 𝑅 as follows:
r11 r 21 r31 r41 R r51 r61 r 71 r81 r 91
r12 r22 r32 r42 r52 r62 r72 r82 r92
r13 r23 r33 r43 r53 r63 r73 r83 r93
r14 r24 r34 r44 r54 r64 r74 r84 r94
(7)
Where 𝑟𝑖𝑗 (𝑖 = 1, 2, … , 4; 𝑗 = 1, 2, … , 9) represent the membership degree of objective evaluation goal belonging to level vi based on the value of indicator element 𝑢𝑖 . All the membership functions are proposed previously from Figure 2a to 2i. 5) Calculate the comprehensive evaluation result The results of evaluation can be gotten through multiplying the vector of the index weight-𝐴 and the fuzzy evaluation matrix-𝑅. The equation is as follows:
r11 r 21 r31 r41 B A R a1 , a2 , a3 , a4 , a5 , a6 , a7 , a8 , a9 r51 r61 r 71 r81 r 91
r12 r22 r32 r42 r52 r62 r72 r82 r92
r13 r23 r33 r43 r53 r63 r73 r83 r93
r14 r24 r34 r44 r54 r64 r74 r84 r94
(8)
Where means fuzzy complex operations calculation, Table 7 lists four common fuzzy complex operations calculation types, the fourth type will be used in this paper; 𝐴 is the weight factor set decided by AHP method in step 3; 𝑅 is the fuzzy evaluation matrix determined in step 4. Table 7. Common types of fuzzy complex operations calculation Types I II III IV
, , , ,
Operator Meaning
a b min a, b a b a b a b min a, b a b a b
a b max a, b a b max a, b a b min a b,1 a b min a b,1
6) Using the asymmetric nearness degree method Because the fuzzy evaluation vector 𝐵 calculated by the typical fuzzy theory method is a fuzzy subset, which is a set of membership values corresponding to assessment levels. The vector shows the distribution of the value to all the assessment levels, with each value in the evaluation result vector representing the membership degree belonging to each assessment level. The nearness degree theory [25] will be used to re-analyze the vector 𝐵 and make the structure’s corrosion damage level more clear to decide the value of CDI.
850
Civil Engineering Journal
Vol. 4, No. 4, April, 2018
Determine the evaluation indicator set-𝑈
Determine the assessment level set- 𝑉
Determine the weight factors- 𝐴
Determine the fuzzy evaluation matrix-𝑅
Calculate the comprehensive evaluation result- 𝐵
Figure 3. The flowchart of fuzzy-AHP method
5. Final Simple Corrosion Index Calculation In this paper, calculation of SCI includes consideration of CDI, ECF and MVF. Inclusion of ECF and MVF is to account for the influence exerted by these two factors on the future progression of corrosion conditions. However, ECF and MVF are qualitative and subjective indicators that are different from CDI’s quantitative indicators; therefore, the fuzzy theory cannot be used to deal with ECF and MVF. Furthermore, the importance of ECF and MVF is less when compared with CDI to decide the current corrosion damage level of the structure. In this paper, the classification of environment exposure and the material vulnerability are derived from those mentioned in [5, 27]. Figure 4 depicts SCI calculation scheme. Corrosion Damage Index CDI (1-4)
Environmental Change Factor ECF (0-4)
Material Vulnerability Factor MVF (1-4)
Simplified Corrosion Index SCI (0-4)
Figure 4. The simplified corrosion index 5.1. Importance of CDI, ECF and MVF
Based on the procedures of AHP method, the pair-comparison matrices for CDI, ECF and MVF are presented. CDI is much more important influence indicator than ECF and MVF to decide the SCI value, so the scores of 5 and 7 are applied. ECF is moderately important compared with MVF, when the score of 3 is applied. The final pair-comparison matrix and the weight factor result are shown in Table 8. Table 8. Pairwise comparison of CDI, ECF and MVE Indicators
CDI
ECF
MVF
Importance
CDI
1
5
7
0.7235
ECF
1/5
1
3
0.1932
MVF
1/7
1/3
1
0.0833
The consistency of pairwise comparison matrix should be tested, but perfect consistency rarely occurs in practice. In the AHP, the pairwise comparisons in a judgment matrix are considered to be adequately consistent if the corresponding consistency ratio (CR) is less than 10% according to Saaty [21]. The CR coefficient is calculated as follows. Firstly, the consistency index (CI) needs to be estimated. This is done by adding the columns in the judgment matrix and multiply the resulting vector by the vector of priorities (i.e., the approximated eigenvector) obtained earlier. This yields an approximation of the maximum eigenvalue, denoted by 𝜆𝑚𝑎𝑥 . Then, the CI value is calculated by using the formula:
(9)
𝐶𝐼 = (𝜆𝑚𝑎𝑥 − 𝑛)/(𝑛 − 1) Where 𝑛 is the dimension of pairwise comparison matrix.
Next, the consistency ratio CR is obtained by dividing the CI value by the Random Consistency index (RCI) as given in Table 9. 𝐶𝑅 =
𝐶𝐼 < 0.1 𝑅𝐶𝐼
(10)
851
Civil Engineering Journal
Vol. 4, No. 4, April, 2018
Consistency of the pair-comparison, 𝜆𝑚𝑎𝑥 = 3.0649, 𝐶𝐼 = (𝜆𝑚𝑎𝑥 − 3)/2 = 0.03245, 𝐶𝑅 = 𝐶𝐼/𝑅𝐶𝐼 = 0.056 < 0.1, so the consistency is satisfied. Table 9. RCI value for different values of n n
1
2
3
4
5
6
7
8
9
10
RCI
0
0
0.58
0.90
1.12
1.24
1.32
1.41
1.46
1.49
The weight factor can be calculated with the characteristic root method indicated in [21] as follows:
ai
b 1 bi1 ( n ... n in ) n b j1 bin j 1
(i 1,.., n)
(11)
j 1
Where 𝑎𝑖 is the weight factor corresponding to each corrosion indicator introduced in Table 4; 𝑏𝑖𝑗 is the corresponding element in pairwise comparison matrix, meaning the relative weight between attribute𝑖 as compared to attribute 𝑗, 𝑛 is the dimension of pairwise comparison matrix. 5.2. Proposed Formula Used to Calculate SCI
After the values of CDI, ECF and MVF were obtained, the final SCI is calculated by using the formula:
SCI w1 * CDI w2 * ECF w3 * MVF , Where w1 , w2 and
SCI 0,4
(12)
w3 are the weight factors of CDI, ECF and MVF, respectively.
As mentioned in the section on background in this paper, the corrosion process is classified into four levels corresponding to the following criteria: 0-1-No corrosion; 1-2-Low corrosion; 2-3-Moderate corrosion; 3-4-High corrosion.
6. Numerical Example Consider a reinforced concrete bridge deck, where the environment exposure is assumed to be the marine environment, which means the value of EA is 4. An artificial set of inspection data is as follows: chloride concentration is 0.01%, delamination area is 15.6% of total area, crack width is 0.156 mm, crack depth is 45 mm, crack area is 13.5%, bar exposed is 9%, bar section loss is 6.5%, concrete resistivity is 570 Ω.m, and corrosion rate is 0.57 𝜇𝐴/𝑐𝑚2 . Using this set of data, the numerical computational procedure is illustrated as follows. 1) AHP method to decide the weight factors of nine indicators The 1 to 9 scales method in Table 6 is used to determine the relative importance between each pair of corrosion indicators. For example, corrosion rate and chloride concentration should be direct and very important indicator to check the structure corrosion damage level. Therefore, the importance of these two indicators should be equal and the score 1 is applied. Although the concrete resistivity correlates with the corrosion rate, it is not the determining factor to define or prevent a potential damage to the structure [5]. The concrete does influence the future corrosion damage. Therefore, chloride concentration could be given a score of 6 relative to concrete resistivity. Other indicators, like delamination area, crack condition, and rebar’s condition, should be more important than concrete resistivity indicator, but less important than corrosion rate and chloride concentration. The score of 2 is given when chloride concentration is compared with bar exposure area and bar section loss. The score of 4 is given when chloride concentration is compared with crack width, crack depth, and crack area. The chloride concentration is important when compared with delamination area. Thus, a score of 6 is assigned. Using the same procedure and method of reasoning, all elements in the pairwise comparison matrix, 𝑅𝐴 can be determined based on the relative importance between each pair of indicators.
852
Civil Engineering Journal
1 1 6 1 4 1 4 RA 1 4 1 2 1 2 1 6 1
6 4 4 4 1 13 13 13 3 1 1 1 3 1 1 1 3 1 1 1 5 3 3 3 5 3 3 3 1 12 12 12 7 2 2 2
Vol. 4, No. 4, April, 2018
2 15 13 13 13 1 1 15 2
2 15 13 13 13 1 1 15 2
1 1 7 1 2 1 2 1 2 1 2 1 2 1 6 1
6 1 2 2 2 5 5 1 6
(13)
The consistency of matrix (13) can be checked as following:
max 9.2077 , CI 0.0260 , CR 0.018 0.1 It appears that the consistency of the pairwise comparison matrix is satisfactory, which means that the assigned relative importance of each pair of indicators is reasonable. The result after calculation is given below:
A a1, a2 , a3 , a4 , a5 , a6 , a7 , a8 , a9 {0.2364,0.0278,0.0666,0.0666,0.0666,0.1532,0.1532,0.0319,0.1976}. 9
Where 𝐴 is the weight factor set, which should satisfy ai 1 .
i1
2) Determine the fuzzy evaluation matrix Using the example inspection data and trapezoidal membership functions, the fuzzy evaluation matrix R introduced in Section 4 can be determined. All the values are calculated by using Figure 1 for each indicator and they are summarized in Table 10. Table 10. Fuzzy Evaluation Matrix 𝒗𝟏
𝒗𝟐
𝒗𝟑
𝒗𝟒
Level I
Level II
Level III
Level IV
𝑢1 chloride concentration
0
0.5
0.5
0
𝑢2 delamination
0
0.4
0.6
0
𝑢3 crack width
0
0.4
0.6
0
𝑢4 crack depth
0.25
0.75
0
0
Indicators
𝑢5 crack area
0
0.75
0.25
0
𝑢6 reinforcement exposed
0
1
0
0
𝑢7 reinforcement section loss
0
0
1
0
𝑢8 concrete resistivity
0
0.611
0.389
0
𝑢9 corrosion rate
0
0.389
0.611
0
3) Calculate the evaluation result using Equation 8:
B A R 0.0167,0.5055,0.4779,0 4) Apply asymmetric nearness degree method to analyse the evaluation vector 𝐵 The procedures involved are detailed herein: First, the vector B should be standardized using the following equations:
B j cdi j , cdi j 1 , cdi j 1 , cdi j 2 , cdi j 2 ,...
(14)
So,
B1 0.0167,0.5055,0.4779,0
853
Civil Engineering Journal
Vol. 4, No. 4, April, 2018
B 2 0.5055,0.0167,0.4779,0 B 3 0.4779,0.5055,0.0167,0 B 4 0,0.4779,0.5055,0.0167 For any fuzzy evaluation vector-𝐵, the nearness degree should be calculated with the optimization object. For example, the nearness degree of 𝑁(𝐵1 , 𝐷1 ) of 𝐵1 and 𝐷1 = {1 0 0 … 0} can be checked by the following equation: 𝑁(𝐵1 , 𝐷1 ) = 1 −
1 𝑚(𝑚+1)
𝑝 𝑝 ∑𝑚 𝑘=1 |𝑏𝐵 (𝑣𝑘 ) − 𝑑𝐷 (𝑣𝑘 )|𝑘 , P=1,2,… k=1,2,3,4
(15)
Where 𝐷1 = {1 0 0 … 0} is called the optimized object of the assessment level 𝒗𝟏 ; 𝐷1 = {0 … 1 … 0} is called the optimized object of 𝑣𝑗 for universal type; 𝑏𝐵𝑝 (𝑣𝑘 ) is the membership degree of B1’s item belonging to 𝑣𝑘 , i.e., the 𝑘 𝑡ℎ 𝑝 item of vector B1; 𝑑𝐷 (𝑣𝑘 ) is the 𝑘 𝑡ℎ item of vector D1; m is the dimension of vector B1; P is suitable real number, which is chosen as 1. Because the vector 𝐵 has been standardized by Equation 15, the final nearness degree of the vector B with each corrosion damage level 𝑣𝑗 can be obtained as follows:
N B, D j N B j , D1
(16)
Then
N B, D1 0.8286
N B, D N B , D 0.9200 N B, D N B , D 0.8238 N B, D2 N B 2 , D1 0.9019 3
3
1
4
4
1
Therefore, 𝑁(𝐵, 𝐷𝑗 ) = max |𝑁(𝐵, 𝐷𝑗 )| means the evaluation result relatively belongs to level 𝑣𝑗 . Based on above 𝑗𝜖𝑚 results of calculation, 𝑁(𝐵, 𝐷3 ) is the largest one; therefore, the final corrosion damage assessment level is level III, which means the value of CDI is 3. If the judgment is decided on the result of fuzzy set B directly, the value of CDI is 2. 5) Calculate the final corrosion index result-𝑆𝐶𝐼 Based on environment expose and the material, the ECF and MVF values for this bridge structure are 4 and 2, respectively. The value of CDI obtained in Step 5 is 3 and the weight of ECF, MVF and CDI is shown in the last section. Calculating the evaluation result by Equation 12:
SCI w1 * CDI w2 * ECF w3 * MVF 0.7235 * 3 0.1932 * 4 0.0833 * 2 3.1099 So, the final condition for this bridge structure is considered to have a classification of high corrosion damage, therefore intervention process is needed urgently.
7. Conclusion The Fuzzy theory and AHP were utilized in this paper to develop a useful tool for determining the corrosion damage condition of a reinforced concrete bridge superstructure based on corrosion indicators with fuzzy boundary value between different levels. AHP method was used to help determine weight factors for different indicators relative to the determination of the final corrosion condition. Using the multiple indicators to identify the corrosion damage level is in itself fuzzy. Combining the AHP theory into the fuzzy comprehensive evaluation method was demonstrated to be a very effective method for the decision-maker to insert his/her judgment based on the experiences and preferences. It should be pointed out that experiences and opinions of experts are still needed in the use of AHP method to determine the weight factors; therefore, it can reflect expert’s or agencies’ practice preferences. However, AHP method can reduce the influence of certain expert’s mistakes in the judgment by using pairwise comparison method. After calculating the evaluation vector with the procedures of the Fuzzy-AHP method, which is still a fuzzy set, the asymmetric nearness degree method is used to re-analyze the fuzzy evaluation vector. Then, the final and more accurate CDI value can be obtained. The SCI can be calculated by combining the weighted ECF, MVF and CDI, the quantitative corrosion condition assessment of a reinforced concrete bridge superstructure. An illustrative numerical example is presented to show the different judgment results of CDI based on the same inspection data before and after using the asymmetric
854
Civil Engineering Journal
Vol. 4, No. 4, April, 2018
nearness degree method. The final value of SCI for the numerical example shows that the bridge structure is in high corrosion condition. The key problem of using the fuzzy method to solve the diagnostic problem is the selection of the membership functions. The proposed Fuzzy-AHP, together with the asymmetric nearness degree method, shows promise in dealing with decision making issues pertaining to corrosion damage level assessment.
8. References [1] Gao Z.C., Liang Y. R., Anil K. P., Effects of sustained loading and pre-existing cracks on corrosion behavior of reinforced concrete slabs, Construction and Building Materials, 2016, 124: 776-785. doi: 10.1016/j.conbuildmat.2016.08.010. [2] Gao Z.C., Liang Y. R., Anil K. P., Probabilistic lifetime performance and structural capacity analysis of continuous reinforced concrete slab bridges, International Journal of Advanced Structural Engineering, 2017, 9: 231-245. doi:10.1007/s40091-0170160-2. [3] Gao Z.C., Corrosion damage of reinforcement embedded in reinforced concrete slab. The University of Akron, 2016. [4] Callister W. D. and Rethwisch D. G. Material Science and Engineering, an Introduction, 9th Edition, WIliey 2014. ISBN-13: 9781118324578. [5] CONTECVET IN30902I, A validated users’ manual for assessing the residual service life of concrete structures: manual for assessing corrosion-affected concrete structures. EC innovation program. Report number IN309021, 2000. URN: urn:nbn:se:ri:diva-3092. [6] Fazal I, Decision support system for bridge maintenance. Western Michigan University, 2005. [7] Yehia S, Abudayyeh O, Fazal I, Randolph D, A decision support system for concrete bridge deck maintenance. Advances in Engineering Softerwave, 2008, 39, 202-210. doi: 10.1016/j.advengsoft.2007.02.002. [8] American Association of State Highway and Transportation Officials. (AASHTO). AASHTO LRED bridge design specifications,8th Edition. Washington, D.C. ISBN: 978-1-56051-654-5. [9] American Concrete Institute (ACI) 224R-01, Building Code Requirements for Structural Concrete and Commentary, ACI committee, 2008. ISBN: 978-0-87031-056-0. [10] American Concrete Institute (ACI) 201.2rR, Guide to Durable Concrete, ACI committee, 2008. ISBN: 9780870312847. [11] Zadeh LA, Fuzzy sets. Inform Control, 1965, 8(3), 338-53. doi: 10.1016/S0019-9958(65)90241-X. [12] Zadeh LA, Fuzzy Algorithms. Inform Control, 1968, 12, 94-102. doi: 10.1016/S0019-9958(68)90211-8. [13] Zadeh LA, Fuzzy sets as a basis for a theory of possibility. Fuzzy Sets System, 1978, 1(1), 3-28. doi: 10.1016/S01650114(99)80004-9. [14] Prakash C., Barua M.K.. Flexible modelling approach for evaluating reverse logistics adoption barriers using fuzzy AHP and IRP framework. International Journal of Operational Research. 2017, 30. doi: 10.1504/ijor.2017.086523. [15] Deng Y., Fuzzy analytical hierarchy process based on canonical representation on fuzzy numbers. J. Computational Analysis and Applications. 2017, 22-2, 201-228. [16] X. Zhang, Y. Deng, F. T. Chan, S. Mahadevan, A fuzzy extended analytic network process-based approach for global supplier selection. 2015, Applied Intelligence 43, 760-772. doi: 10.1007/s10489-015-0664-z. [17] W. Jiang, Y. Luo, X. Qin, J. Zhan, An improved method to rank generalized fuzzy numbers with different left heights and right heights, Journal of Intelligent & Fuzzy Systems 28, 2015, 2343–2355. doi: 10.3233/ifs-151639. [18] A. Mardani, A. Jusoh, E. K. Zavadskas, Fuzzy multiple criteria decisionmaking techniques and applications - two decades review from 1994 to 2014, Expert Systems with Applications 42, 2015 4126–4148. doi: 10.1016/j.eswa.2015.01.003. [19] Saaty T.L., A Scaling Method for Priorities in Hierarchical Structures, Journal of Mathematical Psychology, 1977, 15, 57-68. doi: 10.1016/0022-2496(77)90033-5. [20] Saaty T.L., Fundamentals of Decision Making and Priority Theory with the AHP. RWS Publications, Pittsburgh, PA, U.S.A, 1994. ISBN-13: 978-0962031762. [21] Saaty T.L., The Analytic Hierarchy Process. McGraw-Hill International, New York, NY, U.S.A, 1980. [22] Saaty T.L., Decision making with the analytic hierarchy process, Int. J. Services Sciences, 2008, 1(1), 83-98. doi: 10.1504/ijssci.2008.017590. [23] Andrade C., Martinez. I., Use of indices to assess the performance of existing and repaired concrete structures. Construction and Building Materials. 2009, 23, 3012-3019. doi: 10.1016/j.conbuildmat.2009.04.009. [24] Deng X., Hu Y., Deng Y., Mahadevan S., Supplier selection using AHP methodology extended by D numbers, Expert Systems with Applications 41, 2014, 156–167. doi: 10.1016/j.eswa.2013.07.018. [25] Wang P., Fuzzy set theory and its application [M]. Shanghai, Shanghai science and Technology Press, 1983, 57-59.doi: 10.1007/978-1-4684-3848-2.
855
Civil Engineering Journal
Vol. 4, No. 4, April, 2018
[26] EN 206, Concrete—Part 1: specification, performance, production and conformity, 2000. ICS:91.100.30. [27] Rashidi M., Lemass, B., A Decision Support Methodology for Remediation Planning of Concrete Bridges, KICEM Journal of Construction Engineering and Project Management, 2011, 1(2), 1-10. doi: 10.6106/jcepm.2011.1.2.001. [28] Manual of Bridge Inspection, OHIO Department of Transportation, 2010. [29] Zhao J., Bose B.K., Evaluation of Membership Functions for Fuzzy Logic Controlled Induction Motor Drive, IEEE, 2002. doi: 10.1109/iecon.2002.1187512 . [30] American Concrete Institute (ACI), Protection of Metals in Concrete Against Corrosion, ACI committee 222, ACI 222R-01, 2008. ISBN: 9780870310607. [31] Sohanghpurwala A.A., NCHRP Report 558: Manual on Service Life of Corrosion-Damaged Reinforced Concrete Bridge Superstructure Elements, Transportation Research Board, National Research Council, Washington, D.C., 2006. doi: 10.17226/13934. [32] Gucunski N., Imani A. Francisco Romero Soheil Nazarian Deren Yuan Herbert Wiggenhauser, Parisa Shokouhi, Alexander and Taffe Doria Kutrubes., Nondestructive Testing to Identify Concrete Bridge Deck Deterioration , Strategic Highway Research Program report SHRP 2 Renewal project R06A, Transportation Research Board: Washington, DC, 2011.doi: 10.17226/22771.
856