Available online at www.CivileJournal.org
Civil Engineering Journal Vol. 4, No. 2, February, 2018
Relations between Texture Coefficient and Energy Consumption of Gang Saws in Carbonate Rock Cutting Process A. Dormishi a, M. Ataei a, R. Mikaeil b*, R. Khalokakaei a a b
Faculty of Mining, Petroleum & Geophysics, Shahrood University of Technology, Shahrood, Iran.
Department of Mining and Metallurgical Engineering, Urmia University of Technology, Urmia, Iran. Received 10 January 2018; Accepted 27 February 2018
Abstract Texture coefficient is one of the most influential parameters in rock engineering specifications in various projects including drilling, cutting, permeability of all-section drilling devices, etc. Meanwhile, investigating and forecasting the energy consumption of saw cutters are one of the most important factors in estimating the cutting costs. The present study aims to investigate the relationship between rock texture characteristics and the amount of energy consumption of the gang saw machine in the process of cutting carbonate rocks. To evaluate the effects of texture on the rocks' engineering specifications, 14 carbonate rock samples were studied. A microscopic thin section was made from each rock specimen. Then, five digital images were taken from each section under a microscope and the values of area, environment, the largest diameter and the smallest diameter of all grains in each image were determined. Using these specifications, the coefficient of texture of all rock samples was calculated and the relationship between the texture coefficient and the rate of energy consumption of the gang saw machine was investigated for the studied samples. The study results indicated that there was a significant relation between the texture coefficient and energy consumption rate in the three groups of carbonate rocks. Keywords: Energy Consumption; Gang Saw Machine; Texture Coefficient; Rock Engineering Specifications.
1. Introduction In many texts written about the mineralogy and lithology, there are many different ways to diagnose and describe the texture of a rock. Quality description of a rock may not work in texture engineering problems. So, drilling engineers have always been looking for a way to quantify the texture properties of a rock. In texture quantity description, some parameters are required to evaluate the texture of rocks. Some of them are basic parameters, including perimeter, area, large diameter, and small diameter; however, parameters like equivalent diameter, compactness, grain status ratio, shape factor, locking index, and particle size uniformity index are obtained according to the basic information. The texture coefficient can be used as a predictive tool for the assessment of drillability and rock strength properties. The texture coefficient describes grain-shape, orientation, degree of grain interlocking and relative proportion of grain and matrix. Measures of mechanical rock performance i.e. rock strength and, percussion and diamond drilling rates have statistically and highly significant correlations with the texture coefficients [1]. The drillability and cuttability, and mechanical and wear performance of rocks were studied by Ersoy and Waller based on predictive factors from rock texture. It was found out that rock texture could be used as a predictive tool for evaluating mechanical performance, drillability, cuttability and wear performance of the rocks [2]. The relationships between petrographical and engineering properties of granitic rocks were investigated by Tugrul and Zarif. It was determined * Corresponding author:
[email protected] http://dx.doi.org/10.28991/cej-0309101 This is an open access article under the CC-BY license (https://creativecommons.org/licenses/by/4.0/). © Authors retain all copyrights.
413
Civil Engineering Journal
Vol. 4, No. 2, February, 2018
that the average of grains affected the strength of rock, so that with the increase of rock strength, the mean grain was reduced [3]. In a study conducted by Singh et al., the neural networks were used for the prediction of uniaxial compressive strength, tensile strength and axial point load strength simultaneously from the mineral composition and textural properties. The network was trained to predict the uniaxial compressive strength, tensile strength and axial point load strength from the mineralogical composition, grain size, aspect ratio, form factor, area weighting and orientation of foliation planes (planes of weakness). It was found out that the neural network models of all three strengths were simulated simultaneously, but this is not possible in statistical predictions [4]. In a research conducted by Thuro and Plinninger, the possibilities to quantify key parameters of mass excavatability in drilling, blasting and cutting by TBM and road headers were explored [5]. The effect of the textural properties of rocks on their crushing feature, the distribution of particle size, the texture, grinding and crushing was investigated by Kekec et al.; then, the statistical methods were used and the relations between the textural properties and the physical and mechanical features of rocks were determined. It was found out that, there were several parameters that affected the properties of crushing and grinding, but some parameters, such as rocky texture had no significant effect on shape and volume, or that the content of minerals had a significant effect on the distribution of particle size discharged from the crusher and the amount grinding [6]. In a study conducted by Hoseinie et al. a new classification system was developed for specifying the rock mass drillability index (RDi). Six parameters of the rock mass were investigated for RDi (including texture and grain size, Mohs hardness, uniaxial compressive strength (UCS), joint spacing, joint filling (aperture) and joint dipping). It was determined that as drilling distance increased in rocks, drilling rate increased logarithmically and also increased with increasing drilling rates. And by increasing the relative angle between the surfaces of the joint and directional drilling, drilling penetration rate increased linearly [7]. In their study, Alber and Kahraman predicted the uniaxial compressive strength and elastic modulus of a fault breccia from the texture coefficient developed by Howarth and Rowlands. It was found out that there was a strong relationship between uniaxial compressive strength and texture coefficient [8]. In another study conducted by Yilmaz et al., the correlations between a single parameter of rock texture (percentage mineral content and grain size) and mechanical properties of various granites were investigated. It was determined that there was a negative relationship between the mean size of quartz grains and uniaxial compressive strength. The correlation between k-feldspar is more than the solidness of other minerals forming rock [9]. In the research of Ghaysari et al, the prediction of production rate in diamond wire saw was investigated based on the texture characteristics of rock [10]. The relationship between the mineralogical and textural properties in quartzites, granitoids, gneisses, metabasics and dolomite rocks was studied by Tandon and Gupta [11]. The relation between the textural and mechanical properties of rock was reviewed by Ozturk and Nasuf [12]. The Grain/matrix ratio (GMR) was calculated by Korkanç and Solak using the ratios of phenocrysts, microlites, volcanic glass, voids and opaque minerals after point counting on thin sections. Therefore, it was attempted to determine the potential relationship between the petrographic and geomechanical properties of fresh samples by counting correlation analysis. It was found out that there was a reasonable relation between plagioclase, GMR, void and geomechanical properties in Kızılkaya tuffs samples [13]. In a study conducted by Yusof and Zabidi, the relationship between mineralogical characteristics and mechanical properties of rock was investigated. It was concluded that the average grain size had a direct impact on strength rock so that by decreasing the average size of the grain, the strength of the rock was also reduced. Except for this, one of the factors influencing the mineral strength of rock is the following: If the quartz frequency increases, stone strength increases too, but the presence of feldspars and mica reduces its amount [14]. In the study of Kahraman et al., the effects of textural properties of grains such as aspect ratio, roundness, and diameter on the LCPC abrasivity coefficient (LAC) were investigated for coarse-grained igneous rocks. The LAC was correlated with the abrasive mineral content (AMC) and a good correlation was found between the two parameters and secondly the textural properties of loosened materials had a strong influence on the tool wear. The results showed that in addition to AMC, the texture properties of grains had a great influence on the LAC and abrasive tools. In another result obtained when evaluating soft and soft materials, tissue properties such as roughness, diameter and aspect ratio have been investigated [15]. In another study, the strength properties such as rebound hardness, uniaxial compressive strength, rock tensile strength of multicomponent geomaterials, i.e., host-rocks and their enclaves, sampled both from quartz-rich (granitoid) and quartz-poor (syenitoid) massifs were investigated by Krmíek et al. It was found out that one of the factors affecting the overall strength of the rock was the presence of xenoliths. This factor of positive strength effect associated with the presence of microgranular enclaves increased from granitoid massifs towards syenitoid massifs [16]. In the study of Hoseinie et al., the relationship between quantitative parameters of the rock microfabric and the rate of top-hammer drilling was investigated [17]. Recently, some industrial and laboratory studies in the field of the energy consumption, wear prediction, production rate prediction have been done in dimensional stone cutting process with circular diamond saw and diamond wire saw. The vibration of machine saw during rock sawing was predicted by Mikaeil, et al. using the fuzzy analytical hierarchy process [18]. The relationship between the production rate of diamond wire saw and some important rock properties was investigated by Ataei et al. using statistical analysis [19]. A
414
Civil Engineering Journal
Vol. 4, No. 2, February, 2018
fuzzy analytical hierarchy process was developed by Ataei et al. to evaluate the sawability of dimension stone [20]. A prediction model was developed by Ghaysari et al. to evaluate the performance of diamond wire saw based on texture characteristic of carbonate rock [21]. The production rate of diamond wire saw was studied by Sadegheslam et al. using multiple nonlinear regression analysis and artificial neural network [22]. An artificial neural network was developed by Aryafar and Mikaeil based on rock properties and saw machine characteristic to estimate the ampere consumption of dimension stone sawing machine [23]. The performance of circular saw machine was investigated by Mikaeil et al. using imperialist competitive algorithm and fuzzy clustering technique [24]. A new rock classification system was developed by Almasi et al. based on the abrasiveness, hardness, and toughness of rocks and PA to predict the hard dimension stone sawability [25]. The wear performance of circular diamond saw was investigated by Akhyani et al. in hard rock cutting process using fuzzy rock engineering system (RES) and genetic algorithm (GA) [26]. Gang saws have been extensively used in dimension stone processing plants. The estimation of rock sawability is very important in the cost prediction and designing of the plants. Rock sawability depends on the gang saw characteristics, type of saw, rate of sawing and tool wear, and rock properties. Rock texture characteristic is one of the most important factors for evaluating the rock engineering indices such as strength, hardness, abrasiveness, etc. Also, consumed energy is a significant cost factor in carbonate rock cutting process. The present study aimed to investigate the relationship between rock texture characteristics and the amount of energy consumption of the gang saw machine in the cutting process of carbonate rocks. As far as the author know, predicting the energy consumption using the regression analysis based on texture coefficient is a unique research.
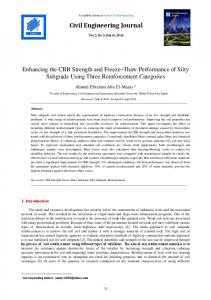
2. Research Methodology The present research takes the relationship between texture coefficient and energy consumption of gang saw using regression analysis. This paper is organized as follows. In first section, field and laboratory studies are done to perpetrate the stone block, sampling of studied stones and preparation of thin section. In the next step, texture coefficient is determined. Finally, after determining energy consumption of gang saw during cutting process, the relationship between texture coefficient and energy consumption is investigated using regression analysis. Figure 1. illustrates a flow chart of the operations performed in the current research paper. Start
Field and factory studies
Preparation of dimension stone block
Laboratory studies
Sampling of stone blocks
Preparation of thin section from stone samples
Determination of texture coefficient (TC)
Cutting of dimension stone slab with gang saw
Determination of energy consumption
Investigation of relationship between TC and energy consumption
Figure 1. Flowchart of study
3. Texture of Rocks Texture has a basic role in the engineering behavior of rocks which is associated with drilling machines, cutting structural stones, TBMs, and so on. Texture is one of the inherent characteristics of a rock. Rock texture is a parameter that is described qualitatively according to the size, shape, and matrix rate (grain to matrix ratio). In engineering works, the typical classification for the texture of rocks based on two factors of the size and shape of the grain is in four groups of grained, porphyry, glass, and destructive. The most specific texture in this division is grained texture which in igneous rocks, is divided into several subgroups according to the size of the grains, including very coarse with grains larger than 10 mm, coarse with grains of 5 to 10 mm, medium with grains of 2-5 mm, fine-grained with grains
415
Civil Engineering Journal
Vol. 4, No. 2, February, 2018
of 0.25 to 2 mm and very fine-grained with grains smaller than 0.25 mm. The parameters effective in the evaluation of rock texture include area, perimeter, larger diameter, smaller diameter, equivalent diameter, compactness, shape factor, grain status ratio, locking, and uniformity of particles. Area is considered as the simplest parameter in evaluation of rock texture. This characteristic is equal to the mean surface area of the grains in the thin section. The grain perimeter represents the length of the grain boundary in the rock, or mathematically, perimeter of the grain. Larger diameter and smaller diameter are of the most widely used quantitative parameters of texture, mathematical composition of which is geometrically representative of various properties of grains and rock texture. Diameter equivalent (Dequi): This parameter presents grain size. It is determined by below equation [27]: 4 Ai Dequi = √ π
(1)
Where Dequi is diameter equivalent (mm), Ai is Area of grain (mm2). Compactness (C): This parameter is as shape of section in grain. It is calculated by below equation L2P Ai Where C is compactness, Lp is perimeter of grain (mm).
(2)
C=
Shape factor (SF): This parameter is as amount of round of section in grain. It is calculated by below equation: 4πAi L2p Aspect ratio (AR): It is calculated by dividing maximum diameter to minimum diameter.
SF =
Dmax Dmin Where Dmax is maximum diameter (mm) and D min is minimum diameter (mm). AR =
(3)
(4)
Interlocking index (g): at first, this index was presented by Dreyer in 1973. In fact this parameter shows relation between area of grain and part of perimeter that is neighbor with other grain. Actually this index explains complexity of relation between grains. To obtain this index, below equation was presented: g=
Lpi 1 ∑ n √Ai
(5)
Grain size homogeneity index (t): This index was presented by Dreyer in 1973. It is introduced as explanation of distribution grain packing in texture of rock. Below equation was presented to obtain index of grain size homogeneity: t=
Aave
(6)
√∑(Ai − Aave )2
Where Aave is Average of area of grains (mm2). Texture coefficient: The method of quantitative analysis of geometrical properties of rock particles or rock texture comprises the following component: a. To measure and analyze grain shape. b. To measure and analyze grain elongation (to calculate shape factor and aspect ratio). c. To measure and quantify grain angle (orientation). d. To calculate total grain area to total references area (including matrix) or weighting factors based on the degree of grain packing. The results can be derived from the following formula which was suggested by Howarth and Rowlands in 1987 [1]: N0 1 N1 TC = AW[{ × }+{ × AR1 × AF1 }] N0 + N1 FF0 N0 + N1 Where, TC: texture coefficient, N0: Number of grains with aspect ratio less than 2, N1: Number of grains with aspect ratio greater than 2, FFo: Arithmetic mean of shape factor of all N0 grains,
416
(7)
Civil Engineering Journal
Vol. 4, No. 2, February, 2018
AR1: Arithmetic mean of aspect ratio of N1 grains, AF1: Angle factor orientation which were computed for all N1 grains, AW: Area weighting (grain packing density), which calculated: AW =
Total grain area within reference are boundary Total area enclosed by the reference area boundary (including matrix area)
Angle factor is defined as angle between the maximum diameter and horizon. The maximum value of angle is 180°. Angular orientation of grains was quantified by the development of the angle factor. This factor was only calculated for elongated grains where their aspect ratio was greater than 2. The angle factors AF1 has been calculated by a class weighted system applied to the absolute, acute angular differences (0° < β < 90°), between each and every elongated grain [1]. The angular differences are grouped into nine classes, each of which is weighted (Table 1). Table 1. Classes and weighting for absolute, acute angular differences [2] Number
Class range (β°)
Weighting (i)
1
0 < θDMAX ≤ 10
1
2
10 < θDMAX ≤ 20
2
3
20 < θDMAX ≤ 30
3
4
30 < θDMAX ≤ 40
4
5
40 < θDMAX ≤ 50
5
6
50 < θDMAX ≤ 60
6
7
60 < θDMAX ≤ 70
7
8
70 < θDMAX ≤ 80
8
9
80 < θDMAX ≤ 90
9
The angle factor has been calculated by summing of the class weighting and fractions of the total number of angular differences in each class. n
AF = ∑[ i=1
Xi ] N(N − 1) 2
(8)
Where, AF1: Angle factor, N: Total number of elongated grains, Xi: Number of angular differences in each class, I: Weighting factor and class number.
4. Investigation of Relationship between Texture Coefficient and Energy Consumption In this study it is aimed to evaluate the energy consumption of gang saw in carbonate rock cutting process. In order to investigate the relationship between energy consumption rate of saw cutting machine and texture characteristics of carbonate rock samples, field and laboratory studies were carried out. In the first section, sampling of ready-to-cut rock blocks was carried out at the processing plant in Mahallat city, Iran. The rock blocks were cut by diamond blades under constant operating conditions with a 50-blade saw cutting machine (Figure 2). Specifications of the saw cutting machine used are presented in Table 2.
Figure 2. Gang saw machine used in this study
417
Civil Engineering Journal
Vol. 4, No. 2, February, 2018
Table 2. Machine operating characteristics during performance studies Characteristic Blade run Cutting width Cutting length Cutting height Blade length Max. no. blades Main engine power Total weight of machine
Value 750 1440 3300 1950 4400 50 55 47
mm mm mm mm mm N Kw ton
A total of 8 rock samples were evaluated during the cutting process and the amount of energy consumed by the saw cutting machine during the cutting process was measured. Characteristics of the carbonate rocks samples under study along with energy consumed are shown in Table 3. Table 3. The studied rocks and energy consumption Samples n.
Commercial name
Name of quarry
Energy consumption (Ampere 8)
A1
Hajiabad Travertine
Hajiabad
83
A2
Chocolate Travertine
Chocolate Kashan
84
A3
Takab Travertine
Takab
83
A4
Harsin Marble
Harsin
95
A5
Kerman Marble
Mirzaei
93
A6
Ghorveh Marble
Ghorveh
89
A7
Laybid Marble
Laybid
91
A8
Aligodarz Marble
Aligodarz
90
The locations of studied quarries are given in Figure 3. The samples of stones which have been studied were collected from these quarries and transferred to laboratory.
A3
Takab A6 A1 Hamadan Markazi A4
Kermanshah A8
Lorestan
A2
A7
Isfahan A5
Kerman
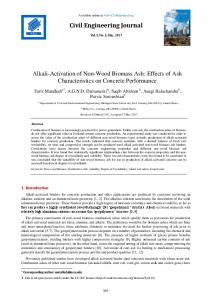
Figure 3. The location of studied rocks In the second section, rock samples from each rock block were transferred to the laboratory to provide microscopic thin sections. After preparing microscopic sections, digital images were taken from each section (Figure 4). Then, the texture characteristics of the studied rock samples were evaluated and calculated. The texture characteristics of the studied rocks including diameter equivalent (Dequi), Compactness (C), shape factor (SF), aspect ratio (AR), interlocking index (g), grain size homogeneity index (t) and texture coefficient (TC) are shown in Table 4.
418
Civil Engineering Journal
Vol. 4, No. 2, February, 2018
A6
A7
A8
Figure 4. Microscopic thin-section image of crystal rocks Table 4. Information obtained for all sections Samples n.
Dequi
C
SF
AR
g
t
TC
A1
0.248
18.234
0.689
2.4917
4.211
0.0482
2.524
A2
0.336
16.12
0.779
2.676
2.178
0.057
4.026
A3
0.14
18.61
0.675
2.55
3.19
0.052
3.225
A4
0.247
19.03
0.66
2.649
4.314
0.046
3.561
A5
0.273
12.21
1.029
2.474
2.459
0.066
3.196
A6
0.9026
16.35
0.769
3.159
1.401
0.0767
1.102
A7
0.818
18.68
0.672
2.528
1.384
0.1
3.008
A8
0.279
16.27
0.772
2.409
3.036
0.064
2.744
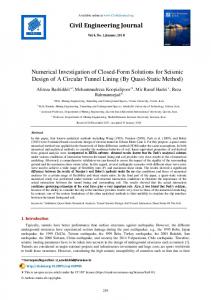
Energy consumption of gang saws and texture coefficient was considered using the method of least squares regression for three groups of studied rocks. Linear, logarithmic, exponential and power curve fitting approximations were tried and the best estimated equation with the highest correlation coefficient was selected for each regression. Figure 5. shows the relationship between energy consumption and texture coefficient for three groups of studied rocks. 96 y = 5.4795x + 75.488 R² = 1
94
Energy consumption (Ampere)
y = 2.069x + 85.968 R² = 0.6708 92
90 y = 0.8936x + 87.958 R² = 0.8516
88
86 y = 0.6796x + 81.119 R² = 0.7825
84
Travertine Cystal
82
Marble
80 1
1.5
2
2.5
3
3.5
4
Texture Coefficient
Figure 5. Relationship between energy consumption and texture coefficient
A good correlation between energy consumption and texture coefficient was found for marble group. The relation follows an exponential function. The determination coefficient (R2) of the model is higher than 0.85. This value is good. Energy consumption increases with increasing texture coefficient. The equation of the curve is: IM=87.975EXP(0.00099TC)
R2=0.854
(9)
The general relation for marble and crystal stones is as follows IM-C=86.111EXP(0.0226TC)
R2=0.68
(10)
419
Civil Engineering Journal
Vol. 4, No. 2, February, 2018
There is a significant correlation between energy consumption and texture coefficient for travertine group. The relation follows an exponential function. Energy consumption increases with increasing texture coefficient with determination coefficient 0.78. The equation of the curve is: It=81.151EXP(0.0081TC)
R² = 0.78
(11)
5. Conclusion In this paper, the relationship between the energy consumption of the gang saws machine and the texture coefficient as one of the most important quantitative characteristics was investigated in the carbonate rock samples. The results of the studies on three groups of carbonate rocks, including travertine, marble and crystal, showed that the amount of energy consumption increased with the increase of rock texture coefficient. This incremental trend followed an exponential function and indicated an acceptable correlation coefficient in the rock samples studied. Furthermore, the investigations revealed that the gradient of changes in energy consumption of the saw machine in marble and crystal rock samples was higher than that of travertine rocks under fixed operating conditions.
6. References [1] Howarth D.F., Rowlands J. C. “Quantitative Assessment of Rock Texture and Correlation with Drillability and Strength Properties“. Rock Mechanics and Rock Engineering, (January 1987), Volume 20, Issue 1, pp 57–85, doi: 10.1007/BF01019511. [2] Ersoy A., Waller M.D., “Textural characterization of rocks“. J. of Engineering Geology, (June 1995), Vol. 39, Issues 3-4, p. 123-136, doi: 10.1016/0013-7952(95)00005-Z. [3] Tugrul A., Zarif I.H. “Correlation of mineralogical and textural characteristics with engineering properties of selected granitic rocks from Turkey“. Engineering Geology 51 (1999), 303±317, doi: 10.1016/S0013-7952(98)00071-4. [4] Singh V.K., Singh D., Singh T.N. “Prediction of strength properties of some schistose rocks from petrographic properties using artificial neural networks“. International Journal of Rock Mechanics & Mining Sciences 38 (2001), 269–284, doi: 10.1016/S13651609(00)00078-2. [5] Thuro, K. Plinninger, R.J. “Hard rock tunnel boring, cutting, drilling and blasting: rock parameters for excavatability. Technology roadmap for rock mechanics“, South African Institute of mining and metallurgy, (2003), ISRM-10CONGRESS-2003212. [6] Kekec B., Unal M., Sensogut C. “Effect of the textural properties of rocks on their crushing and grinding features“. Journal of University of Science and Technology Beijing (October 2006), doi: 10.1016/S1005-8850(06)60079-0. [7] Hoseinie S.H., Aghababaei H., Pourrahimian Y. “Development of a new classification system for assessing of rock mass drillability index (RDi) “. International Journal of Rock Mechanics & Mining Sciences 45 (January 2008), 1–10, doi: 10.1016/j.ijrmms.2007.04.001. [8] Alber M., Kahraman S. “Predicting the uniaxial compressive strength and elastic modulus of a fault breccia from texture coefficient“. Rock Mech Rock Engng (2009), 42: 117–127, doi: 10.1007/s00603-008-0167-x. [9] Yilmaz N, Goktan R, Kibici Y. “Relations between some quantitative petrographic characteristics and Mechanical strength properties of granitic building stones“. International Journal of Rock Mechanics & Mining Sciences, 48 (2011), 506-513, doi: 10.1016/j.ijrmms.2010.09.003. [10] Ghaysari N., Ataei M., Sereshki F., Mikaeil R. “Prediction of performance of diamond wire saw with respect to texture characteristics of rock“. Arch. Min. Sci., Vol. 57 (2012), No 4, p. 887–900, doi: 10.2478/v10267-012-0058-6. [11] Tandon R, Gupta V. “The control of mineral constituents and textural characteristics on the petrophysical & mechanical (PM) properties of different rocks of the Himalaya“. Engineering Geology 153 (2013), 125–143, doi: 10.1016/j.enggeo.2012.11.005. [12] Ozturk C.A., Nasuf E. “Strength classification of rock material based on textural properties“. Tunnelling and Underground Space Technology 37 (2013), 45–54, doi: 10.1016/j.tust.2013.03.005. [13] Korkanç M., Solak B. “Estimation of engineering properties of selected tuffs by using grain/matrix ratio“. Journal of African Earth Sciences 120 (2016), 160-172, doi: 10.1016/j.jafrearsci.2016.05.008. [14] Yusof N.Q.A.M., Zabidi H. “Correlation of mineralogical and textural characteristics with engineering properties of granitic rock from Hulu Langat, Selangor“. Procedia Chemistry, 19 (2016), 975 – 980, doi: 10.1016/j.proche.2016.03.144. [15] Kahraman S., Fener M., Käsling H., Thuro K. “The influences of textural parameters of grains on the LCPC abrasivity of coarse-grained igneous rocks“. Tunnelling and Underground Space Technology 58 (2016), 216–223, doi:10.1016/j.tust.2016.05.011. [16] Krmíek L., Horák V., Kuboušková S., Petružálek M. “Behaviour of Multicomponent Geomaterials: Pilot Experimental Study in Rock Mechanics“. Procedia Engineering 191 (2017), 31 – 3, doi: 10.1016/j.proeng.2017.05.150.
420
Civil Engineering Journal
Vol. 4, No. 2, February, 2018
[17] Hoseinie S. H., Ataei M., Mikaeil R. “Effects of microfabric on drillability of rocks“. Bulletin of Engineering Geology and the Environment. (2017), doi: 10.1007/s10064-017-1188-z. [18] Mikaeil, R., Ataei, M., Yousefi, R. “Application of a fuzzy analytical hierarchy process to the prediction of vibration during rock sawing“, Mining Science and Technology (China), (2011), 21, 611–619, doi: 10.1016/j.mstc.2011.03.008. [19] Ataei, M., Mikaiel, R., Sereshki, F., Ghaysari, N. “Predicting the production rate of diamond wire saw using statistical analysis“. Arabian Journal of Geosciences. (2011), 5, 1289-1295, doi: 10.1007/s12517-010-0278-z. [20] Ataei, M., Mikaeil, R., Hoseinie, S. H., Hosseini, S. M. “Fuzzy analytical hierarchy process approach for ranking the sawability of carbonate rock“. International Journal of Rock Mechanics & Mining Sciences, (2012), 50, 83–93, doi: 10.1016/j.ijrmms.2011.12.002. [21] Ghaysari, N., Ataei, M., Sereshki, F., Mikaiel, R. “Prediction of Performance of diamond wire saw with respect to texture characterestic of rock“, Arch. Min. Sci., (2012), 57, 4, 887–900, doi: 10.2478/v10267-012-0058-6. [22] Sadegheslam, G., Mikaeil, R., Rooki, R., Ghadernejad, S., Ataei, M. “Predicting the production rate of diamond wire saw using multiple nonlinear regression analysis“, Geosystem engineering, (2013), 275-285, doi: 10.1080/12269328.2013.856276. [23] Aryafar A. and Mikaeil R., “Estimation of the Ampere Consumption of Dimension Stone Sawing Machine Using the Artificial Neural Networks“, Int. J. Min. & Geo-Eng. Vol.50, No.1, (June 2016), pp.121-130, doi: 10.22059/ijmge.2016.57861. [24] Mikaeil R., Shaffiee Haghshenas S., Shaffiee Haghshenas S., M. Ataei, “Performance Prediction of Circular Saw Machine Using Imperialist Competitive Algorithm and Fuzzy Clustering Technique“. Neural Computing and Applications, (2016), doi: 10.1007/s00521-016-2557-4. [25] Almasi SN., Bagherpor R., Mikaeil R., Ozcelick Y., “Developing a new rock classification based on the abrasiveness, hardness, and toughness of rocks and PA for the prediction of hard dimension stone sawability in quarrying. Geosystem Engineering“,(2017), 1-16, doi: 10.1080/12269328.2017.1278727. [26] Akhyani M., Sereshki F., Mikaeil R., Taji M., “Combining fuzzy RES with GA for predicting wear performance of circular diamond saw in hard rock cutting process“, Journal of Mining and Environment, (2017), doi: 10.22044/jme.2017.5770.1388. [27] Petruk W., Image analysis: “An overview of developments”. CANMET Report 86-4E, (1986), 5 pp.
421