Classification and Clustering of Granular Data Andrzej Bargiela Department of Computing The Nottingham Trent University
Nottingham, NG1 4BU, UK
[email protected]
Abstract Information granules are formed to reduce the complexity of the description of real-world systems. The improved generality of information granules is attained through sacrificing some of the numerical precision of point-data. In this study we consider a hyperbox-based clustering and classification of granular data and discuss detailed criteria for the assessment of the quality of the combined classification and clustering. The robustness of the criteria is assessed on both synthetic data and real-life data from the domain of traffic control. 1. Introduction Development of understanding of complex systems is a process of creating mental abstractions that makes it possible to ignore irrelevant detail and concentrate on essential features of systems. There are two main approaches to data clustering – agglomerative and partitive; corresponding to bottom-up and top-down strategies. Commonly, the agglomerative approach involves the construction of a dendrogram of the data set, which visualizes the proximity of individual data points in the feature space [4], [5], [15]. However, the dendrogram does not provide a unique clustering. Various partitionings (with the same number of clusters) can be obtained by cutting the dendrogram at different levels in individual branches. An alternative agglomerative approach is that of granular clustering [2], [18], [20]. In its simplest, granular clustering starts from collection of numeric data (points in Rn) and ‘grow’ information granules according to some global proximity criterion. As the granulation progresses the distribution and size of the information granules begins to reflect the essence of the data. Forming the clusters enhances the descriptive
Witold Pedrycz Department of Electrical & Computer Engineering, University of Alberta and Systems Research Institute, Polish Academy of Sciences Edmonton, Canada
[email protected]
facet of the granules while gradually reducing the amount of detail. The number of clusters, present in the data, is found by monitoring the compatibility measure during the granulation process [2][14]. Clearly, the decision about how far the granulation process should proceed depends on the topology of the clusters and the shape of individual granules. The information granules used in this study are hyperboxes positioned in a multi-dimensional data space. The mathematical formalism of the interval analysis provides a robust framework for the analysis of information density of the granular structures that emerge in the process of clustering [13]. The study reflects the intuitive objective of matching the granularity of data items used to describe the physical systems to the structure of these systems. In this sense the granulation process is attempting to achieve the highest possible generalization while maintaining the specificity of data structures. Partitive clustering divides data set into a number of clusters, typically trying to minimize some criterion or error function. The number of clusters is usually predefined, but if the number of clusters is unknown, the partitive algorithm can be repeated for a varying number of clusters and the appropriate cluster cost can be incorporated into the optimality criterion. An example of a commonly used partitive algorithm is CMeans algorithm [3], [6], [7], [8] which minimizes the sum of distances between individual data points and their corresponding cluster centers. However, the CMeans algorithm has a significant shortcoming in that the distance measure used in the cost function implies a particular shape of clusters. For example if the distance measure is Euclidean then the clusters found by the algorithm are spherical. Although this may not be a problem in some cases, there are many practical
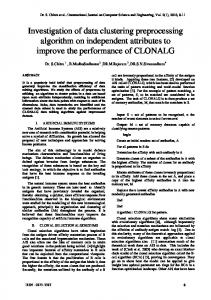
situations where such a constraint on the topology of clusters is too restrictive. Another popular partitive clustering algorithm is that of self-organizing feature maps (SOM) [9], [11]. The SOM consists of a regular grid of map units, typically defined in R2 space for ease of visualization. The process of training the SOM is the iterative refinement of nonlinear mapping from the input space (multidimensional) to the feature map space (of lower dimension). This can be interpreted as stretching an elastic net (grid of map units) over the ‘cloud’ of input data. Data points lying near each other in the input space are mapped onto nearby map units. Thus, the SOM has an inherent capability to reflect the original topology of the input data (and consequently the complex topology of clusters) in the appropriate activation of the grid map elements. In this study we investigate a hierarchical two-level clustering in which agglomerative granular clustering reduces the cardinality of the input data set and the partitive SOM clustering provides topology-preserving mapping from multi-dimensional input space to R2. The idea is illustrated in Figure 1.
2. Granular clustering In order to formalize the level-1 abstraction (granular clustering) of the input data we define its two essential elements: the mathematical description of information granules and the definition of the granule compatibility measure. The information granules are expressed as hyperboxes A(la , ua ) and B(lb, ub) ⊂ Rn, with the parameters la , ua lb, ub ∈ Rn providing explicitly the location of the minimum and maximum vertices of the hyperboxes. The distance d(A,B) between A and B is defined on a basis of the distance between its extreme vertices, that is d(A, B) = (||lb-la ||+ ||ub-ua ||)/2 (1) During granulation A(la , ua ) and B(lb, ub) are combined into a new information granule C(lc , uc ), where lc =min(la , lb) and uc =max(ua , ub). The granularity of C is captured by a volume, V (C) V (C ) =
n
∏ length (C ) i
i =1
(2) where
Abstraction 1
Abstraction 2
lengthi (C ) = max( u b ( i), u a ( i)) − min( lb ( i), la ( i)) (3) The expression of compatibility, compat(A, B) involves two components that is a distance between A and B, d(A,B), and a size of a newly formed information granule C that comes when merging A and B.
point data
granular data
clusters
Figure 1. Two-level topology-preserving hierarchical clustering approach The most important benefit of this procedure is its enhanced ability to cope with data noise and the improvement of the computational performance through the reduction of problem size. Naturally the approach is valid only if the clusters found using the granular data are similar to those of the original data. In the experiments, a comparison between the results of direct clustering of data and clustering of information granules has been made and the correspondence has been found to be satisfactory.
compat(A, B) = 1 - d(A,B)e -αV(C) (4) The rationale for the above compatibility measure is to promote formation of ‘compact’ granules, i.e. such that have approximately equal size in all dimensions. This is fully discussed in [2]. To retain the values of the compatibility measure to the unit interval, all data is normalized to the unit hypercube [0,1]n ⊂ Rn The parameter α balances the two concerns in the compatibility measure and is chosen so as to control an extent to which the volume impacts the compatibility measure. The compactness factor (e -αV(C) ) introduced in the compatibility measure is critical to the granular clustering. By contrast, it is not essential and would not play any role if we proceeded in a standard way
and did not attempt to develop granules but retained a cluster of numeric data. As the granulation proceeds the process of merging the progressively less closely associated patterns finds its reflection in the gradual reduction of the compatibility measure (4). A typical plot of the evolution of the compatibility measure over the complete clustering cycle is shown in Figure 2. compatibility 1
0.95
0.9
0.85
0.8
0.75
Number of granules coincides with the number of clusters
0.7
0.65
0.6 0
10
20
30
40
50
60
Decrease of the number of granules
(a) compatibility 1
0.95
0.9
0.85
0.8
Figure 2(a) illustrates unsupervised clustering process. The inflection point between the small gradient of the compatibility measure curve, at the early stages of the granulation, and the large gradient of the curve, at the final stages of the granulation, indicates the number of clusters in the original data. The success of such clustering clearly depends on how well the clusters can be represented by hyperboxes. The above limitation is somewhat relaxed in the case of partially supervised clustering (Figure 2(b)). The granulation process is terminated here earlier so that individual clusters are formed by a greater number of smaller information granules, thus retaining the ability to reflect more complex topologies of clusters. The collection of granules that is greater then the number of data clusters provides a starting point for level-2 abstraction, the identification of clusters. While the partially supervised granular clustering finds its natural termination when all granules become labeled with cluster numbers, in the unsupervised case it is necessary to set an arbitrary granulation threshold (Figure 2(c)). Clearly, the early termination of the granulation process enhances the ability to capture complex topologies of clusters but it needs to be balanced against the desirable reduction of computational complexity of the subsequent clustering.
0.75
Number of granules greater then the number of clusters
0.7
0.65
0.6 0
10
20
30
40
50
60
Decrease of the number of granules
(b) compatibility 1
0.95
0.9
0.85
0.8
0.75
Number of granules corresponding to an arbitrary threshold
0.7
0.65
3. SOM clustering The level-2 abstraction, the SOM clustering of granular data, is accomplished by training the map elements on the data (granules) A ⊂ Rn chosen randomly from the input data set. In order to be compatible with the standard form of SOM algorithm [11], the granules are represented as vectors x ∈ R2n formed by concatenating coordinates of the min- and maxcoordinate vertices of the granule A, x=[la u a ]. Distances between x and all the prototype vectors are computed. The best matching unit, which is denoted here by b, is the element of the map that has its prototype closest to x.
0.6 0
10
20
30
40
50
60
Decrease of the number of granules
(c) Figure 2. An example of the evolution of the compatibiliy measure in the case of unsupervised clustering [2] (a), partially supervised clustering [1] (b) and arbitrary data granulation (c).
||x-mb|| = mini{||x-mi||} (5) The prototype vectors of unit b and of its topological neighbours are updated according to the rule mi(t+1)=(1-βkbi(t)) mi(t) + βkbi(t)) x where: t β(t) kbi(t)
(6) time step learning adaptation coefficient neighborhood kernel centered on b
kbi(t)= exp (-||x-mb|| 2 / 2σ2(t))
epochs to see how the two SOMs compare (Figure 6(a) and (b)).
(7) 4. Experiments The synthetic data set consists of 45 data points in [0,1]2 ⊂ R2, as illustrated in Figure3. The level-1 abstraction of this data has been achieved through granular clustering which was terminated when 10 granules were condensed from the original data set (Figure 4).
0.8
4
0.7
0.6
2
0.5
0.4
0.3
1
0.2
4
0.9 0.1
0.2
0.3
0.4
0.5
0.6
0.7
0.8
0.9
0.8
4 0 0
0.7
0.6 0.5
0.4
0 0 4
2 0 0
(a)
0.3
0.2 0.9 0.1 0
0.1
0.2
0.3
0.4
0.5
0.6
0.7
0.8
0.9
1
19
0.8
Figure 3. Synthetic point data set
0.7
6
0.6
1
0.5
0.9
0.4
0.8 0.3 0.7 0.2
20
0.6 0.1
0.2
0.3
0.4
0.5
0.6
0.7
0.8
0.9
1
0.5
0.4
6 0 19 0 0 0 0 20 0
0.3
0.2
0.1 0
0.1
0.2
0.3
0.4
0.5
0.6
0.7
0.8
0.9
1
(b)
Figure 4. Granular data abstracted from the point data. Level-2 abstraction of the above granular data is accomplished by training 3x3 SOM. A representative set of results is illustrated in Figure 5(a). Even with a small number of SOM training epochs (20), a crisp identification of 3 major clusters has been obtained. Clearly the exact shape of the map depends on the order of presentation of granular data to the SOM, but the result of clustering, as summarized by the matrix representing association of input data with individual map elements, proved to be remarkably stable. The validity of the identified clusters has been confirmed by training the same 3x3 SOM on the original data. Also here we obtain a crisp identification of 3 major clusters after performing as little as 20 training epochs (Figure 5(b)). The fine-tuning of SOM, which is the most time consuming phase, is here entirely avoided. For the completeness of the evaluation however we have trained the two networks for additional 1980
Figure 5. 3x3 SOM networks and the matrix of data/grid associations after 20 epochs using granular data (a) and original data (b)
2
0.8
2 0.7
2
0.6
0.5
0.4
0.3
1
0.2
2 0.1
0.2
1 0.3
0.4
2 0 1 (a)
0.5
0.6
2 0 2
0.7
2 0 1
0.8
0.9
crossing on red lights). This noise is smoothed-out quite effectively during the granulation process. 0.9
5
5 1
0.8
9
0.7
6 0.6
0.95
0.5
0.4 0.9 0.3
0.2
14 6 0.1
0.2
0.3
0.4
0.5
0.6
0.7
0.8
0.9
1 0.85 0
5 9 5 0 0 14
6 0 6
(b) Figure 6. 3x3 SOM networks and the matrix of data/grid associations after 2000 epochs using granular data (a) and original data (b) While training SOM for 2000 epochs produces, as expected, a more balanced allocation of data to map elements, the results obtained with granular data remain, also in this case, broadly equivalent to those obtained with the original point-data. The second example is concerned with a real-life data representing a log of traffic queues on a 3-way intersection. The intersection is controlled by an adaptive UTC system that adjust split/cycle/offset of traffic lights. While the detailed relationship between individual vehicles and the signaling stage is quite difficult to formalize, there are essentially two ‘macro states’ of the traffic: (i) the flow of traffic between junctions 1 and 2 (to the exclusion of junction 3; and (ii) the flow of traffic between junctions 3-1 and 3-2 (to the exclusion of the flow between junctions 1-2). The detailed 3-dimensional data consists of 705 points. The level-1 abstraction of data has been accomplished by performing granulation to two pre-defined levels of granule compatibility, 0.95 and 0.9. This resulted in 185 and 85 granules respectively (see Figure 7). The 7x7 SOM network has been used to ensure a good separation of operational states. It is clear from Figure 8(a) and 8(b) that the granular data crisply defines the two operational states of the road intersection. However, when training SOM on original point-data there is occasionally a third cluster appearing. This represents a noise present in the data (vehicles
100
200
300
400
500
600
700
Figure 7. Compatibility measure evaluated during granulation of traffic queues data. Compatibility measure 0.95 corresponds to 185 granules and 0.9 corresponds to 85 granules.
85 granules 20 0 0 0 0 0 0 20 0 0 0 0 0 0 8 0 0 0 0 0 0 0 0 0 0 0 0 0 0 0 0 0 0 0 0 0 0 0 0 0 0 0 0 0 0 0 0 5 35 (a) 185 granules 11 0 0 0 0 0 0 14 0 0 0 0 0 0 61 0 0 0 0 0 0 8 0 0 0 0 0 0 1 0 0 0 0 0 0 0 0 0 0 0 0 0 0 0 0 0 0 41 52 (b)
150 255 0 0 42 0 0
705 point-data 0 0 0 0 0 0 0 0 0 0 0 0 0 0 0 0 0 0 0 0 0 0 0 0 0 0 0 0 0 0 0 0 0 0 103 (c)
0 0 0 0 0 0 155
Figure 8. Matrices representing associations of data to 7x7 SOM grid obtained for 85 granules (a), 185 granules (b) and 705 original point-data (c).
Note the effect of noise in data that is evident when training SOM on the original point-data.
[6]
5. Conclusions The paper presented an effective 2-level approach to identifying clusters in data. The level-1 abstraction is obtained through granulation of original point-data and level-2 abstraction involves SOM-based clustering. The advantage of this approach is that the intermediate granulation of information performs a useful filtering of noise in the original data. This results in a crisper clustering at the second stage.
[7]
Computational complexity of the granulation process is identical to that of SOM training (O(n 2) – evaluation of distances followed by O(n) – formation of granules) but the noise filtering afforded through the granulation process means that the SOM used in 2-level procedure can be smaller than the one used with the original point-data. This translates onto significant computational savings since the computational complexity of SOM training depends on the square of the map size.
[10]
[8]
[9]
[11]
[12]
[13] 6. Acknowledgements Support from the Engineering and Physical Sciences Research Council – EPSRC (UK), Natural Sciences and Engineering Research Council of Canada (NSERC) and the Alberta Consortium of Software Engineering (ASERC) is gratefully acknowledged.
[14]
[15] [16]
7. References [1] Bargiela, A., Pedrycz, W., (2001), Granular clustering with partial supervision, Proc. European Simulation Multiconference ESM’2001. [2] Bargiela, A., Pedrycz, W., From numbers to information granules: A study of unsupervised learning and feature analysis, In: H. Bunke, A. Kandel (eds.) Hybrid Methods in Pattern Recognition, World Scientific, to appear. [3] Bezdek, J.C., (1981), Pattern recognition with fuzzy objective function algorithms, New York, Plenum. [4] Boudaillier E., Hebrail G., (1998), Interactive interpretation of hierarchcal clustering, Intell. Data Anal., vol.2, no. 3, 1998. [5] Cios K., Pedrycz W., Swiniarski R., Data Mining Techniques, Kluwer Academic Publishers, 1998.
[17]
[18]
[19]
[20]
Dubois, D., Jaulent, M.C., Some techniques for extracting fuzzy regions, Proc. 1st IFSA Congr., July 1985. Hathaway, R.J., Bezdek J.C., (1988), Recent convergence results for the fuzzy C-means clustering algorithms, J. Classification, vol. 5, pp.237-247. Hirota, K., Pedrycz, W., (1986), Subjective entropy of probabilistic sets and fuzzy cluster analysis , IEEE Trans. Syst. Man Cybernetics, 1, pp. 173-179. Jain, A., Dubes, R., (1988), Algorithms for clustering data, Englewood Cliffs, Prentice Hall. Kandel, A., (1986), Fuzzy mathematical techniques with applications, Addison-Wesley, Reading, MA Kohonen T., (1982), Self-organised formation of topologically correst feature maps, Biol. Cybern., vol. 43, no. 1, pp.59-69. Martinez T., Schulten K., (1991), A ‘neural gas’ network learns topologies, in Artificial Neural Networks, T. Kohonen et al (eds.) Elsevier, 1991, pp. 397-402. Moore, R.E., (1966), Interval analysis, PrenticeHall, Englewood Cliffs, NJ. Pedrycz, W., Bargiela, A., Granular clustering: a granular signature of data, submitted to IEEE Trans. on Fuzzy Systems. Pedrycz, W., (1997), Computational Intelligence: An Introduction, CRC Press, Boca Raton, FL. Pedrycz, W., Gomide, F., An Introduction to Fuzzy Sets, Cambridge, MIT Press, Cambridge, MA, 1998. Pedrycz, W., Smith, M.H., Bargiela, A (2000), Granular signature of data, Proc. 19th Int. (IEEE) Conf. NAFIPS’2000, July 2000, pp. 69-73. Zadeh, L.A., (1979), Fuzzy sets and information granularity, In: M.M. Gupta, R.K. Ragade, R.R. Yager, eds., Advances in Fuzzy Set Theory and Applications, North Holland, Amsterdam, 3-18. Zadeh, L.A., (1996), Fuzzy logic = Computing with words, IEEE Trans. on Fuzzy Systems, vol. 4, 2, pp. 103-111. Zadeh, L.A., (1997), Toward a theory of fuzzy information granulation and its centrality in human reasoning and fuzzy logic, Fuzzy Sets and Systems, 90, 1997, pp. 111-117.