Classification Error Rate for Quantitative Evaluation of. Content-based Image Retrieval Systems. Thomas Deselaers, Daniel Keysers, and Hermann Ney.
Classification Error Rate for Quantitative Evaluation of Content-based Image Retrieval Systems Thomas Deselaers, Daniel Keysers, and Hermann Ney Lehrstuhl f¨ur Informatik VI – Computer Science Department RWTH Aachen University –52056 Aachen, Germany {deselaers, keysers, ney}@informatik.rwth-aachen.de Abstract A major problem in the field of content-based image retrieval is the lack of a common performance measure which allows the researcher to compare different image retrieval systems in a quantitative and objective manner. We analyze different proposed performance evaluation measures, select an appropriate one, and give quantitative results for four different, freely available image retrieval tasks using combinations of features. This work gives a concrete starting point for the comparison of content-based image retrieval systems. An appropriate performance measure and a set of databases are proposed and results for different retrieval methods are given.
1 Introduction Content-based image retrieval (CBIR) aims at searching image databases for specific images that are similar to a given query image. This search is based on the appearance of the images instead of a textual description. Several CBIR systems are available but it is difficult to assess which of these systems is the best as it is not possible to compare CBIR systems quantitatively and objectively. A review on CBIR is given in [10]. Although a set of quantitative performance measures for comparing CBIR systems was proposed in [5] it remains difficult to compare CBIR systems because usually different databases and performance measures are used. Some works give e.g. P R graphs, others show some example queries with results, only. One reason for this lack of comparability is the absence of a standard database to determine a standard set of quantitative performance measures. In this paper we extend and analyze the performance measures proposed, present a set of small, freely available databases for image retrieval, and give quantitative results for these tasks. We hope that other research groups will find these results valuable as a starting point to evaluate their systems on the same data using the same performance measures. The system used for these experiments is available online1 . 1 http://www-i6.informatik.rwth-aachen.de/˜deselaers/fire.html
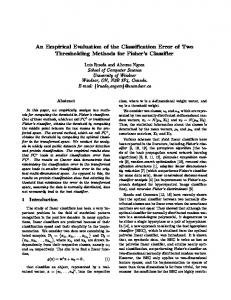
2 Performance Evaluation Measures In textual information retrieval the most commonly used performance measures are the precision P and the recall R, defined as: NR NR R = RR P = R NR N where NRR is the number of relevant documents retrieved, NR the total number of documents retrieved, and N R the total number of relevant documents in the database. Precision and recall often are combined into a P R-graph. In [5] a set of performance measures is proposed. This set consists of: the P R-graph; Rank1 , the rank of the first re] the average normalized rank; trieved relevant image; Rank, � R P (20) , P (50) , P N , the precision after 20, 50, and N R images retrieved; R (P = 0.5), the recall at the point where precision is 0.5; and R (100), the recall after 100 images retrieved. We propose to extend this set by P (1), the precision of the first image retrieved; P R-area, the area under the P R-graph; and P (R = P ), the precision where recall and precision are equal. If P (1) is averaged over a set of queries it is the recognition rate of a nearest neighbor classifier, and thus the error rate (ER) of this classifier is given as 1 − P (1). This relation opens the connection between CBIR and image classification, as it shows that both tasks are closely related. All these measures are only applicable when relevances are known, e.g. the images from the database are labeled with respect to the query image. In some databases it is suitable to assume that a user querying with an image from a certain class aims at finding other images from the same class. To simplify the comparison of image retrieval systems it would be preferable to have a single performance measure. Since all the measures are supposed to measure the quality of the retrieval system in one way or another it is obvious to assume a strong correlation. However, to our knowledge so far no quantitative analysis of this assumption has been performed. In Figure 1, an empirical correlation matrix for a representative selection of performance measures is depicted. This matrix was calculated for experiments using different features for the WANG database
1)
R= 1)
100 46
P(
P(
100 96 33
R= 0. 9)
R= 0. 5)
100 96 90 27
P(
R= 0. 1)
100 93 84 80 29
P(
P(
100 89 98 99 96 35
R= 0)
-a re a R
100 99 89 97 99 96 35
P
100 -97 -96 -95 -96 -94 -92 -40
R= P)
100 81 -68 -67 -88 -72 -60 -63 -29
P(
100 -71 -97 99 99 91 98 98 96 35
Ra nk 1 R] an k
100 97 -55 -90 97 98 81 95 99 95 25
R(
R(
100 97 99 -71 -97 99 99 92 99 98 94 31
10 0)
P= .5 )
50 )
100 -96 -89 -95 80 95 -94 -93 -98 -97 -90 -85 -26
P(
100 -100 96 89 95 -80 -95 94 93 98 97 90 85 26
ER
P( P(1) ER P(50) R(P=0.5) R(100) Rank1 ] Rank P(R=P) P R-area P(R=0) P(R=0.1) P(R=0.5) P(R=0.9) P(R=1)
100
Figure 1. Correlation of performance measures scaled to [−100, 100].
Figure 2. Examples, WANG database. (cp. Section 3.1). It reveals that nearly all the measures are indeed strongly correlated. For the remainder of this paper we therefore choose the ER as performance measure as it is well established for classification tasks and the average absolute correlation of the ER to the other measures is 0.88.
3 Databases Here, the problem of choosing an appropriate database to compare different image retrieval systems is not solved, but instead we present a selection of different databases representing different image retrieval tasks. We propose to use these databases since for the task of image retrieval the relevances can be assumed to be known and thus an objective comparison of different retrieval methods is possible. As the databases are freely available, it is possible for other groups to compare their systems on these databases.
3.1 WANG database The WANG database is a subset of the Corel database of 1000 images which were selected manually to form 10 classes of 100 images each. The images are subdivided into 10 classes (e.g. Africa, beach, ruins, food) such that it can be assumed that a user wants to find the other images from a class if the query is from one of these 10 classes. This database was created at the Pennsylvania State University and is available for download2. The images are of size 384× 256 and some examples are depicted in Figure 2.
Figure 3. Examples, UW database.
3.2 UW database The UW database contains 1109 pictures. The images were created by the computer science department of the University of Washington and are available for download 3. The images are of different sizes, from 640×480 up to 883×589. No class information is available for the images but most of the images are annotated. The images which had not been annotated before were annotated for this work4 . As relevances for this database are not obvious, some assumptions are made. We assume that an image is relevant with respect to another image iff the corresponding annotations contain identical words. The annotations do not contain stop words like “and” or “the”. Additionally, the porter stemming algorithm is used for normalization of the annotations.
3.3 ZuBuD The Zurich Building Image Database (ZuBuD) was created by the Swiss Federal Institute of Technology in Zurich and is described in more detail in [8, 9]. The database consists of two parts, a training part of 1005 images of 201 buildings, 5 of each house and a query part of 115 images. The images are of size 640×480 and were taken from different positions using different cameras under different lighting conditions. To give an impression of the data, some example images are depicted in Figure 4. This database is available for download5. 3 http://www.cs.washington.edu/research/imagedatabase/groundtruth/ 4 http://www-i6.informatik.rwth-aachen.de/˜deselaers/uwdb
2 http://wang.ist.psu.edu/
5 http://www.vision.ee.ethz.ch/showroom/zubud.en.html
Table 1. ER [%] for different training situations for the WANG and UW databases. Figure 4. Examples, ZuBuD database.
Figure 5. Examples, CalTech database.
In [4] the authors use different datasets for unsupervised object training and recognition of objects. The system classifies whether an object is contained in the image or not. For this purpose there are several sets of images containing certain objects (motorbikes, airplanes, and faces) and a set of arbitrary images not containing any of these objects. Here the task is to find images containing the object iff the query image contains the object. The images are of various sizes and for the experiments they were converted to gray images. The database is freely available6 .
4 Results In this section the results obtained using different features on the given databases are presented. All results are given as error rates in percent. If no separate train/test corpus is available, leaving one out is used. For the experiments feature weightings were trained on a training database in a leaving-one-out manner and tested on a testing database. For the retrieval/classification process a weighted sum of different distance measures over the different features is calculated. This is formalized as follows: Let B = {X1 . . . XN} be the image database, X is an image represented by a set of features: X := {Xm | m = 1 . . . M }. Because a query Q is also an image, we have Q := {Qm | m = 1 . . . M }. To query the database, for each image a dissimilarity measure D(Q, X) is calculated as: M X
WANG 12.7 (9.9) 15.1
UW 12.2 13.5 (9.4)
important feature. More details about the features used are described in [1, 2, 3, 7, 11].
4.1 Results for WANG and UW database
3.4 CalTech database
D(Q, X) :=
feature weights equal trained on WANG trained on UW
wm · dm (Qm , Xm ).
m=1
Then, image X with X = argminX ′ ∈B {D(Q, X)} is returned. Here, dm is a distance function or dissimilarity measure and wm ∈ R is a weight. For each dm , PN ′ X ′ ∈B dm (Qm , Xm ) = 1 is enforced by normalization. By adjusting the weights wm it is possible to emphasize properties of different features. For example to search for an image of a sunset the colors in the image might be important, but to search for images of zebras, texture is an 6 http://www.robots.ox.ac.uk/˜vgg/data
The first experiments considered use the WANG and the UW databases. That is, one of the databases was used as training database to find the optimal parameters and the other was used to test the parameters. For the experiments the following features were available and combined: five different invariant feature histograms with monomial kernels [1], one with relational kernel [1], 32 × 32 thumbnails of the images, local features [7], two different local feature histograms, a global texture descriptor [2], and a histogram of Tamura texture features [2, 11]. The line “equal weights” means that all features were used with equal weights. The table shows that training the parameters on one of the databases leads to worse results on the other database. There is evidence that this is due to overfitting to the training data and that the databases are not similar enough to train the parameters this way.
4.2 Results for ZuBuD As we have a training and a test set for the ZuBuD, here the estimation of the optimal parameters is more clear. The optimal parameter set for the training data is determined using leaving-one-out and then the test set is classified using these parameters. The results in Table 2 show that an appropriate parameter set improves the results strongly. The first two rows give results obtained in [6] where compact DCT based local representations were used and [8] where local affine invariant regions were used. Note that in [6] a very specialized method was used and parameters were adjusted using the test data. The remaining two lines show results with a combination of four invariant feature histograms with monomial kernel, one with relational kernel [1], 2 different color histograms, Tamura texture histograms [2, 11], and 32 × 32 thumbnails of the images. In the line “equal weights” all features were equally weighted and in the last line the wm were optimized on the training data.
4.3 Results for the CalTech database Another task which is closely related to content based image retrieval is the classification of complex scenes. One
Table 2. ER [%] for ZuBuD. Method HPAT indexing [8] Local DCT repr. [6] equal weights wm ∈ {0, . . . , 10}
L1O ER[%] training data
7.3 (3.9)
ER[%] 13.9 0.0 15.7 10.4
Table 4. Summary of ER [%]. Database WANG UW ZuBuD CalTech airplanes CalTech faces CalTech motorbikes
best other [6] 0.0 [4] 9.8 [4] 3.6 [4] 7.5
this work 12.7 12.2 10.4 0.8 1.6 7.4
Table 3. Equal ER [%] on CalTech database. Method pixel values prob. model [12] prob. model [4] Tamura feature equal weights
airplanes 24.0 32.0 9.8 1.6 0.8
faces 15.0 6.0 3.6 3.9 1.6
motorbikes 17.4 16.0 7.5 7.4 8.5
such task is the CalTech database. Here, three different tasks are considered, each consisting of a two class decision problem whether the object of interest is depicted in the image or not. In Table 3 we present results obtained using the features presented in this work without incorporation of special domain knowledge or complex models like those proposed in [4, 12]. The results show that each of the three tasks can be solved better with a combination of simple features than they can be solved with the complex model. This implies that the task can be regarded as “too easy” for complex recognition tasks as the global image similarity is already sufficient to obtain very good results. The line “pixel values” gives an absolute baseline error rate. This error rate was obtained using a nearest neighbor classifier for images scaled to 32 × 32 pixels. The line “Tamura feature” gives the error rate for a nearest neighbor classifier using only the Tamura texture histogram [11] and the line “equal weights” uses a combination of Tamura features and invariant feature histograms with relational and monomial kernels [1, 2] where all features involved were weighted equally.
5 Conclusion & Perspective In this paper, we analyze different performance measures for CBIR and select the error rate as an appropriate measure for comparison of different CBIR methods. More detailed analysis is only needed if special properties of a CBIR system are of interest. Using this performance measure, we present quantitative state-of-the-art results for four different image retrieval tasks. To obtain these results parameters for feature combinations are trained on one and tested on another database. Table 4 summarizes the results of this work and the best comparable results from other works and shows that the results obtained using the proposed system are comparable to those published. For the future it would be desirable to create a standard test method for CBIR as is already established for textual in-
formation retrieval in the TREC conference. The databases and performance measures presented here are hoped to provide a possible starting point for this.
References [1] H. Burkhardt and S. Siggelkow. Invariant Features in Pattern Recognition – Fundamentals and Applications, chapter 7, pp. 269–307. Wiley, 2001. [2] T. Deselaers. Features for Image Retrieval. Diploma thesis, Lehrstuhl f¨ur Informatik VI, RWTH Aachen, University of Technology, Aachen, Germany, Dec. 2003. [3] D. Fend, W. Siu, and H. Zhang, editors. Multimedia Information Retrieval and Management – Technological Fundamentals and Applications. Springer, 2003. [4] R. Fergus, P. Perona, and A. Zissermann. Object Class Recognition by Unsupervised Scale-invariant Learning. In Proc. CVPR, pp. 264–271, Blacksburg, VG, June 2003. [5] H. M¨uller, W. M¨uller, D. M. Squire, S. Marchand-Maillet, and T. Pun. Performance Evaluation in Content-based Image Retrieval: Overview and Proposals. Pattern Recognition Letters, 22(5):593–601, 2001. [6] S. Obdrzalek and J. Matas. Image Retrieval Using Local Compact DCT-based Representation. In Proc. DAGM, LNCS 2781, pp. 490–497, Magdeburg, Germany, Sept. 2003. [7] R. Paredes, J. Perez-Cortes, A. Juan, and E. Vidal. Local Representations and a Direct Voting Scheme for Face Recognition. In Workshop on Pattern Recognition in Information Systems, pp. 71–79, Set´ubal, Portugal, July 2001. [8] H. Shao, T. Svoboda, T. Tuytelaars, and L. V. Gool. HPAT Indexing for Fast Object/Scene Recognition based on Local Appearance. In Proc. CIVR, LNCS 2728, pp. 71–80, Urbana-Champaign, IL, July 2003. [9] H. Shao, T. Svoboda, and L. van Gool. ZuBuD – Zurich Buildings Database for Image Based Recognition. Technical Report No. 260, Computer Vision Lab, Swiss Federal Institute of Technology, Zurich, Switzerland, Apr. 2003. [10] A.W.M. Smeulders, M. Worring, S. Santini, A. Gupta, and R. Jain. Content-based Image Retrieval: The End of the Early Years. IEEE Trans. PAMI, 22(12):1349–1380, Dec. 2000. [11] H. Tamura, S. Mori, and T. Yamawaki. Textural Features Corresponding to Visual Perception. IEEE Trans. Systems, Man, and Cybernetcs, SMC-8(6):460–472, June 1978. [12] M. Weber. Unsupervised Learning of Models for Object Recognition. PhD thesis, California Institute of Technology, Pasadena, CA, 2000.