Jan 25, 2003 - Slammer, Nimda, and Code Red I. Their details are listed in. Table I. ... It propagates fast through email messages, web browsers, and file systems. Viewing ..... Available: http://www.ntu.edu.sg/home/egbhuang/elm codes.html.
Classification of BGP Anomalies Using Decision Trees and Fuzzy Rough Sets Yan Li, Hong-Jie Xing, Qiang Hua, and Xi-Zhao Wang
Prerna Batta, Soroush Haeri, and Ljiljana Trajkovi´c
Hebei University Baoding, Hebei, China Email: {ly, hjxing, huaq, wangxz}@hbu.cn
Simon Fraser University Vancouver, British Columbia, Canada Email: {pbatta, shaeri, ljilja}@sfu.ca
Abstract—Border Gateway Protocol (BGP) is the core component of the Internet’s routing infrastructure. Abnormal routing behavior impairs global Internet connectivity and stability. Hence, designing and implementing anomaly detection algorithms is important for improving performance of routing protocols. While various machine learning techniques may be employed to detect BGP anomalies, their performance strongly depends on the employed learning algorithms. These techniques have multiple variants that often work well for detecting a particular anomaly. In this paper, we use the decision tree and fuzzy rough set methods for feature selection. Decision tree and extreme learning machine classification techniques are then used to maximize the accuracy of detecting BGP anomalies. The proposed techniques are tested using Internet traffic traces. Keywords—Machine learning; decision tree; fuzzy rough sets; extreme learning machine; weighted extreme learning machine.
I.
I NTRODUCTION
Border Gateway Protocol (BGP) enables exchange of routing information between gateway routers in a network of Autonomous Systems. Its main function is to exchange reachability information among BGP peers and select the best route based on a set of metrics such as the shortest ASpath, the nearest next-hop router, or routing policies. BGP anomalies are triggered by a variety of events such as session resets, router misconfigurations, and link or router failures. They affect Internet routers and, consequently, slow down servers and hosts. BGP anomalies often occur and techniques for their detection have recently gained visible attention and importance. A number of anomaly detection techniques have been reported in the literature. Anomaly detection techniques have been applied in computer networks [1]. These techniques are employed to detect BGP anomalies that frequently affect the Internet [2], [3] and its applications. They may be applied to detect BGP anomalies, intrusion attacks, worms, and distributed denial of service attacks (DDoS) because they all have similar characteristics [4], [5]. Anomaly detection may be viewed as a classification problem of assigning an “anomaly” or “regular” label to a data point. There are numerous machine learning methods that address these classification tasks. However, redundancies in the collected data may affect the performance of classification methods. Feature selection and feature extraction may be used to reduce redundancy among features and improve the generalization of classification algorithms. Feature selection methods such as decision tree [6] and fuzzy rough sets [7] are used to select a subset of features from the original
feature space. Furthermore, feature extraction methods such as principal component analysis project the original data points onto a lower dimensional space. However, features transformed by feature extraction lose their original physical meaning. The main focus of approaches that have been proposed in the past is developing models for traffic classification. The accuracy of a classifier depends on the extracted features, the combination of selected features, and the underlying model. In this paper, we use feature selection methods to select subsets of the original features while preserving the physical meaning of the features. We examine the effects of feature selection on the performance of BGP anomaly classification. We employ two methods for feature selection (decision tree and fuzzy rough sets) and evaluate their performance in terms of classification accuracy and execution time. We then train an extreme learning machine (ELM) [8], [9] classifier using the selected features. ELM is a fast learning algorithm used with a single hidden layer feed-forward neural (SLFN) network. It randomly selects the weights of the hidden layer and analytically determines the SLFN output weights. It avoids the iterative tuning of the weights used in traditional neural networks and, hence, it is fast and could be used as an online algorithm. This paper is organized as follows. In Section II, we describe the BGP datasets and extracted features relevant to the detection of BGP anomalies. The proposed machine learning techniques for feature selection and classification of anomalies are described in Section III and Section IV, respectively. We conclude with Section V. II.
U NDERSTANDING BGP DATA
The datasets examined in this paper consist of BGP update messages collected by the R´eseaux IP Europ´eens (RIPE) under the Routing Information Service (RIS) project [10]. The RIPE and Route Views [11] BGP update messages are available to the research community in the multi-threaded routing toolkit (MRT) binary format [12]. The Internet Engineering Task Force (IETF) introduced MRT to export routing protocol messages, state changes, and content of the routing information base (RIB). We filter the collected traffic for BGP update messages during the time period when the Internet experienced anomalies. In this paper, we consider three well-known worms: Slammer, Nimda, and Code Red I. Their details are listed in Table I. The Structured Query Language (SQL) Slammer worm attacked Microsoft SQL servers on January 25, 2003 [13]. The
TABLE I.
Slammer Nimda Code Red I
D ESCRIPTION OF THE BGP DATASETS . Class
Date
Anomaly Anomaly Anomaly
January 25, 2003 September 18, 2001 July 19, 2001
Duration (h) 16 59 10
Slammer worm is a code that generates random IP addresses and replicates itself by sending 376 bytes of code to the those IP addresses. If the destination IP address is a Microsoft SQL server or a user’s PC with the Microsoft SQL Server Data Engine (MSDE) installed, the server becomes infected and begins infecting other servers. As a result, the update messages consume most of the routers’ bandwidth, which in turn slows down the routers and in some cases causes the routers to crash. The Nimda worm [14] was released on September 18, 2001. It propagates fast through email messages, web browsers, and file systems. Viewing the email message triggers the worm payload. The worm modifies the content of the web document file in the infected hosts and copies itself in all local host directories. The Code Red I worm attacked Microsoft Internet Information Services (IIS) web servers on July 19, 2001 [15]. The worm affected approximately half a million IP addresses a day. It takes advantage of vulnerability in the IIS indexing software. It triggers a buffer overflow in the infected hosts by writing to the buffers without checking their limits. The BGP protocol generates four types of messages: open, update, keepalive, and notification [16]. The extracted features, shown in Table II, are categorized into volume and AS-path features. The AS-PATH is a BGP update message attribute that enables the protocol to select the best path for routing packets. If a feature is derived from the AS-PATH attribute only, it is categorized as an AS-path feature. Otherwise, it is categorized as a volume feature. The AS-PATH attribute in a BGP update message indicates a path that a packet may traverse to reach its destination. There are three types of features: continuous, categorical, and binary. The BGP features are sampled every minute during a fiveday period: the peak day of an anomaly, two days prior, and two days after the anomaly. This sampling yields 7,200 samples for each anomalous event, where 5,760 samples are considered regular (non-anomalous) and 1,440 samples are considered anomalous. Hence, the minority of samples belongs to anomaly classes and, therefore, BGP anomaly datasets are imbalanced. A dataset is imbalanced when at least one class is represented by a smaller number of training samples compared to other classes. Most classification algorithms minimize the number of incorrectly predicted class labels while ignoring the difference between types of misclassification by assuming that all misclassification errors have equal costs. As a result, a classifier that is trained using an imbalanced dataset may successfully classify the majority class with a good accuracy while it may be unable to accurately classify the minority class. The assumption that all misclassification types are equally costly is not valid in many application domains. In the case of BGP anomaly detection, incorrectly classifying an anomalous sample is more costly than incorrect classification of a regular sample. Various approaches have been proposed to achieve accurate classification results when dealing with imbalanced
TABLE II. E XTRACTED F EATURES FROM BGP U PDATE M ESSAGES . NLRI: N ETWORK L AYER R EACHABILITY I NFORMATION ; IGP: I NTERIOR G ATEWAY P ROTOCOL ; EGP: E XTERIOR G ATEWAY P ROTOCOL . Feature
Definition
Type
Category
1 2 3 4 5 6 7 8 9 10 11 12 13 14–24
Number of announcements Number of withdrawals Number of announced NLRI prefixes Number of withdrawn NLRI prefixes Average AS-PATH length Maximum AS-PATH length Average unique AS-PATH length Number of duplicate announcements Number of duplicate withdrawals Number of implicit withdrawals Average edit distance Maximum edit distance Inter-arrival time Maximum edit distance = n, where n = (7, ..., 17) Maximum AS-path length = n, where n = (7, ..., 15) Number of IGP packets Number of EGP packets Number of incomplete packets Packet size (B)
continuous continuous continuous continuous categorical categorical continuous continuous continuous continuous categorical categorical continuous binary
volume volume volume volume AS-path AS-path AS-path volume volume volume AS-path AS-path volume AS-path
binary
AS-path
continuous continuous continuous continuous
volume volume volume volume
25–33 34 35 36 37
datasets. Examples include assigning a weight to each class or learning from one class (recognition-based) rather than two classes (discrimination-based) [17]. Weighted Support Vector Machines (SVMs) [18] assign distinct weights to data samples so that the training algorithm learns the decision surface according to the relative importance of data points in the training dataset. Fuzzy Support Vector Machines [19] is a version of weighted SVMs that applies a fuzzy membership to each input sample and reformulates the SVMs so that input points make different contributions to the learning of decision surface. III.
F EATURE S ELECTION
A BGP anomaly detector may be implemented as a machine learning model that learns how to change its internal structure based on the external feedback [20]. Machine learning models learn to classify data points using a feature matrix. The matrix rows correspond to the data points while its columns correspond to the feature values. Even though machine learning may provide general models to classify anomalies, it may easily misclassify test data points due to the redundancy or noise contained in datasets. By providing a sufficient number of related features, machine learning models may overcome this deficiency and may help build a generalized model to classify data with small error rates [21], [22]. Many classification techniques have been implemented to detect anomalies [1], [20], [23]. Their goal is to maximize the accuracy of detecting targeted BGP anomalies. Performance of anomaly classifiers is closely related to feature selection algorithms [24]. We use decision tree and fuzzy rough set methods to select relevant features from BGP datasets. A. Decision Tree Algorithm Decision tree learning is a method commonly used in data mining. The goal is to create a model that predicts the value of a target variable based on several input variables. Each element in the classification domain is called a class. In a decision or a classification tree, each internal (non-leaf) node is labeled with
an input feature. The tree branches are labeled with possible feature values. Each leaf node is labeled with a class or a class probability distribution [25]. A top-down approach is commonly used for constructing decision trees. At every step, an appropriate variable is chosen to best split the set of items. The quality measure may be the homogeneity of the target variable within subsets. It is applied to each candidate subset. The combined results measure the split quality [26], [27].
Algorithm 1: Constructing the discernibility matrix� based on fuzzy rough sets. λi = � Sim(C) ∗ [xi ]D (xi ) and λj = Sim(C) ∗ [xj ]D (xj ) .
We use the C5 [28] software tool to generate decision tree for both feature selections and anomaly classifications. The C5 decision tree algorithm relies on the information gain measure. The continuous attribute values are discretized. The most important feature is iteratively used to split the sample space until a certain proportion of samples associated with the leaf node has the identical target attribute value. For each training dataset, a set of rules used for classification is extracted from the constructed decision tree.
2
10
B. Fuzzy Rough Sets
12
1 3 4 5 6 7 8 9 11
Fuzzy sets [29] as well as the more recently introduced rough sets [7], [30]–[32] have greatly affected the way we currently represent and compute with imperfect information. They have fostered broad research communities and influenced a variety of application areas. The fuzzy concept and fuzzy knowledge are more prevalent in practice because the theory of rough sets employs the symbolic features. Based on the equivalence relations, traditional rough set approaches only handle symbolic features, which greatly limits their application to problems where the feature values are continuous. Furthermore, rough sets are unable to describe the uncertainty of fuzziness. To solve these issues, fuzzy rough sets are introduced as an extension of the rough sets. Seminal research activities on fuzzy rough sets theory flourished during the 1990’s and early 2000’s. The concept of fuzzy rough sets originated from defining a fuzzy set within a family of fuzzy sets. It deals with the approximation of fuzzy sets in a fuzzy approximation space defined by a fuzzy similarity relation R or by a fuzzy partition. In the fuzzy rough sets approach, the concepts of decision system, equivalence relation, and the set approximations are redefined as fuzzy decision system, fuzzy similarity relation, and approximation operators, respectively [33]. In this approach, the fuzzy similarity relation and lower approximations are computed by the min operators. The similarity relation Sim(C) is an n × n matrix that describes similarities between any two samples. The lower approximations are m n-tuples. Algorithm 1 [34] provides the procedure for computing the fuzzy discernibility matrix that is used to generate the attribute reduction. The inputs are: the information system I consisting of a set of conditional attributes C and decision attributes D; the universe U ; and the partition of U based on decision attribute set D denoted by U/D that contains l classes. The output is the constructed discernibility matrix denoted by MD (U, C). Its element Cij denotes the set of attributes that distinguishes samples xi and xj . In Step 1 of Algorithm 1, the similarity Rk (xi , xj ) of every pair of samples xi and xj for each attribute Ck is the minimum attribute value of the two samples. In Step 2, the fuzzy similarity relation Sim(C) of every pair of
13 14 15 16 17 18 19 20 21 22
Input: Information system I = (U, C ∪ D) Universe U = {x1 , x2 , . . . , xn } Partition U/D = {D1 , D2 , . . . , Dl } Output: Discernibility matrix MD (U, C) begin Step 1: for each fuzzy attribute Ck do if Ck (xi ) 6= Ck (xj ) then Rk (xi , xj ) = min{Ck (xi ), Ck (xj )} end else Rk (xi , xj ) = 1 end end Step 2: Compute fuzzy similarity relation Sim(C) Sim(C)(xi , xj ) = min{Rk (xi , xj ) | k = 1, . . . , m} and i, j = 1, . . . , n Step 3: Compute fuzzy R-lower Sim(C) ∗ (Dk ) approximation for every Dk ∈ U/D Step 4: Construct the discernibility matrix MD (U, C) if λi > λj then Cij = {R : 1 − R(xi , xj ) ≥ λi } end else Cij = ∅ end end
samples is constructed by computing the minimum of all attributes. The lower approximation R-lower of each class Dk (k = 1, . . . , l) in the partition U/D is computed in Step 3. The R-lower approximation of Sim(C) ∗ (Dk ) contains k ntuples, indicating the membership of each sample that belongs to the decision class Dk . Let Subij (R) denote the ith element of the j th n-tuple in Sim(C) ∗ (Dk ). It is computed for every xk ∈ U as: � 1 if xk ∈ Dj Subij (R) = . (1) 1 − Sim(xk , xi ) if xi ∈ Dj Finally, in Step 4, the fuzzy discernibility matrix MD (U, C) for every pair of samples is computed as the matrix of the set of attributes. This matrix helps distinguish between pairs of samples. In Algorithm 2 [34], the attribute reduction is generated based on the discernibility matrix obtained in Step 4 of Algorithm 1. CoreD (C) is the set of singletons in the discernibility matrix MD (U, C). It is the most important set of attributes because only these attributes may differentiate between pairs of samples. The attribute reduction is initialized as CoreD (C) and then used to find the minimum set of attributes that maintains the discernibility property. The reduction is computed in the same manner as in the case of classical rough sets. C. Datasets and Selected Features We apply the decision tree algorithm for feature selection. We combine pairs of Slammer, Nimda, and Code Red I to form
Algorithm 2: Attribute reduction based on fuzzy rough sets. Input: Information system I = (U, C ∪ D) Universe U = {x1 , x2 , . . . , xn } Partition U/D = {D1 , D2 , . . . , Dl } Output: REDD (C) 1 begin 2 Step 1: Calculate discernibility matrix MD (U, C) using Algorithm 1 3 Step 2: Compute CoreD (C): Choose the singletons in MD (U, C) 4 Step 3: 5 let REDD (C)=CoreD (C) 6 Step 4: 7 for each Cij do 8 if REDD (C) ∪ Cij 6= ∅ then 9 let Cij = ∅ 10 end 11 end 12 Step 5: 13 for each Cij do 14 if ∃ Cij = ∅ then 15 go to Step 6 16 end 17 else 18 Stop 19 end 20 end 21 Step 6: 22 REDD (C) = REDD (C) ∪ Cij 23 end TABLE III.
D ECISION T REE A LGORITHM : T HREE DATASETS AND S ELECTED F EATURES .
Dataset
Training data
Selected features
Dataset 1 Dataset 2 Dataset 3
Slammer + Nimda Slammer + Code Red I Code Red I + Nimda
1–21, 23–29, 34–37 1–22, 24–29, 34–37 1–29, 34–37
the training datasets. These datasets used for feature selection are consistent with the data used in the classification stage. The selected features are shown in Table III. Based on the outcome of the decision tree algorithm, either four (30, 31, 32, 33) or five (22, 30, 31, 32, 33) features are removed in the constructed trees. The main reason for removal is that features are numerical and some are used repeatedly. Fewer features could be selected either based on the number of leaf nodes with the largest correct classified samples or based on the number of rules with maximum sample coverage. The features that appear in the selected rules are considered to be important and, therefore, are preserved. Applying fuzzy rough sets to select features using combination of datasets to form various training datasets [20] may cause the selected features to be unsuitable for classifiers and may lead to a high computational load. Hence, we individually use Slammer, Nimda, or Code Red I as the training datasets for feature selection. The computational complexity of the fuzzy rough algorithm is O(n2 m), where n is the number of samples and m is the number of features. Hence, fuzzy
TABLE IV. F UZZY ROUGH S ETS A LGORITHM : T HREE DATASETS AND S ELECTED F EATURES FROM THE S ET OF 37 F EATURES . Dataset
Training data
Selected features
Dataset 4 Dataset 5 Dataset 6
Slammer Nimda Code Red I
1, 3–6, 9, 10, 13–32, 35 1, 3–4, 8–10, 12, 14–32, 35, 36 3–4, 8–10, 12, 14–32, 35, 36
rough algorithms are rather slow when the number of samples is large. Therefore, we use Algorithm 2 for attribute reduction. Selected features using the fuzzy rough set method are listed in Table IV. 1) Slammer: A set of 28 is selected while features {2, 7, 8, 11, 12, 33, 34, 36, 37} are removed. 2) Nimda: A set of 28 features is selected while features {2, 5, 6, 7, 11, 13, 33, 34, 37} are removed. 3) Code Red I: A set of 27 features is selected while features {1, 2, 5, 6, 7, 11, 13, 33, 34, 37} are removed. Results show that most features (27 or 28 in total) are preserved after selection and only 9 or 10 features are removed. A plausible explanation may be that the min operator in the fuzzy rough sets algorithm causes the information loss. While the selected features are different for examined datasets, the reduced sets have a common set of features {3, 4, 9, 10, 14–32, 35}. The removed sets of features also have common elements {2, 7, 11, 33, 34, 37} and, hence, these features are considered to be redundant for all datasets. Even though the classification accuracy may be improved by performing feature reduction using fuzzy rough sets, the computational load of the algorithm for feature selection is rather high. Hence, this approach is not suitable in cases with large number of samples and attributes. In comparison, the decision tree algorithm is faster and may achieve acceptable classification accuracy. IV.
A NOMALY C LASSIFIERS
A. Decision Tree Algorithm The decision tree algorithm is one of the most successful techniques for supervised classification learning [6]. A decision or a classification tree is a directed tree where the root is the source sample set and each internal (non-leaf) node is labeled with an input feature to perform a test. Branches emanating from a node are labeled with all possible values of a feature. Each leaf of the tree is labeled with a class or a probability distribution over the classes. A tree may be “learned” by splitting the source set into subsets based on an attribute value test. This process is repeated on each derived subset in a recursive manner called recursive partitioning. The recursion is completed when the subset at a node contains all values of the target variable or when the splitting no longer adds value to the predictions. After a decision tree is learned, each path from the root node (source set) to a leaf node may be transformed into a decision rule. Therefore, a set of rules may be obtained by a trained decision tree, which may be used for classifying unseen samples. Training and testing accuracies Acctrain and Acctest are shown in Table V. The higher accuracies for the first two training datasets may be due to the distinct distributions of training and testing data.
TABLE V. Dataset Dataset 1 Dataset 2 Dataset 3
TABLE VI.
D ECISION T REE A LGORITHM : P ERFORMANCE . Testing data Code Red I Nimda Slammer
Acctrain
Acctest
90.7 92.3 87.1
78.8 72.8 23.8
Training time (s)
No. of features
1.8 2.1 2.3
P ERFORMANCE OF THE ELM A LGORITHM ON DATASETS WITH 37 AND 17 F EATURES . Dataset Dataset Dataset Dataset Dataset Dataset Dataset
37
17
TABLE VII.
Fig. 1.
1 2 3 1 2 3
Acctrain
Acctest
Average training time (s)
83.57 ± 0.11 83.53 ± 0.12 80.82 ± 0.09 84.50 ± 0.07 84.43 ± 0.12 83.06 ± 0.07
80.01 ± 0.07 79.75 ± 0.08 21.65 ± 1.93 79.91 ± 0.01 79.53 ± 0.10 51.56 ± 16.38
2.3043 2.2756 2.2747 1.9268 1.5928 1.8882
P ERFORMANCE OF F UZZY ROUGH S ETS WITH ELM A LGORITHM .
No. of features
Dataset
28 28 (from 37) 27 9 9 (from 17) 8
Dataset Dataset Dataset Dataset Dataset Dataset
4 5 6 4 5 6
Acctrain
Acctest
83.08 ± 0.11 83.08 ± 0.09 80.05 ± 0.00 84.59 ± 0.07 84.25 ± 0.11 83.38 ± 0.04
80.03 ± 0.06 79.78 ± 0.07 81.00 ± 1.41 80.00 ± 0.05 79.79 ± 0.12 49.24 ± 12.90
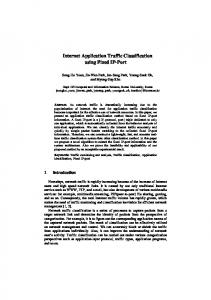
Neural network architecture of the ELM method.
vectors of the training datasets are mapped onto [−1, 1] as: B. Extreme Learning Machine Algorithm
(p)
(p)
Huang et al., [8] first proposed the extreme learning machine where the weights connecting the input and hidden layers with the bias terms are initialized randomly while the weights connecting the hidden and output layers are analytically determined. Therefore, the learning speed of the method is faster than the traditional gradient descent-based method. Research results indicate that ELM may learn faster than SVMs by a factor of thousands. Hence, the ELM algorithm is suitable for applications that require fast response and for real-time predications. Incremental extreme learning and weighted extreme learning machines are variants of ELM. Weighted ELM [35] is proposed to deal with imbalanced data by assigning a relatively larger weight for the input data arising from a minority class. In this paper, we use the ELM algorithm [36] whose neural network architecture is shown in Fig. 1, where [x1 , x2 , . . . , xd ] is the input vector; d is the feature dimension; f (.) is the activation function; W is the weight vector connecting the inputs to hidden units; [y1 , y2 , . . . , yd ] is the output vector; and β is the weigh vector connecting the hidden and the output units. The three datasets used to verify ELM’s performance are shown in Table III. The classification error rate Acc(Dtest ) for a trained model using the test dataset Dtest is calculated as: Acc(Dtest ) =
Nacc , Ntest
(2)
where Nacc is the number of correct classifications defined by the trained model while Ntest is the total number of samples in the test dataset. The optimal parameter NH is the number of hidden units. It is selected by a five-fold cross validation for each training dataset. The best testing accuracy was achieved by choosing 195 hidden units for each dataset. The input
xi
=2
xi − ximin − 1, ximax − ximin
(3)
(p)
where xi is the ith feature of the pth sample while ximin and ximax are the minimum and maximum values of the ith feature of the training sample, respectively. The training and testing accuracies of ELM for the three datasets with 37 features are shown in Table VI (top). For each dataset, 100 trials were repeated. The binary features 14– 33 (shown in Table II) are then removed to form a set of 17 features. Performance of the ELM algorithm is shown in Table VI (bottom). The results obtained by combining fuzzy rough sets and the ELM algorithm with various subsets of features are shown in Table VII. We use fuzzy rough sets to select features from the original set of 37 or 17 features and then use ELM to perform classification. The testing accuracy is higher than in the case of using the decision tree algorithm. The experimental results indicate that ELM achieves satisfactory performance when applied on Dataset 1 (Slammer + Nimda) used to test Code Red I and Dataset 2 (Slammer + Code Red I) used to test Nimda. However, it performs poorly on Dataset 3 (Nimda + Code Red I) used to test Slammer. ELM obtains similar results when used with the three datasets with either 37 or with 17 features, as shown in Table VI. In both cases, the accuracy is very low for Dataset 3. However, using fuzzy rough sets with ELM may improve this accuracy, as observed by comparing Table VI and Table VII. BGP datasets may be imbalanced because they predominantly contain regular samples rather than anomalies. Hence, weighted ELM may be used to deal with the data imbalance by assigning larger weights to samples in the minority (anomaly class), which may improve the classification accuracy.
V.
C ONCLUSION
In this paper, we investigated BGP anomalies and proposed techniques for their detection. We described methods based on decision tree and fuzzy rough sets for feature selection and attribute reduction. They select a subset of features important for classification. We then used the decision tree and ELM to classify Internet anomalies and conducted experiments on datasets with various number features. Performance of classifiers greatly depended on the employed datasets. Combinations of the three datasets (Slammer, Nimda, and Code Red I) resulted in different testing accuracies. When the testing accuracy of the classifiers was low, feature selection algorithms were used to improve the performance of classifiers. For smaller datasets, performance of the ELM classifier was improved by using fuzzy rough sets for feature selection. Both decision tree and ELM are relatively fast classifiers with satisfactory accuracy and may be used for online classification. Datasets used in this paper are examples of known anomalies that proved useful for developing anomaly detection algorithms. Establishing benchmarks to be used for comparisons of anomaly classification, detection, and prediction tools remains an open research problem. ACKNOWLEDGMENT This research was supported by the China Scholarship Council and the Natural Sciences and Engineering Research Council of Canada Grant 216844-13. R EFERENCES [1]
[2]
[3]
[4]
[5]
[6] [7] [8]
[9]
[10] [11] [12]
T. Ahmed, B. Oreshkin, and M. Coates, “Machine learning approaches to network anomaly detection,” in Proc. USENIX Workshop on Tackling Computer Systems Problems with Machine Learning Techniques, Cambridge, MA, USA, May 2007, pp. 1–6. S. Deshpande, M. Thottan, T. K. Ho, and B. Sikdar, “An online mechanism for BGP instability detection and analysis,” IEEE Trans. Computers, vol. 58, no. 11. 1470–1484, Nov. 2009. J. Li, D. Dou, Z. Wu, S. Kim, and V. Agarwal, “An Internet routing forensics framework for discovering rules of abnormal BGP events,” SIGCOMM Comput. Commun. Rev., vol. 35, no. 4, pp. 55–66, Oct. 2005. F. Lau, S. H. Rubin, M. H. Smith, and Lj. Trajkovi´c, “Distributed denial of service attacks,” in Proc. IEEE Int. Conf. Syst., Man, and Cybern., SMC 2000, Nashville, TN, USA, Oct. 2000, pp. 2275–2280. C. Patrikakis, M. Masikos, and O. Zouraraki, “Distributed denial of service attacks,” The Internet Protocol, vol. 7, no. 4, pp.13–31, Dec. 2004. J. R. Quinlan, “Induction of decision trees,” Machine Learning, vol. 1, no. 1, pp. 81–106, Mar. 1986. Z. Pawlak, “Rough sets,” Int. J. Inform. and Comput. Sciences, vol. 11, no. 5, pp. 341–356, Oct. 1982. G. B. Huang, Q. Y. Zhu, and C. K. Siew, “Extreme learning machine: theory and applications,” Neurocomputing, vol. 70, pp. 489–501, Dec. 2006. G. B. Huang, X. J. Ding, and H. M. Zhou, “Optimization method based extreme learning machine for classification,” Neurocomputing, vol. 74, no. 1–3, pp. 155–163, Dec. 2010. (July 9, 2014) RIPE RIS raw data [Online]. Available: http://www.ripe.net/data-tools/. University of Oregon Route Views project [Online]. Available: http:// www.routeviews.org/. T. Manderson, “Multi-threaded routing toolkit (MRT) border gateway protocol (BGP) routing information export format with geo-location extensions,” RFC 6397, IETF [Online]. Available: http://www.ietf.org/rfc/rfc6397.txt.
[13] [14]
[15]
[16]
[17]
[18]
[19] [20]
[21]
[22]
[23]
[24]
[25]
[26] [27]
[28] [29] [30] [31]
[32]
[33]
[34]
[35]
[36]
(July 9, 2014) SQL Slammer worm [Online]. Available: http://pentesting.sans.org/resources/papers/gcih/sql-slammer-worm-101033. (July 9, 2014) Sans Institute. Nimda worm—why is it different? [Online]. Available: http://www.sans.org/readingroom/whitepapers/malicious/nimda-worm-different-98. (July 9, 2014) Sans Institute. The mechanisms and effects of the Code Red worm [Online]. Available: https://www.sans.org/readingroom/whitepapers/dlp/mechanisms-effects-code-red-worm-87. Y. Rekhter, T. Li, and S. Hares, “A Border Gateway Protocol 4 (BGP-4),” RFC 4271, IETF [Online]. Available: http://tools.ietf.org/rfc/rfc4271.txt. N. V. Chawla, N. Japkowicz, and A. Kotcz, “Editorial: special issue on learning from imbalanced data sets,” SIGKDD Explor. Newsl., vol. 6, no. 1, pp. 1–6, June 2004. X. Yang, Q. Song, and A. Cao, “Weighted support vector machine for data classification,” in Proc. IEEE Int. Joint Conf. Neural Netw., Montreal, QC, Canada, Aug. 2005, vol. 2, pp. 859–864. C. F. Lin and S. D. Wang, “Fuzzy support vector machines,” IEEE Trans. Neural Netw., vol. 13, no. 2, pp. 464–471, Feb. 2002. N. Al-Rousan and Lj. Trajkovi´c, “Machine learning models for classification of BGP anomalies,” in Proc. IEEE Conference on High Performance Switching and Routing, HPSR 2012, Belgrade, Serbia, June 2012, pp. 103–108. G. H. John, R. Kohavi, and K. Peger, “Irrelevant features and the subset selection problem,” in Proc. Int. Conf. Machine Learning, New Brunswick, NJ, USA, July 1994, pp. 121–129. M. N. A. Kumar and H. S. Sheshadri, “On the classification of imbalanced datasets,” Int. J. Comput. Applicat., vol. 44, no. 8, pp. 1–7, Apr. 2012. N. Al-Rousan, S. Haeri, and Lj. Trajkovi´c, “Feature selection for classification of BGP anomalies using Bayesian models,” in Proc. Int. Conf. Mach. Learn. Cybern. 2012, Xi’an, China, July 2012, pp. 140– 147. X. Z. Wang and C. R. Dong, “Improving generalization of fuzzy if-then rules by maximizing fuzzy entropy,” IEEE Trans. Fuzzy Syst., vol. 17, no. 3, pp. 556–567, June 2009. X. Z. Wang, L. C. Dong, and J. H. Yan, “Maximum ambiguity based sample selection in fuzzy decision tree induction,” IEEE Trans. Knowl. Data Eng., vol. 24, no. 8, pp. 1491–1505, Aug. 2012. L. Breiman, “Bagging predictors,” Machine Learning, vol. 24, no. 2, pp. 123–140, Aug. 1996. L. Rokach and O. Maimon, “Top-down induction of decision trees classifiers—a survey,” IEEE Trans. Syst., Man, Cybern., Applications and Reviews, vol. 35, no. 4, pp. 476–487, Nov. 2005. (July 9, 2014) C5 [Online]. Available: http://www.rulequest.com/ see5-info.html. L. A. Zadeh, “Fuzzy sets,” Inform. and Control, vol. 8, no. 3, pp. 338– 353, Aug. 1965. M. N. Morsi and M. M. Yakout, “Axiomatics for fuzzy rough sets,” Fuzz. Sets Syst., vol. 100, no. 1–3, pp. 327–342, Nov. 1998. Q. H. Hu, L. Zhang, S. An, D. Zhang, and D. R. Yu, “On robust fuzzy rough set models,” IEEE Trans. Fuzzy Syst., vol. 20, no. 4, pp. 636–651, Aug. 2012. A. M. Radzikowska and E. E. Kerre, “A comparative study of fuzzy rough sets,” Fuzzy Sets and Systems, vol. 126, no. 2, pp. 137–155, Mar. 2002. D. S. Yeung, D. G. Chen, E. C. C. Tsang, J. W. T. Lee, and X. Z. Wang, “On the generalization of fuzzy rough sets,” IEEE Trans. Fuzz. Syst., vol. 13, no. 3, pp. 343–361, June 2005. H. X. Zhao, H. Xing, and X. Wang, “Two-stage dimensionality reduction approach based on 2DLDA and fuzzy rough sets technique,” Neurocomputing, vol. 74, pp. 3722–3727, Oct. 2011. W. Zong, G. B. Huang, and Y. Chen, “Weighted extreme learning machine for imbalance learning,” Neurocomputing, vol. 101, pp. 229– 242, Feb. 2013. (July 9, 2014) Extreme Learning Machines [Online]. Available: http://www.ntu.edu.sg/home/egbhuang/elm codes.html.