application was programmed using C#.NET. ... application interface windows codes to be run into ArcMap GIS ..... G. E. Sherman, "Desktop GIS: Mapping.
Basrah Journal of Science
Vol.31(2),110-119, 2013
Classification of GIS Image using GLCM and Neural Network
Tawfiq A. Alasadi
Wadhah R. Baiee
Babylon University
Babylon University
Dean of Computer Technology College
College of Science ,Computer Department
Abstract: GIS can hold agricultural regions data like forest, fruit covered lands and/or cultivate lands, these lands have been managed inside GIS by receiving a selected region remotely sensed image, so GIS users must have an appropriate digital map that represents theses lands each one according to its owner, status, and some other data. Normally, in such system, these lands will be classified by the users according to agricultural status depending on human vision. So, hardly to the users to classify these lands manually, and this become a great problem which take a long time depending on human efforts, especially if there is a huge number of lands. The suggested study creates a new ArcMap GIS tool which classifies these given lands automatically. Thus, this tool runs the developed system application; it will gather required information for each one of selected land, by sampling sub-images from their centers depending on the digital map, and gathers related status information from attribute database. On the next stage, the system will extract a vector of textural features for each one of the selected lands from their image samples using second order statistics Gray Level Co-occurrence Matrix (GLCM) and calculate eight textural features for each one of three visible bands (RGB) for each land sample. That vector of features will become the input to supervised multi-layer perceptron with backpropagation neural network classifier which be learned depending on recommended GIS user training data set. As a result the system has accuracy near to 75%; these results were achieved by comparing the classification results from system test trials with desired user classification data.
Introduction:
observation or entity and attribute or variable.
Geospatial data has both spatial and thematic
GIS have to be able to manage both elements.
components. Conceptually, geographic data
Spatial component, the observations have two
can
aspects
be
broken
up
in
two
elements: 110
in
its
localization,
absolute
Classification of GIS …
Tawfiq A. Alasadi and Wadhah R. Baiee localization based in a coordinates system and
derived from one level discrete wavelet
topological relationship referred. A GIS is
transform coefficients and global statistical
able to manage both while computer assisted
features computed from three level wavelet
cartography packages
the
transformed images. Y. Zhang et al. [44]
absolute one. The aim of classification is to
proposed a hybrid classifier for polarimetric
link each object or pixel in the study area to
SAR images, the feature sets consist of span
one or more elements of a user-defined label
image, the H/A/α decomposition algorithm,
set, so that the radiometric information
and the GLCM-based texture features. Then,
contained in the image is converted to
a probabilistic neural network (PNN) was
thematic information, The process can be
adopted for classification. E. S. Flores et al
regarded
[11] used GIS techniques to improve the
as
a
only manage
mapping
function
that
constructs a linkage between the raw data and
classification
the user-defined label set. Two types of
extraction algorithm
classification
change detection in a deciduous forest
are
commonly
performed.
capabilities
of
a
feature
for land use/cover
Supervised classification methods which are
environment.
based upon prior knowledge of the number
Proposed System Environment:
and certain aspects of the statistical nature of
For programming issues, the proposed system
the spectral classes with which the pixels
application was programmed using C#.NET.
making up an image are to be identified, and
The agricultural lands classification tool
unsupervised classification methods which
which is the proposed system application tool,
are performed by running a classification
it was added to ArcMap GIS as a new GIS dll
algorithm
of
this file contains the application classes code
spectral classes of interest. Texture is also an
for the proposed system and also, the
innate property of objects. It contains
application interface windows codes to be run
important information about the structural
into ArcMap GIS software, it become a
arrangement of surfaces. The use of texture in
portable application; it can be used by any
addition to spectral features for image
machine which has installed ArcMap GIS
classification might be expected to result in
software.
some
improvement,
The agricultural lands had been covered by
depending on the spatial resolution of the
polygons vector layer previously. These lands
sensor and the size of the homogeneous area
represented now by real world satellite image
being classified. R. Methre et al. [38]
in the raster layer. The user entered only 20
investigated
lands information to the database according to
without
level
of
the
any
predefinition
accuracy
texture
retrieval
using
combination of local features of Haralick
his 111
classification
decisions
to
be
the
Basrah Journal of Science
Vol.31(2),110-119, 2013
recommended data set for learning purpose,
related
and the remaining lands without information;
database is required for the classification
the system will classified them later.
learning reason, so this information is located
Information Gathering from GIS database:
in attribute database table. Collected values
The system will clip a colored image with
represent the agriculture status for each land,
three bands from underneath the polygon to
this value will become the classifier learning
be the raster image sample of that polygon
desired output for each related extracted land
(region) and will go to the textural feature
object. Now we have gathered information for
extraction stage, we proposed in this research
each studied land represented by (Land ID,
to clip an image window of size equal to (100
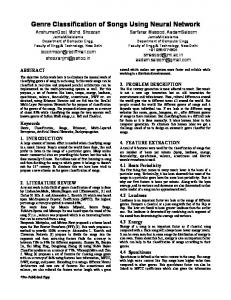
Image Sample, and Current Status). Figure (1)
* 100) pixels for each studied lands. The
illustrates the block diagram of the proposed
sample is clipped from the center of the
system .
Stage 1 : GIS system construction (raster, vector, database).
polygon.
The
information
Stage 4: Textural Features Extraction for each sample.
Stage 2: Engine linkage between ArcMap GIS and Microsoft Visual Studio (C#.NET).
Stage 5: Artificial Neural Network classifier.
Stage 6: GIS database update for each land with new data.
Stage 3 : Information gathering from GIS Data (Raster Samples, Vector map , Database).
Figure (1) : Block diagram of the proposed system.
112
from
Classification of GIS …
Tawfiq A. Alasadi and Wadhah R. Baiee GLCM and Textural Features:
between gray levels i and j at a particular
Texture feature extraction technique based on
displacement distance d and at a particular
the gray-level co-occurrence matrix (GLCM),
angle 𝜃. Instead of using the frequency values
sometimes called the gray-tone spatial-
in a GLCM directly, it is common practice to
dependency matrix. The principal concept of
normalize them to the range [0, 1] to avoid
GLCM is that the texture information
scaling effects.
contained in an image is defined by the
Eight textural features was extracted in
adjacency relationships that the gray tones in
proposed system for each visible band from
an image have to one another. The matrix
each land sample to be the vector of features
element P (i, j | d,𝜃) contains the second order
which represented the entire land sample.
statistical probability values for changes
Mathematically, those features can be represented as follows: Angular Second Moment ASM =
𝐺−1 𝑖=0
𝐺−1 𝑗 =0
2
𝑃 𝑖, 𝑗
… … … (𝐸𝑞. 1)
Contrast 𝐺−1 𝑖=0
𝐺−1 2 𝑛=0 𝑛
CONTRAST =
𝐺−1 𝑗 =0 𝑃
𝑖, 𝑗 ,
𝑖−𝑗 =𝑛
… … … (𝐸𝑞. 2)
Inverse Difference Moment IDM =
𝐺−1 𝑖=0
1 𝐺−1 𝑗 =0 1+(𝑖−𝑗 )2
𝑃 𝑖, 𝑗 … … … (𝐸𝑞. 3)
Entropy 𝐺−1 𝑖=0
ENTROPY = −
𝐺−1 𝑗 =0 𝑃
𝑖, 𝑗 × log (𝑃 𝑖, 𝑗 … … … (𝐸𝑞. 4)
Correlation CORRELATION =
𝐺 −1 𝑖=0
𝐺 −1 𝑗 =0
𝑖−𝜇 𝑖 (𝑗 −𝜇 𝑗 )
… … … (𝐸𝑞. 5)
𝜎𝑖 𝜎𝑗
Cluster Shade : SHADE =
𝐺−1 𝑖=0
𝐺−1 𝑗 =0
𝑖 + 𝑗 − 𝜇𝑖 − 𝜇𝑗
3
× 𝑃 𝑖, 𝑗 … … … (𝐸𝑞. 6)
Cluster Prominence : PROMINENCE =
𝐺−1 𝑖=0
𝐺−1 𝑗 =0
𝑖 + 𝑗 − 𝜇𝑖 − 𝜇𝑗
4
× 𝑃 𝑖, 𝑗
Haralick Correlation HARRALICK =
𝐺 −1 𝑖=0
𝐺−1 𝑗 =0
𝑖𝑗 𝑃 𝑖,𝑗 −𝜇 𝑥 𝜇 𝑦 𝜎𝑥 𝜎𝑦
… … … (𝐸𝑞. 8)
113
… … … (𝐸𝑞. 7)
Basrah Journal of Science
Vol.31(2),110-119, 2013
ANN Classifier:
connected net.
Each land object has its own vector of textural
nodes each node take one feature of the
features that describes the properties of
textural features contained in input vector.
object. These features become the input to the
Hidden Layer has 52 hidden nodes (This
ANN classifier. The neural network which be
number is practically chosen by made many
used in the system is multilayer perceptron
training trials on system classifier even to
with supervised backpropagation algorithm.
reach to highest system accuracy). Output
ANN classifier consists of three main layers
nodes have 2 nodes (Selected lands has 4
(Input layer, one Hidden layer, and Output
classes (types)). 20 recommended samples
layer), it can be shown as 24|52|2 completely
were chosen to learn the classifier.
Test and Results:
accuracy of classification. All trials have been
The system collects lands information from
applied on the system classifier using
GIS. The collected data are saved in system
different parameters with each trial will be
database buffer for 240 lands which covered
list, these parameters are the ANN parameters
by polygons in GIS pre-built user system.
such as : momentum , learning rate, sigmoid
These lands data are also sampled, and the
alpha value , error limit , number of hidden
system calculated their textural features and
layer's nodes, threshold value, and the angel
save them in system database buffer and they
of
were ready to test by the classifier. Here we
features..Table (1) lists the extracted texture
describe the practical way which be used to
features from one land, and table (2) lists all
choose the appropriate parameters to be
trials and their specifications.
the
Input layer has 24 input
GLCM
of
related
applied on system classifier raising the Table (1): Example of 24 features extraction for one selected land sample. Features /
Red 90
Green 90
Blue 90
Entropy
0.5604390
0.5069230
0.5701910
Correlation
0.9642070
0.9657530
0.9599290
Haralick
0.0227320
0.0147750
0.0159920
IDM
0.4424280
0.5288610
0.4242930
Cluster Shade
0.0001710
0.0001110
0.0001130
Cluster Prominence
0.0004850
0.0005730
0.0003210
ASM
0.0005730
0.0003210
0.0006050
Contrast
0.0006370
0.0010780
0.0005210
Bands(Angle)
114
textural
Classification of GIS …
Tawfiq A. Alasadi and Wadhah R. Baiee
1 2 3 4 5 6 7 8 9 10 11 12 13 14 15 16 17 18 19 20 21 22 23 24 25 26 27 28 29 30 31 32 33 34 35 36 37 38
0 0 0 0 0.1 0.1 0.1 0.1 0.1 0.1 0.1 0.1 0.2 0.3 0.05 0.1 0.1 0.1 0.1 0.001 0.0001 0.5 0.1 0.1 0.1 0.1 0.1 0.1 0.1 0.1 0.1 0.1 0.1 0.1 0.1 0.1 0.1 0.1
0.1 0.1 0.1 0.1 0.1 0.01 0.01 0.01 0.01 0.01 0.01 0.01 0.01 0.01 0.01 0.005 0.01 0.01 0.01 0.02 0.01 0.01 0.01 0.01 0.01 0.01 0.01 0.02 0.005 0.005 0.01 0.01 0.01 0.01 0.01 0.01 0.02 0.01
2 2 2 3 2 2 2 2 2 2 2 2 2 2 2 2 5 2 2 2 2 2 2 2 2 2 2 2 2 2 2 2 2 2 2 2 2 2
0.1 0.1 0.1 0.1 0.01 0.01 0.01 0.01 0.01 0.01 0.01 0.01 0.01 0.01 0.01 0.001 0.01 0.01 0.01 0.01 0.01 0.01 0.01 0.01 0.01 0.01 0.01 0.01 0.01 0.01 0.01 0.01 0.01 0.01 0.01 0.01 0.01 0.01
1128 1189 1117 1117 4334 38754 38754 40212 38094 40028 40321 40321 42066 49432 36323 424922 6530 41190 36299 17928 35815 78009 37887 41724 41593 38362 38963 19982 75138 85791 37677 37677 37677 37677 37677 37677 18447 37091
115
0.5 0.5 0.5 0.9 0.9 0.9 0.5 0.9 0.9 0.9 0.9 0.5 0.9 0.9 0.9 0.9 0.9 0.9 0.9 0.9 0.9 0.9 0.9 0.9 0.9 0.9 0.9 0.9 0.9 0.9 0.9 0.9 0.8 0.7 0.81 0.82 0.8 0.8
12 6 20 20 12 12 12 20 20 20 20 20 30 30 30 20 12 12 100 12 12 12 12 10 9 15 13 13 13 15 50 50 50 50 50 50 50 52
90 90 90 90 90 90 90 90 0 45 135 135 90 90 90 90 90 90 90 90 90 90 90 90 90 90 90 90 90 90 90 90 90 90 90 90 90 90
Accuracy%
GLCM angle
Hidden Nodes
Threshold
Iteration
Error Limit
Sigmoid alpha
Learning Rate
Momentum
Trial No.
Table (2): Training-Test trials for ANN classifier.
62.10045662 65.75342466 65.29680365 69.8630137 68.03652968 73.05936073 70.77625571 72.60273973 66.21004566 66.66666667 63.47031963 57.99086758 71.68949772 72.60273973 73.05936073 73.05936073 70.77625571 71.68949772 72.60273973 71.68949772 70.3196347 69.40639269 73.05936073 70.77625571 69.8630137 72.60273973 73.51598174 71.23287671 72.14611872 69.8630137 71.68949772 71.68949772 74.42922374 72.14611872 74.42922374 73.97260274 73.97260274 74.93771732
Basrah Journal of Science
Vol.31(2),110-119, 2013
The test with following data was chosen and ≅
These values with heist accuracy and low
:
iteration of ANN learning is taken from table
Momentum = 0.1, learning rate = 0.01 ,
(1) above. Table (3) illustrates a comparison
sigmoid alpha value = 2 , error limit = 0.01 ,
details between the classified types and shows
number of hidden layer's nodes = 52 ,
the identical accuracy of each land type with
threshold value = 0.8 , and the angel of the
user classification decisions.
produced
system
accuracy
75%
GLCM = 90o , learned with 37091 iterations.
Table (3): Results accuracy for each land type. Proposed System Classification
User Classification
Land Type not used houses
used
trees
total
Accuracy%
not used
45
6
10
2
63
71.42857143
houses
5
36
0
2
43
83.72093023
used
12
1
66
7
86
76.74418605
trees
0
6
3
19
28
67.85714286
total
62
49
79
30
220
74.9377
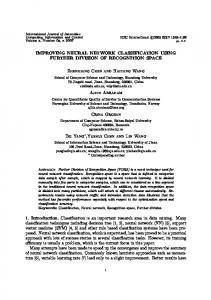
System accuracy is 74.94% compared with
not used lands , finally, 67.86% with trees
user classification data, these ratios were
lands. Figure (2) illustrates a compression
recommended by the test trials table, it is a
between system classification on studied
higher accuracy test ratio among the others
lands and the user classification, where figure
and depend it as a recommended results. And
(2.a) shows classified lands after apply the
the details of each type are shown in table (3)
proposed system on the test lands and picture
above, the system has a higher accuracy
(2.b) shows manually user classification on
83.72%
same selected lands.
with houses covered lands ,and
76.44% with used lands , and 71.43% with
116
Classification of GIS …
Tawfiq A. Alasadi and Wadhah R. Baiee
(a)
(b)
Figure (2): (a) System Classification , (b) User Classification.
Conclusions: The classification method that used in
References:
the proposed system doesn't depend on the
1. A. K. Sinha et al., "Fuzzy Neural Network
pixel color values for classification reasons,
Modeling of Land-Use /Cover using IRS-1D
instead;
Satellite Image", Map India Conference,
GIS
database)
is
data
(raster,
appointed
all
vector, together
and to
2004.
complete the classification requirements.
2. A. M. Coleman, "An Adaptive Landscape
Using textural features that extracted from
Classification
grey level co-occurrence matrix for each land
Geoinformatics
samples as the input to the supervised neural
Networks", MSc. Thesis; Faculty of Earth and
network classifier is more efficient than using
Life Sciences Vrije University, Amsterdam
classical way depending on individual pixel
The Netherlands, 2008.
color values only. GLCM with angel 90o is
3. B. Booth et al., "Getting Started with
the best among GLCMs with other angels (0o,
ArcGIS", Environmental Systems Research
o
o
Procedure and
Artificial
Using Neural
45 , 135 ) for extraction features to be used
Institute, 2001.
later
with
4. B. Tso et al., "Classification Methods for
multilayer perceptron with backpropagation
Remotely Sensed Data", Taylor & Francis
classifier.
Group, 2009.
in
supervised
classification
117
Basrah Journal of Science
Vol.31(2),110-119, 2013
5. C. H. Chen et al., "The Handbook of
Society for Photogrammetry & Remote
Pattern Recognition and Computer Vision",
Sensing (63) 635–646 , 2008.
World Scientific Publishing Co., 1998.
15.
6. C. Tucker, "ESRI using Arctoolbox" ,
Measures Computed from Gray Level Co-
Environmental Systems Research Institute,
occurrence Matrices ", University of Oslo,
2000.
1995.
7. D. Decker, "GIS Data Sources", John
16. F. Bachmann et al., "An Architecture
Wiley & Sons, 2001.
Based on Class Dependent Neural Networks
8. D. I. Verbila, "Practical GIS analysis",
for Object-based Classification", Institute for
Taylor & Francis Group, 2003.
Mine-Surveying and Geodesy, 2009.
9. D. L. Fitzgerald, "Landing Site Selection
17. F. Harvey, "A primer of GIS fundamental
for UAV Forced Landing Using Machine
geographic and cartographic concepts", The
Vision", PhD Thesis; School of Engineering
Guilford Press, 2008.
Systems;
18. G. E. Sherman, "Desktop GIS: Mapping
Queensland's
University
of
F.
Albregtsen,
"Statistical
Texture
Technology; Australia, 2007.
the Planet with Open Source Tools", The
10. E. Gose et al., "Pattern Recognition and
Pragmatic Bookshelf, 2008.
Image Analysis", Prantice Hall, 1997.
19. G. H. Landeweerd et al., ―The Use of
11. E. S. Flores et al., "GIS Improved Object-
Nuclear Texture Parameters in The Automatic
Based Classification For Land Use/Cover
Analysis
Change
of Leukocytes‖, Pattern Recognition; Vol. 10;
Detection
In
Human
Altere
Deciduousd Forest", The American Society
Pages (PP) 57-61, 1978.
for Photogrammetry & Remote Sensing 2009
20.
Annual Conference; Baltimore; Maryland,
Classification", MSc Thesis; College of
2009.
Scince; University of Babylon, 1999.
12.
E.
Stefanakis
Hypermedia:
et
al.,
Concepts
"Geographic
and
I.
N.
Ahmed,
"Digital
Image
21. I. T. Service, "Introduction to GIS using
Systems",
ArcGIS", Durham University, 2006.
Springer, 2006.
22. J. A. Anderson, "An Introduction to
13. E. W. Tennant, "Using ArcGIS to Create
Neural Networks", PHI Learning Private
Living
Limited, 2009.
Documents
with
Archaeological
Data", MSc. Thesis; Michigan Technology
23. J. L. Harris, "A Hierarchial Document
University, 2005.
Description and Comparition Method", Msc.
14. F. Aguera et al., "Using Texture Analysis
Thesis; Purdue University, 2003.
to Improve Per-pixel Classification of Very
24. K. C. Clearke et al., "Geographic
Hhigh Resolution Images for Mapping Plastic
Information
Greenhouses", ISPRS Journal of International
Modeling", Prentice Hall, 2009. 118
System
and
Environmental
Classification of GIS …
Tawfiq A. Alasadi and Wadhah R. Baiee 25. K. T. Changg, "Programming ArcObjects
35. R. C. Ghonzaliz et al., "Digital Image
with VBA", Taylor & Francis Group, 2008.
Processing", Prentice Hall, 2000.
26. L. Fausett, "Fundamentals of Neural
36. R. Kok et al., "Analysis of Image Objects
Networks:
from VHR Imagery for Forest GIS Updating
Architectures
Algorithms
and
Applications", Prantice Hall, 1994.
in The Bravian Alps", ISPRS, Vol. XXXIII;
27. M. Cheong et al., "An Approach to
Amsterdam, 2000.
Texture-Based
by
37. R. M. Haralick et al., "Textural Features
Deconstructing Multispectral Co-occurrence
for Image Classification", IEEE Transiction
Matrices
on Systems Vol. SMC-3 No. 6, 1973.
using
Image
Recognition
Tchebichef
Orthogonal
Polynomials ", IEEE, 2008 .
38. R. Methre et al., "Exploring Spatial
28. M. F. Insana et al., ―Analysis of
Information in Spectral Features for Texture
Ultrasound Image Texture via Generalized
Image Retrieval", International Journal of
Rician Statistics,‖ Optical Engineering , 1986.
Computer and Network Security Vol. 1; No.
29. M. S. Nixon et al., "Feature Extraction
3, 2009.
and Image Processing", Elsevier, 2008.
39.
30. N. R. Chrisman, "Exploring Geographic
Classification Using Wavelet Transforms.‖,
Information Systems", John Wiley and Sons,
Pattern Recognition Letters 24; 2003
1997.
40. S. Carver, "Innovations in GIS", Taylor &
31. O. Dassau et al., "GIS for Educators Topic
Francis e-Library, 2005.
3: Vector Attribute Data", Spatial Planning &
41. S. Haykin, "Neural Networks and
Information; Department of Land Affairs;
Learning Machines", PHI Learning Private
Eastern Cape; South Africa (DLA), 2009.
Limited, 2009.
32. O. Engler et al., "Introduction to Texture
42. S. K. Shah et al., "Image Classification
Analysis", Taylor & Francis Group, 2010.
Based on Textural Features using Artificial
33.
P.
Croswell,
"GIS
Design
and
S.
Arivazhagan
et
al.,
―Texture
Neural Network", IE (I) Journal ET, 2004.
Implementation Services", IT Consultants—
43. Y. C. Chen et al., ―Texture Features for
GIS Design and Implementation Services
Classification of Ultrasonic Liver Images‖,
Brochure, 2010.
IEEE ransactions on Medical; Vol.11; No. 2;
34. P. Ohanian et al., " Performance
Pages 141-151, 1992 .
Evaluation for Four Classes of Textural
44. Y. Zhang et al., "Remote-Sensing Image
Features‖, Pattern Recognition 25; 819-8133,
Classification
1992.
Probabilistic Neural Network", Sensors 9;
Based
pages 7516-7539, 2009.
119
on
an
Improved