INTERNATIONAL JOURNAL OF CIVIL AND STRUCTURAL ENGINEERING Volume 5, No 1, 2014 © Copyright by the authors - Licensee IPA- Under Creative Commons license 3.0
Research article
ISSN 0976 – 4399
Column slenderness computation and evaluation using finite element method and commercial software Mohammad I. Hossain1, Tahsin R. Hossain2 1- Assistant Professor, Department of Civil Engineering and Construction, Bradley University, Peoria, Illinois, USA. 2- Professor, Department of Civil Engineering, Bangladesh University of Engineering and Technology, Dhaka, Bangladesh
[email protected] doi: 10.6088/ijcser.2014050002 ABSTRACT In this study slender column was analyzed and evaluated using the Finite Element Method (FEM) modeling software ETABS and well-known commercial software PCACOL. First the slender column design methods described in ACI code were reviewed manually for one structural model. Then a manual calculation of the slender column design procedure was checked with ETABS. The ETABS result output was also verified with PCACOL. It was observed that ETABS was more conservative than PCACOL for determining Non-sway Moment Magnification Factor (δns). However, PCACOL was more conservative than ETABS for determining Sway Moment Magnification Factor (δs) value. Considering the non-sway column, the steel ratio is 9.22% greater in ETABS design output than PCACOL design output. PCACOL and ETABS used two different approaches to calculate δns as described or required by code. On the other hand, considering sway column, the steel ratio found in PCACOL was 79.60% higher than ETABS. ETABS performed P-∆ analysis approach but PCACOL used a code specified approach to calculate δs. Considering the different approaches followed by different structural analysis and design software, a designer should take care when using either software. Keyword: Finite element method, PCACOL, slenderness, sway, non-sway. 1. Introduction In order to accommodate a burgeoning population, scarcity of undeveloped land and an excessive increase in the cost of property in Bangladesh, it has now become essential to vertically extend buildings. For the above reasons many high-rise buildings are being constructed in major cities. In addition, the use of high strength materials and innovative design approaches made possible by design software has made it possible to configure smaller cross sections of structural members than has previously been possible. The most significant problems in the vertically extending building is the reduction of column section and increase the length of column without proper care of slenderness effect. This could make severe design fault (Hossain, 2008). Slender columns are those members whose ultimate load capacities are affected by the slenderness effect which produces additional bending stresses and/or instability of columns. A slender column has less strength than a short column of the same sectional area; hence it cannot withstand a heavier load as compared to a short column (Kumar, 2005). The slenderness increases greatly with increasing length when buckling under a gravity load
Received on June, 2014 Published on August 2014
15
Column slenderness computation and evaluation using finite element method and commercial software Mohammad I. Hossain, Tahsin R. Hossain
(Halder, 2007). Therefore, evaluation of a slender column involves consideration of the column length in addition to its cross section. Slender columns, when subjected to eccentric loading, show deflections. These deflections produce additional flexural stresses due to the increase in eccentricity by the amount of transverse deflection (∆). This is known as the P-∆ effect or "secondary moment". This secondary moment reduces the axial load capacity of slender column (Nilson et al., 2003). If the total moment, including the secondary moment, reaches the ultimate capacity of a section, the column fails owing to material failure. The parameters like column buckling effect, elastic shortening and secondary moment due to lateral deflection, which are not as important to the design of short column, must be considered for designing slender columns (Hassoun, 2005). If the column is very slender, it becomes unstable prior to reaching material failure. In this case instability failure occurs. Slenderness effects are more pronounced in columns of unbraced frames. Frames that do not have adequate bracing against lateral loads show excessive sway which jeopardizes the stability of columns. Adequate bracing in frames helps to stabilize secondary deformations at column ends and produces more stable columns. Because of the difference in behavior between a braced and an unbraced frame, columns are treated differently depending on the bracing conditions of their frames. 2. Objectives and methodology The objectives of this research work are to verify the slender column design procedure of ETABS and other available software as per provision of ACI code (318-99) and identify the limitations of the software specifically for slender column design. This study will help design engineers to execute accurate slender column design calculations and improve the use of structural analysis and design software. The design procedure of slender column has been described in section 10.0 of ACI code. The guidelines and methods for slender column design procedure provided in ACI Code is studied while preforming this research. Considering all possible loads (Wind, Earthquake etc.) one typical model of a high-rise building is developed by ETABS (Computers & Structures, 2003). ETABS is a Finite Element Method (FEM) modeling software that is being extensively used by engineers in the design of office buildings in Bangladesh. The design output of the ETABS is also checked by another available software PCACOL, which is capable of designing columns. Furthermore, the parameters of slender column calculation are checked manually with the help of PCACOL (Portland Cement Association, 1999). There are some exceptions in design procedure of ETABS and PCACOL in using equations for calculating some parameters. Those exceptions identify and check the variations. It should be noted that ACI code 318-99 was used to perform the study. The reason for using an old version of code is that the Bangladesh National Building Code (BNBC, 2006) was developed by following the old version of ACI code. BNBC revision is currently in the process of adopting and addressing the new ACI code. However, use of factors to magnify load magnitudes is still being used by the current and updated ACI code 318-11 in the Appendix sections. Moreover, the basic slender column design procedure has not been changed in the current edition of ACI code.
International Journal of Civil and Structural Engineering Volume 5 Issue 1 2014
16
Column slenderness computation and evaluation using finite element method and commercial software Mohammad I. Hossain, Tahsin R. Hossain
ETABS is a sophisticated, yet easy to use, special purpose analysis and design program developed specifically for building systems. ETABS Version 8.4.6 features an intuitive and powerful graphical interface coupled with unmatched modeling, analytical, and design procedures, all integrated using a common database. Although quick and easy for simple structures, ETABS can also handle the largest and most complex building models, including a wide range of nonlinear behaviors, making it the tool of choice for structural engineers in the building industry. PCACOL is column design software developed by “Portland Cement Association”. This software can analyze and design both sway and non-sway columns. The design procedure is similar to ETABS with some exceptions. 3. Mathematical review It is very important to understand the design steps, calculation procedures and idealness of software by which the study was done. By understanding the steps of software it will be easier for the designer to find out which steps are important and may need more attention at the time of design. The design information of the structural model has been divided into three different categories: basic information, loading information, and load combination used to analyze the design. All the categories are briefly described in the following paragraphs. 3.1 Basic information The building model that was prepared by ETABS for the mathematical review study is square and ten stories high. There are three panels in each direction each are 20'-0" (6096.0 mm) apart. The structure has modeled as beam-column frame type with shear walls in the middle position of the building. So, according to BNBC the structure can be classified as dual system; more specifically, a concrete with concrete IMRF (Intermediate Moment Resisting Frame) building. The shear wall acts as a bracing of the building frame and reduces the sway of the building frame. The thickness of the shear wall is 9" (229.6 mm). The position of the stairwell is around the outside of the shear wall and connects with the shear walls and slab. The foundation is specified as fixed type and the foundation is shallow foundation. The height of the basement column is 5'-0" (1524 mm). The ground floor height is 17'-6" (5334.0 mm) and the other floor height is 12'-0" (3657.6 mm). The beams, other than grade beams, are 18" x 12" (457.2 mm x 304.8 mm) depth. The rectangular grade beams are 20" x 12" (505.0 mm x 304.8 mm) deep. The grade beam connects column to column and grade beam to share wall in order to transfer the ground shear force effectively. The clear cover of grade beam is specified as 2.5" (63.5 mm) whereas the regular beam clear cover is 1.5" (38.1 mm). The slab is monolithic with beams and 6" thick (152.4 mm). The dimensions of the various columns are: corner columns 14" x 14" (355.6 mm x 355.6 mm), edge columns 16" x 16" (406.4 mm x 406.4 mm) and inner columns 18" x 18" (457.2 mm x 457.2 mm). So, all the columns are square. The clear cover of the concrete column is 1.5" (38.1 mm). The compressive strength of concrete is 4.0 ksi (27.6 MPa), strength of steel is 60.0 ksi (413.7 MPa) and modulus of steel is 29,000.0 ksi (200.0E3 MPa). According to BNBC the site soil characteristics are considered as S3. The building is situated in Dhaka city and it is a commercial building. The design parameters were chosen according to those suitable for commercial buildings standing in Dhaka. As it is a commercial building, BNBC classified it as a standard occupancy structure and ranked the structural importance category as IV. International Journal of Civil and Structural Engineering Volume 5 Issue 1 2014
17
Column slenderness computation and evaluation using finite element method and commercial software Mohammad I. Hossain, Tahsin R. Hossain
3.2 Loading information Normally in Dhaka city a building experiences two types of loads. One is gravity load, the other is environmental load. Gravity loads come from self-weight of the building and imposed vertical loads on the building. In Bangladesh only wind load and earthquake load are taken as environmental loads. The combined presence of wind load and earthquake load is unlikely. A minimum amount of wind load is always present on a structure which turns peak value at the time of storm. Although the presence of earthquake load is only occasional, when it occurs it is the t most devastating. The dead load calculated from the slab is 75 psf (3.6E-3 MPa). Dead load imposed through floor finish is 20 psf (9.6E-4 MPa) and dead load coming from partition and boundary walls has assumed as much as 30 psf (1.4E-3 MPa). As the building is considered a commercial building the loads from false ceilings and other service facilities are consider as 10 psf (4.8E4 MPa). So, total dead load imposed on the structure is 60 psf (2.8E-3 MPa). Some designer may consider the partition wall load as live load for a commercial building because the partition wall can be rearranged depending on occupancy. In this model for simplification the partition wall load is considered as dead load. The live load coming to the building is considered as 60 psf (2.8E-3 MPa). According to BNBC, for a residential building the live load is fixed as 40 psf (1.9E-3 MPa). For other public buildings the live load varies from 75 to 150 psf (3.6E-3 to 7.2E-3 MPa). From a practical point of view the live load is consider more than residential but lower that intense public gathering places. From the BNBC table titled “Basic wind speeds for selected locations in Bangladesh” the Basic Wind Speed (Vb) is selected 130.5 mph (210 km/hr). The exposure type is selected as “Exposure A” because the building is sited in an urban area. The windward coefficient is calculated as 1.4 from the BNBC article titled “Overall pressure coefficient (Cp) for rectangular building with flat roofs”. Because the structure is ranked as standard occupancy structure, the corresponding value of Structural Importance Coefficient (CI) equals to 1.00. The wind load is acting on four faces of the building. From a Seismic Zone Map of Bangladesh, the Seismic Zone Coefficient (Z) is taken as 0.15 corresponding seismic zone 2. The Response Modification Coefficient for Structural Systems (R) is taken as 9 for both directions of the building. Structural Importance Coefficient is taken as 1.00 for earthquake analysis which is same as wind load analysis. The earthquake force is acting from both directions of the building which has considered for more practical consideration. The Structural Period is intended from “Method A” that is described in BNBC. 3.3 Load cases In the model static load cases like dead load (DL), live load (LL), wind load X direction (WLx), wind load Y direction (WLy), earthquake load X direction (EQx), earthquake load Y direction (EQy) are used. For applying wind load and earthquake load the automation feature of software has been used. Wind and earthquake loads are applied perpendicular to the building axis. For simplicity, no eccentric loads have been applied to the model. 4. FEM models This FEM model has been developed using ETABS. There are six grids in each direction, four of them are primary grids and two of them are secondary grid. The primary grids are 20'International Journal of Civil and Structural Engineering Volume 5 Issue 1 2014
18
Column slenderness computation and evaluation using finite element method and commercial software Mohammad I. Hossain, Tahsin R. Hossain
0" (6096.0 mm) apart which produces 60'-0" (18288.0 mm) frame size. The grid spacing is the same in two directions. After defining the grid data, custom story data are defined. First only two stories are defined. The first story (story-1) is ground floor with grade beams only and the second story (story 1-1) is the floor with beams. The ground floor story is 17'-6" (5334.0 mm) high and the other story is 12'-0" (3657.6 mm) high.
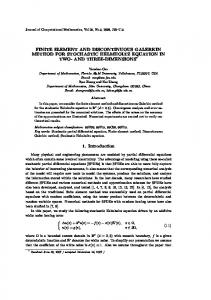
C4
(a) Plan
C5
(b) Elevation
Figure 1: Plan and Elevation of FEM model (Dimension in feet) After defining the first two stories, the next step is to define the beam and column dimension as well as define member parameters. The columns, beams and shear walls are drawn along the layout plan. After drawing the beams, columns and shear walls, the plan view of story 1-1 looks like Figure 1(a). The floor slabs are drawn by connecting column to column. The floor slabs and shear walls are generated by using an auto mesh feature of software. 4 'x 4' (1219.2 mm x 1219.2 mm) meshing is used up to the beam line. The slab has been modeled as a shell member. The stair model is simplified and modeled as a slab connecting to the share wall and surround beams. The supports are assigned as fixed type support. All the slabs are assigned for diaphragm action to minimize relative displacement. After completing the second floor slab the model is extended up to ten stories by inserting a new story. The other nine stories duplicate the property of story-1-1. Because each story reproduces the properties of story 1-1, they are designated story 1-2, story 1-3, and so on. The special seismic data has been omitted and mass source only from load has been selected in ETABS because the building has been designed as sway intermediate moment resisting frame. The self-weight of building is automatically calculated and incorporated by the software. The environmental load data inputs in the model by using code Uniform Building Code (UBC, 1994). There are some differences in code UBC and BNBC. For example the exposure type of building in ETABS is B, but according to BNBC it is A. For X-direction International Journal of Civil and Structural Engineering Volume 5 Issue 1 2014
19
Column slenderness computation and evaluation using finite element method and commercial software Mohammad I. Hossain, Tahsin R. Hossain
wind load the wind direction angle is 0 (zero) degree. Windward coefficient has been calculated from BNBC and obtains 1.4. Leeward coefficient is negligible and just input for software needful. The exposure height is considered from story-1 to story-1-10. Since the story under grade beam is below soil level it is not influenced by wind load. The structural importance factor is taken from BNBC specification and for this building it is 1.00. Same data table is prepared for Y-direction wind load except the wind direction angle assigned is 90 degrees. UBC seismic loading parameters are assigned for earthquake load data input. The seismic load parameters can be defined as BNBC. There is an option for assigning the direction of eccentricity. Two data tables are created, one for X-direction earthquake load and other for Y-direction earthquake load. For time period calculation, the value calculated from Method-1 is from BNBC. Here the noticeable detail is that the Ct value input is measured in ft. whereas in BNBC the value comes in terms of meters. Taking into account the base shear force acts on foundation level the story ranges are from base to story-1-10. The numerical coefficient (Rw) is taken as 9.0 because the building is considered as dual system with concrete IMRF. The seismic zone factor is user defined and soil coefficient is matched with BNBC value. The important factor is classified from BNBC specification. Floor load has been provided for homogeneous behavior of all members of the structure. All the members (i.e. beams and column etc.) have been satisfied for their maximum allowable loads for most critical condition. The columns that are checked by calculation are marked on Figure 1(b). C4, a corner column, and C5, an edge column, are selected for calculations and verifications. 5. Results and discussions 5.1 Calculation check manually for δns When the slenderness of column predominantly depends on gravity load effect it is known as Non-sway Moment Magnification Factor, δns. The increase of dead and live load is directly influenced in this type of slenderness behavior. This step involves checking one column, i.e. edge column (C5) of periphery frame. In edge column the value of magnification factor is different for two axes of column. The basic moment and load data have been achieved from ETABS software calculation. C5 column is checked for design load combination 1.4DL+1.7LL. δns predominantly depends on dead load, live load, and the combined load of the two. The major and minor moment of edge column is not the same for dead and live load because of the position of the column and non-symmetric biaxial moment distribution. The non-sway values have been checked top of the column location. The column height is 17'-6" (5334.0 mm) and the clear height of the column measures from bottom face of beam in story-1-1 to top face of grade beam in story-1. In calculation of slenderness ETABS considers Effective Length Factor (k) as 1.0 for non-sway frame. The k factor noticeably changed for sway frame, i.e. steel building. By considering k equals to 1.0, ETABS basically designs concrete buildings in a very conservatively.. The actual value is usually less than 1.0. For analysis of slenderness the k factor is always considered as 1.0 to take the advantage of automatic design phenomena even though the value could be overwritten at any time after the analysis and design for a particular column. To determine the δns value for C5 column the geometric and load data information has been directly recorded from ETABS: column dimension = 16" x 16" (406.4 mm x 406.4 mm), International Journal of Civil and Structural Engineering Volume 5 Issue 1 2014
20
Column slenderness computation and evaluation using finite element method and commercial software Mohammad I. Hossain, Tahsin R. Hossain
beam dimension = 18" x 12" (457.2 mm x 304.8 mm), and design load, Pu = 684.785 kip (3.0E6). At station location 16'-0" (4876.8 mm) and for load combinations the major and minor axis moments are presented in Table 1. Table 1: Service loads and moments for column C5 Load type Dead Live
Major axis moment, M3 kip-ft (N-mm) -1.171 (-1.6E6) -0.428 (-0.6E6)
Minor axis moment, M2 kip-ft (N-mm) 17.330 (23.5E6) 6.914 (9.4E6)
Member load kip (N) -350.63 (-15.6E6) -114.06 (-0.5E6)
M3ns = 1.4 × (− 1.171) + 1.7 × (− 0.428) = −2.367 kip - ft. M2ns = 1.4 × (17.330) + 1.7 × (6.914) = 36.016 kip - ft Minimum moment = Pu × (0.6 + 0.03 × h ) = (684.785 × (0.6 + 0.03 × 16)) ÷ 12 = 61.631 kip-ft.
(1) (2) (3)
Here h is the minimum dimension of column. As the column is square in shape the minimum moment is same for major and minor axis. As minimum moment is larger than the actual acting moment, therefore minimum moment governs for both axes. For column design, major axis moment is considered. When the minimum moment governs, ETABS shows the major axis moment (M3) equals the minimum moment, but minor axis moment (M2) remains unchanged. The primary moment at the top and bottom location of member is illustrated in Table 2. The subsequent calculation depends on these moments. Table 2: Location wise (top & bottom) moment in C5 column Type of moment Major axis moment, M3, kipft (N-mm) Minor axis moment, M2, kipft (N-mm)
Location of moment At height 0.0 ft. At height 16.0 ft. -2.370 (-3.2E6)
0.830 (1.1E6)
-18.210 (-24.7E6)
36.020 (48.8E6)
Moment correction factor, M1 0.830 Cm (3) = 0.6 + 0.4 ≥ 0.4 = 0.6 + 0.4 × = 0.460 > 0.400 = 0.460 M2 − 2.370 M1 − 18.210 Cm (2) = 0.6 + 0.4 ≥ 0.4 = 0.6 + 0.4 × = 0.398 < 0.400 = .0400 M2 36.020 Stiffness reduction factor, (1.4 × dead load ) (1.4 × −350.63) βd = = = 0.717 (1.4 × dead load + 1.7 × live load ) (1.4 × -350.63 + 1.7 × -114.06) Flexural stiffness of compression member, 16 × 16 3 0.4 × 3.6 × 10 6 × 12 0.4 EcIg EI = = = 4.580 × 10 9 in2-lb 1 + βd (1 + 0.717) Critical buckling load,
International Journal of Civil and Structural Engineering Volume 5 Issue 1 2014
(4) (5)
(6)
(7)
21
Column slenderness computation and evaluation using finite element method and commercial software Mohammad I. Hossain, Tahsin R. Hossain
(
)
Π 2 × 4.580 × 10 9 ÷ 1000 = 1226.20 kip = (kl )2 (1 × 16 × 12)2 Non-sway Moment Magnification Factors, Cm 0.460 = 1.801 δns (3) = = Pu 684.785 1 − 1 − 0.75Pc 0.75 × 1226.20 0.400 = 1.566 δns (2) = 684.785 1 − 0.75 × 1226.20 Design moment, M3 = 1.801 × 61.631 = 110.997 kip - ft Design moment, M2 = 1.566 × 36.016 = 56.401 kip - ft The calculated values matched with result outputs of ETABS model. Pc =
π 2 EI
(8)
(9)
(10)
(11) (12)
5.2 Calculation check by PCACOL for δns The steps to calculate column forces and other parameters by PCACOL are provided below. Step-1: provide general information: the data that is required by this step is primary unit, design code, option for slenderness and design moment application (i.e. biaxial or uniaxial). In Step-2: material properties: concrete strength, steel strength and basic properties of concrete have to provide in this step. Only concrete strength and steel strength is required the other value i.e. elasticity, beta, ultimate strength automatically calculated by the software. In step-3: sectional properties: width and length of column are the input parameters. Because the column is uniform in length no increment value is needed. In step-4: reinforcement information: The limit of minimum and maximum size of reinforcement and number of bars which should be checked by the software has to be provided in this step. Additional information such as clear cover, layout of column reinforcement has to be provided. The minimum and maximum bar No. and size can’t be equal. If any invalid data is given, a warning is indicated. In step-5: slenderness option input: since consideration of slenderness has been checked in step 1,, the slenderness parameters have to be provided in this step. The structure is modeled as braced against sideway and the k factor provided is 1.0 because ETABS consider k factor as 1.0 in case of sway intermediate frame. In step-6: basis loads and moments input: the column is checked for non-sway conditions so, the dead load and live load parameter is essential. These basic loads are imported from ETABS calculation. For inputting the moment data, one factor should be noticed - all the data are positive value because the deflection shape is double curvature and creates positive moment at the end of the column. This data input has been recommended by PCACOL guideline. The moment data presentation is different for ETABS and PCACOL software. In step-7: load combination: only factored dead load and live load combination are used for calculation in the selected column analysis for not-sway moment. No lateral load is considered. The default option of other lateral load combination is deleted because of the simplicity of analysis. The parameters calculated by PCACOL for δns for two axes are presented in Table 3. It is notable that the value of Pc for X and Y axis, δns for X axis and δns for Y axis differs from the calculation that is achieved from ETABS calculation output. This is the result of using one formula of EI that is differing from ETABS.
International Journal of Civil and Structural Engineering Volume 5 Issue 1 2014
22
Column slenderness computation and evaluation using finite element method and commercial software Mohammad I. Hossain, Tahsin R. Hossain
Table 3: Parameters for δns factors by calculating PCACOL Parameters Cm for X-axis Cm for Y-axis βd for X and Y axis Pc for X and Y axis δns for X axis δns for Y axis
Value 0.400 0.460 0.717 1569 kip 1.000 1.101
The equation of EI that is used by PCACOL is: 0.2 EcIg + EsIse EI = 1 + βd
(13)
Flexural stiffness of compression member, 16 × 16 3 0.2 × 3605 × + 29000 × 8 × 0.79 × 5.625 2 + 29000 × 4 × 0.79 × 1.875 2 12 EI = 1 + 0.717 1.0059 × 10 7 So, EI = = 5.858 × 10 6 in2-kip 1.717 Critical buckling load, π 2 EI Π 2 × 5.858 × 10 6 = 1568.36 kip Pc = = (kl )2 (1× 16 × 12)2 Non-sway Moment Magnification Factors, 0.460 Cm = 1.101 δns (Y) = = Pu 684.80 1 − 1 − 0.75Pc 0.75 × 1568.36 Cm 0.400 = 0.957 < 1.000 = 1.000 δns (X) = = Pu 684.80 1 − 1 − 0.75Pc 0.75 × 1568.36 The values matched with PCACOL result outputs those are shown in Table 3.
(
(
)
(
)
)
(
)
(14)
(15)
(16)
(17)
5.3 Result variation of ETABS & PCACOL for δns As ETABS and PCACOL use different formulas for calculating δns there are some differences in output values. These variations are shown in Table 4.
Table 4: Comparison between results of ETABS and PCACOL for δns calculation Parameters EI (in2-kip) Pc (kip) δns(Y or 3) δns(X or 2) % of steel
ETABS value 4.580 × 10 6 1226.20 1.801 1.566 4.079
PCACOL value 5.858 × 10 6 1568.36 1.101 1.000 3.703
International Journal of Civil and Structural Engineering Volume 5 Issue 1 2014
% difference (+) 27.9% (+) 27.9% (-) 38.87% (-) 36.14% (-) 9.22%
23
Column slenderness computation and evaluation using finite element method and commercial software Mohammad I. Hossain, Tahsin R. Hossain
From this table it is clear that ETABS design structure is very conservative. According to Nilson et. al (2003), for lightly reinforced member the use of Eq. (7) is more conservative but for highly reinforced members it is greatly underestimated. Eq. (13) is more reliable for the entire range of ρ (i.e. steel ratio) and definitely for medium and higher ρ value. There is no option for changing equation in ETABS and PCACOL. Even the value of EI and Pc cannot be overwritten by ETABS. Therefore this phenomenon is very important to design by ETABS and PCACOL.
5.4 Calculation check manually for δs This step involves checking of one column, i.e. corner column (C4) of periphery frame. Corner column is selected because of the lateral load influences on design of this column. The basic moment and load data has been calculated from ETABS software. It should be noted that there is no prescribed equation for determining δs in ETABS design manual. The designer has to run P-∆ analysis to determine the sway moment effect on column. C4 column is checked for design load 0.9DL-1.43EQy, which is a combination of dead load and earthquake load. The major and minor moment of edge column is identical for dead and live load because of the position of the column and symmetric biaxial moment distribution. The sway values are checked on the top of the column. The column height is 17′-6″ (5334.0 mm) and the clear height of the column is measured from bottom face of beam on story-1-1 to top face of grade beam on story-1. In calculating the slenderness ETABS consider Effective Length Factor (k) as 1.0 for sway frame. To determine the δs value for corner column the geometric and load data information has been directly recorded from ETABS: column dimension = 14" x 14" (355.6 mm x 355.6 mm), beam dimension = 18" x 12" (457.2 mm x 304.8 mm), and design load, Pu = 684.785 kip (3.0E6 N). At station location 16'-0" (4876.8 mm) and for load the ultimate load, maximum shear force and relative story drift is presented in Table 5.
Table 5: Parameters for designing stability index PARAMETERS Corner column Edge column Drift at bottom of column Drift at top of column
PU, KIP (N) V3, KIP (N) 221.25 (0.9E6) 2.41 (10.7E3) 385.63 (1.7E6) 3.74 (16.6E3) 0.045" (1.14 mm) 0.243" (6.17 mm)
To calculate the Stability Index for the periphery frame, the total ultimate load for column as well as the maximum shear force acting on column is required. In the periphery frame there are two corner columns and two edge columns. So, (18) ∑ Pu = 2 × 221.25 + 2 × 385.63 = 1213.76 kip
∑V = 2 × 2.41 + 2 × 3.74 = 12.3 5 kip
(19)
Stability index, ∑ Pu × ∆0 = (1213.76 × (0.243 − 0.045)) = 0.093 > 0.05 Q= (12.3 × 17.5 × 12) ∑ V × lc So, the frame is sway frame.
(20)
Sway Moment Magnification Factor,
International Journal of Civil and Structural Engineering Volume 5 Issue 1 2014
24
Column slenderness computation and evaluation using finite element method and commercial software Mohammad I. Hossain, Tahsin R. Hossain
1 1 = = 1.103 1 − Q 1 − 0.093 Minimum moment = Pu × (0.6 + 0.03 × h ) = (221.25 × (0.6 + 0.03 × 14)) ÷ 12 = 18.806 kip -ft.
δs =
(21) (22)
The minimum moment is the same for major and minor axis because of square shaped column. As minimum moment is larger than the actual acting moment the minimum moment governs both axes. For column design major axis moment is considered. One special consideration has to check for δs. The maximum moment may occur between the ends of the column being designed. Ordinarily this is not the case for columns in sway frame. For sway frames the maximum moment usually occurs at one end of the column. However, under certain conditions this may not be the case. Hence ACI requires that one check for such a condition.
Lu > r
35
Pu f'cAg If above equation is true then the column must be designed as a non-sway column. Lu 16 × 12 35 35 ∴ = = 45.71 and = = 65.88 r 0.3 × 14 Pu 221.25 f'cAg So,
Lu < r
35 Pu f'cAg
(23)
(24)
4 × 14 × 14
and no further magnification required.
After overwriting the value of δs the design moment has changed. The model is run with P-∆ analysis with the moment value before overwrites with δs. The load combination that is used for P-∆ analysis is 1.4DL+1.7LL, which has been recommended in ETABS design manual for column. In the Table 6 a list presents the value of moments at different conditions of the column. The moment value after the overwrite almost matched with P-∆ analysis. As the P-∆ analysis moments are almost identical to the overwrite moment it could be concluded that the using of δs equation in this calculation is consistent for ETABS design calculation.
Table 6: Result comparison of different analysis mode
Before overwrite After overwrite After P-∆ analysis
TYPES OF MOMENT M3 M2 M3 M2 M3 M2
MOMENT VALUE, KIP-FT (N-MM) 18.807 (25.5E6) 17.474 (23.7E6) 18.807 (25.5E6) 18.464 (25.0E6) 18.963 (25.7E6) 18.144 (24.6E6)
5.5 Calculation check by PCACOL for δs International Journal of Civil and Structural Engineering Volume 5 Issue 1 2014
25
Column slenderness computation and evaluation using finite element method and commercial software Mohammad I. Hossain, Tahsin R. Hossain
Several inputs are required to calculate δs in PCACOL. It requires the ratio of the design load to all columns of concern frame at design story to design load of selected column and ratio of critical buckling load to all columns of concern frame at design story to buckling load of selected column. PCACOL cannot perform P-∆ analysis. Consequently the P-∆ analysis result obtained from ETABS cannot compare with the PCACOL output. The calculation steps are shown below.
∑P ∑P
u
= 2 × 221.25 + 2 × 385.63 = 1213.76 kip
(25)
1213.76 (26) = 5.486 Pu 221.25 Flexural stiffness for corner column, 14 × 14 3 + 29 × 10 6 × 6 × 0.44 × 4.75 2 = 4.03 × 10 9 in2-lb EI = 0.2 × 3.6 × 10 6 × (27) 12 Flexural stiffness for edge column, 16 × 16 3 + 29 × 10 6 × 8 × 0.79 × 5.6252 + 29 × 10 5 × 4 × 0.79 × 1.875 2 EI = 0.2 × 3.6 × 10 6 × 12 u
=
(
)
(
) (
)
∴ EI = 1.01 × 10¹⁰ in2-lb Critical buckling load for corner column, π 2 × 4.03 × 10 9 = 1078.95 kip Pc = 2 (1 × 16 × 12) Critical buckling load for edge column, π 2 × 1.01 × 1010 = 2704.10 kip Pc = 2 (1 × 16 × 12) ∑ Pc = 2 × 1078.95 + 2 × 2704.10 = 7566.10 kip
∑P
(28) (29)
(30) (31)
7566.10 = 7.01 Pc 1078.95 The Sway Moment Magnification Factor for corner column, 1 1 δs = = 1.27 = Pu 1 − 1213.76 ∑ 1 − 0.75 × 7566.10 0.75∑ Pc
∴
c
=
(32)
(33)
For corner columns the δs is same for major and minor axis. There are some differences between the calculation of δs by ETABS and PCACOL. The variation in different parameters is present in Table 6. It is evident that the difference in steel ratio in ETABS and PCACOL is excessive even though the δs value difference is moderate.
Table 6: Comparison between result of ETABS and PCACOL for δs calculation PARAMETERS
δs (Y or 3) or δs (X or 2)
% of steel
ETABS VALUE
PCACOL VALUE
% DIFFERENCE
1.103
1.270
(+) 15.14%
1.00%
1.796%
(+) 79.60%
International Journal of Civil and Structural Engineering Volume 5 Issue 1 2014
26
Column slenderness computation and evaluation using finite element method and commercial software Mohammad I. Hossain, Tahsin R. Hossain
6. Conclusions The objective of this study was to review the slender column design guideline of ACI code by manual calculation and check the calculation process by FEM software ETABS and commercial software PCACOL. The following conclusions are made from this study. 1. The analysis process of ETABS and PCACOL differ when calculating δns because of using Eq. (13) in PCACOL and Eq. (7) in ETABS. The analysis value of EI and Pc has increased about 27.9% for PCACOL output than ETABS output. As the value of Pc is larger in PCACOL than ETABS the δns value is lower in PCACOL than ETABS. This is because Eq. (13) considers steel effect to calculate EI value where Eq. (7) totally ignores it. The steel ratio is greater in ETABS design output then PCACOL design output by about 9.22%. The value of δns in major axis is 38.87% greater in ETABS analysis than PCACOL analysis. The value of δns in minor axis is 36.14% greater in ETABS analysis than PCACOL analysis. 2. For checking the δs value in both ETABS and PCACOL software, two differences are observed. PCACOL directly uses Eq. (33) to calculate δs, whereas ETABS uses P-∆ analyses for determining sway magnification moment. It is observed that the magnified moment manually calculate using Eq. (21) is almost the same that is found after P-∆ analysis using ETABS. Because PCACOL uses Eq. (13) to calculate EI value, it gives a more conservative result for steel ratio. The steel ratio found in PCACOL is 79.60% higher than ETABS calculated steel ratio which is noticeable. 3. ETABS is more conservative than PCACOL for conducting δns value and PCACOL is more conservative than ETABS for conducting δs value. So, designers should take care when use these two software for slender column design purpose.
6. References 1. ACI Committee 318, (1999), Building Code Requirements for Structural Concrete & Commentary: ACI 318-99, American Concrete Institute, Detroit, USA. 2. Bangladesh National Building Code, (2006), BNBC: Housing and Building Research Institute, Dhaka, Bangladesh. 3. Computers & Structures Inc., (2003), ETABS: Integrated Building Design Software, Version 8.0, Berkeley, California, USA. 4. Halder, B. K., (2007), Design of Concrete Column Considering Slenderness Effect, B.Sc. Engineering Thesis, Department of Civil Engineering, Bangladesh University of Engineering and Technology (BUET), Dhaka, Bangladesh. 5. Hassoun, M. N., (2005), Structural Concrete, Addison-Wesley Publishing Company Inc., New York, USA. 6. Hossain, M. I., (2008), Effects of Slenderness in Reinforced Concrete Column Design, M. Engg. Research Project, Department of Civil Engineering, Bangladesh University of Engineering and Technology (BUET), Dhaka, Bangladesh. 7. Kumar, S., (2005), Treasure of RCC Design (In S.I Unit), Standard Book House, New Delhi, India. International Journal of Civil and Structural Engineering Volume 5 Issue 1 2014
27
Column slenderness computation and evaluation using finite element method and commercial software Mohammad I. Hossain, Tahsin R. Hossain
8. Nilson, A. H., Darwin, D., Dolan, C. W., (2003), Design of Concrete Structures, 13th Edition, Tata McGraw-Hill Publishing Company, New Delhi, India. 9. Portland Cement Association, (1999), PCACOL: Design and Investigation of Reinforced Concrete Column Sections, Version 3.0, Skokie, Illinois, USA. 10. Uniform Building Code, (1994), UBC: International Code Council, Inc. Falls Church, Virginia, USA.
International Journal of Civil and Structural Engineering Volume 5 Issue 1 2014
28