International Journal of Hospitality Management 47 (2015) 140–150
Contents lists available at ScienceDirect
International Journal of Hospitality Management journal homepage: www.elsevier.com/locate/ijhosman
Value dimensions in consumers’ experience: Combining the intraand inter-variable approaches in the hospitality sector Martina G. Gallarza a,1 , Francisco Arteaga c,2 , Giacomo Del Chiappa d,e,∗ , Irene Gil-Saura a,b,3 a
Marketing Department, University of Valencia, Valencia, Spain Facultad de Economía, Avda. Tarongers, s/n, 46018 Valencia, Spain c Facultad de Medicina y Odontología, Universidad Católica de Valencia San Vicente Mártir, Valencia, Spain d Department of Economics and Business, University of Sassari and CRENoS, Via Muroni, 25, 07100 Sassari, Italy e Senior Research Fellow, School of Tourism & Hospitality, University of Johannesburg, South Africa b
a r t i c l e
i n f o
Keywords: Value dimensions Extrinsic vs. intrinsic values Perceived value Satisfaction Loyalty
a b s t r a c t Within the deep and extensive research on value, two main areas of discussion emerge: multidimensionality (intra-variable approach) and interrelationships with other constructs (inter-variable approach). Independently, the two areas have produced relevant knowledge; however, when studying them jointly, the results are inconsistent. The paper aims first to build four self-oriented value scales for a hospitality experience (efficiency, quality, play, and aesthetics), and second to test them in a SEM model with overall perceived value, customer satisfaction, and customer loyalty, upon a sample of 585 hotel consumers in Sardinia (Italy). The results show both unexpected (for the intra-variable approach) and confirmatory (for the inter-variable approach) findings: first, in spite of being a hedonic experience (leisure tourism), intrinsic values (play and aesthetics) are weaker predictors than extrinsic ones (efficiency and service quality) of both overall value and loyalty. Second, a clear quality–value–satisfaction–loyalty chain is confirmed, with relevant indirect effects. © 2015 Elsevier Ltd. All rights reserved.
1. Introduction Value is probably one of the most contrasted and revisited concepts in consumer research. The literature depicts it as an “amorphous concept” (Zeithaml and Bitner, 1996: 33), “difficult to quantify” (Petrick, 2002: 122) and therefore “multifaceted and complex” (Gallarza et al., 2011: 183). Nevertheless, the concept, interchangeably named “perceived” and “consumer” value, has been the subject of significant progress, in the last decade, towards overcoming the methodological and measurement difficulties involved in scaling and assessing it (e.g. Lin et al., 2005; Martín-Ruiz et al., 2008; Mathwick et al., 2001; Petrick, 2002; Sweeney and Soutar, 2001). The study of value has shifted from a phase of conceptual improvements to the current phase of
∗ Corresponding author. Tel.: +39 079213006; fax: +39 079213002. E-mail addresses:
[email protected] (M.G. Gallarza),
[email protected] (F. Arteaga),
[email protected] (G. Del Chiappa),
[email protected] (I. Gil-Saura). 1 Tel.: +34 961625380; fax: +34 961625880. 2 Tel.: +34 963637412. 3 Tel.: +34 963838329; fax: +34 961625880. http://dx.doi.org/10.1016/j.ijhm.2015.03.007 0278-4319/© 2015 Elsevier Ltd. All rights reserved.
methodological development and measurement. This phase has been considered to have two main approaches (Gallarza and GilSaura, 2006: 438): an intra-variable approach that emphasises the nature of the different dimensions of value and an inter-variable perspective that uses means–end models for assessing the relationships between value and other variables. On one hand, the former perspective has classical and seminal theoretical approaches (e.g. Holbrook, 1999; Sheth et al., 1991) as well as more recent proposals, incorporating the earlier literature, that have moved towards a more flexible and dynamic understanding of the complexity of the value concept, its dimensions, and the best techniques for its measurement (e.g. Gallarza et al., 2011; Lin et al., 2005; Martín-Ruiz et al., 2008; Leroi-Werelds et al., 2014). On the other hand, within the inter-variable approach, the extensive theoretical debate on the topics of service quality, value, and satisfaction that occurred during the 1990s and early 2000s in the services literature has received a logical response from empirical studies (Gallarza et al., 2011). As is widely known, numerous approaches, through means–end models, to both the sense and the intensity of the links between these three constructs have been a major subject during the last two decades, showing a wide range of statistical methods (Leroi-Werelds et al., 2014).
M.G. Gallarza et al. / International Journal of Hospitality Management 47 (2015) 140–150
Although the majority of previous works have concentrated independently on either one or the other approach, in tourism related literature where the interest on value research is highly noticeable, several authors have undertaken empirical works including both perspectives in the same study (e.g. Babin and Kim, 2001; Gallarza and Gil-Saura, 2006; Sánchez-Fernández et al., 2009; Ha and Jang, 2010; Yoon et al., 2010). However, the findings and results in this double trend are very wide (depicting diverse and varied dimensions) and sometimes inconsistent (with no clear pattern in the sense and intensity of the links), thus calling for further research. Within this dual perspective (inter- and intra-variable), the present study has two primary objectives: firstly, to investigate the dimensionality of consumer value in the hospitality-related context (the intra-variable approach); secondly, to explore the relations between value antecedents, overall perceived value, satisfaction, and loyalty (the inter-variable approach). In addition to the many works on value in hospitality settings from the last decade, addressing either intra (e.g. Nasution and Mavondo, 2008) or intervariable research (e.g. Hutchinson et al., 2009), the present study contributes to the current body of knowledge by providing a SEM model tested with PLS that addresses this dual objective in the same study. The model has the peculiarity of presenting both a special interest in the composite nature of value (intra-value) with intrinsic and extrinsic scales applied to a hospitality experience, and a structure of relationships (inter-value) of service-oriented constructs. We thus seek to explain loyalty behaviour as a final outcome through both classical concatenated direct effects (the service quality–value–satisfaction chain) but also through value dimensions (service quality, play and aesthetics) as antecedents of both perceived value and loyalty. This set of both direct and indirect effects depicts the richness and complexity of perceptions held by tourists regarding a hospitality experience. This paper has five main sections. After the introduction, the second section contains the conceptual framework, in which both the intra-variable and the inter-variable approach to value research are reviewed and the model proposition is presented. The third section describes the method followed in the study (questionnaire construction, setting and sample description). The fourth section corresponds to the discussion of the results of the hypothesis testing (procedures, measurement, and analyses for both intra and inter perspectives). The final section provides a conclusion with the main contributions, ending with an acknowledgement of the limitations and suggestions for future research directions.
2. Conceptual framework 2.1. Intra-variable value research The consensus on the multidimensional nature of value is one of the few areas of agreement in the abundant conceptual research into this notion, which is always understood as a key concept in marketing epistemology and strategic management (Babin et al., 1994; Bolton and Drew, 1991; Cronin et al., 2000; Day and Crask, 2000; Holbrook, 1999) However, although academicians do recognise that value is multidimensional, there is no consensus regarding the number of dimensions or the criteria for classifying them (Gallarza et al., 2011; Lin et al., 2005; Leroi-Werelds et al., 2014). Consequently, the range and variety of value dimensions referred to in the literature is very wide. First, there are two classical approaches that transcend in most of the cases: the acquisition vs. transaction value difference (Monroe, 1979, 1990) and the hedonic vs. utilitarian value dichotomy (Holbrook and Corfman, 1985; Holbrook and Hirschman, 1982). The former led to Dodds et al.’s (1991) work, which has since been widely used
141
Table 1 Holbrook’s (1999) value typology.
Self-oriented
Active Reactive
Other-oriented
Active Reactive
Extrinsic
Intrinsic
Efficiency (Convenience) Excellence (Quality) Status (Success) Esteem (Reputation, Materialism)
Play (Amusement) Aesthetics (Beauty) Ethics (Virtue, Justice) Spirituality (Faith)
(e.g. Al-Sabbahy et al., 2004; Grewal et al., 1998; Petrick and Backman, 2002). This dichotomy is also in the underpinnings of the service-dominant logic, when distinguishing between value-inuse and value-in-exchange (Vargo and Lusch, 2004). The latter generated uncountable works in the services literature, mainly in retailing research (e.g. Babin et al., 1994; Carpenter, 2008; Seo and Lee, 2008; Wong and Dean, 2009) but also in tourism and hospitality settings (e.g. Babin and Kim, 2001; Ha and Jang, 2010; Jamal et al., 2011; Park, 2004; Wu and Liang, 2009). Second, another seminal approach to value multidimensionality is Sheth et al. (1991)’s proposal, which considers functional, emotional, epistemic, conditional, and social dimensions. This work is the origin of the development of the well-known PERVAL scale proposed by Sweeney and Soutar (2001) and later used in many service settings (e.g. Chi and Kilduff, 2011; Grace and O’Cass, 2005; Wong and Dean, 2009). Last but not least, after continuous development of the aforementioned classical dichotomy between hedonic and utilitarian values, the proposal of a value typology by Holbrook (1999) is worth highlighting for its own value and its subsequent repercussions in the services and consumer behaviour literature. This author recognised three distinctions or dimensions that enable classification of the different types of value that can arise in the consumption experience: intrinsic vs. extrinsic (when consumption is an end in itself or is aimed towards an end), active vs. reactive (as there is active or passive control of the consumer over the object), and finally selforiented vs. other-oriented when a social dimension of the act of consuming is adopted. The combination of the three distinctions in a 2×2×2 matrix gives rise to eight types of value: efficiency, excellence (quality), play, aesthetics, status, esteem, ethics, and spirituality (see Table 1). Being mainly considered a theoretical contribution, there is not yet a unique multidimensional scale of the eight-value types, although several authors have used Holbrook’s approach to assess value dimensionality, concentrating in some of the eight cells (e.g. Babin and Kim, 2001; Gallarza and Gil-Saura, 2006; Mathwick et al., 2001, 2002; Sánchez-Fernández and Iniesta-Bonillo, 2006; LeroiWerelds et al., 2014). The present one is interested in the four self-oriented value dimensions (i.e. efficiency, quality, play, and aesthetics). In this sense, we follow Smith (1999: 157), who stated: “alternatively, a more parsimonious typology might exclude the self/other-oriented dimension”. 2.2. Inter-variable value research As mentioned previously, from an inter-variable perspective of value, means–end models are used for depicting relationships between value and other variables: sometimes with image and/or price, but more often with service quality, satisfaction, and loyalty (Gallarza et al., 2011). Following this approach, Zeithaml’s (1988) proposal is a pioneering work, alongside the works by Bolton and Drew (1991) and Monroe (1990). Generally, the link between quality and value
142
M.G. Gallarza et al. / International Journal of Hospitality Management 47 (2015) 140–150
enjoys a very wide consensus, quality being an input of value (e.g. Brady et al., 2005; Cronin et al., 2000). The relationship between value and satisfaction is also commonplace, but the discussion on the sense of the link between the two has received fewer consensuses than the previous one (i.e. quality–satisfaction and quality–value); anyway, linkages between service quality, value and satisfaction have been a major subject for decades (e.g. Brady et al., 2005; Cronin et al., 2000; Gallarza and Gil-Saura, 2006; Yoon et al., 2010). In this nonconsensus, the value–satisfaction proposal is more common than the opposite (Gallarza et al., 2011). In fact, conceptually and empirically, both value and satisfaction are considered key drivers of consumer behaviour, value being deemed the best and most complete antecedent of satisfaction (Day and Crask, 2000; McDougall and Levesque, 2000; Oliver, 1999; Parasuraman, 1997; Woodruff, 1997). Consequently, there seems to be a natural chain between quality, value, and satisfaction (Gallarza et al., 2011; Lin et al., 2005). This chain leads as a final outcome to loyalty (Zeithaml and Bitner, 1996), in its many shapes (repatronage intentions, positive word of mouth, willingness to pay more, etc.). This chain has interested researchers on services for the last two decades. Previously (the late 1980s and 1990s) the main interest lay in its first linkages (i.e. the triangle between service quality, value, and satisfaction), but since 2000, in tourism and hospitality literature we have witnessed the blossoming of a range of empirical studies on the interrelationships between value, satisfaction, and different forms of loyalty (e.g. in chronological order Choi and Chu, 2001; Petrick and Backman, 2002; Gallarza and Gil-Saura, 2006; Sánchez et al., 2006; Lee et al., 2007; Chen and Tsai, 2007; Feng and Morrison, 2007; Yuan and Wu, 2008; Ryu et al., 2008; Wu and Liang, 2009; He and Song, 2009; Hutchinson et al., 2009; Sánchez-Fernández et al., 2009; Ha and Jang, 2010; Yoon et al., 2010; Jin et al., 2013; Lee and Min, 2013; Kim et al., ˜ et al., 2013). 2013; Polo Pena However, no unanimity has been reached concerning this chain in relation to the nature and number of constructs: some proposals elicit either value (e.g. Wien and Olsen, 2012) or service quality (e.g. Grace and O’Cass, 2005); others add image (e.g. Ryu et al., 2008) or ˜ et al., 2013), or consider different behavioural reputation (Polo Pena intentions (e.g. Lee and Min, 2013). The correct order and intensity of the links is also an issue that remains to be discussed (direct and/or indirect effects). Recent state-of-the-art studies of methodological aspects of inter-variable research on value (e.g. Gallarza et al., 2011; Lin et al., 2005) have depicted these inconsistencies, calling for either more interdisciplinary approaches or more context-specific ones. Ours would like to be considered among the latter, as it focus on hospitality experiences, combining inter- and intra-value research.
Efficiency
H7
H8
Service Quality
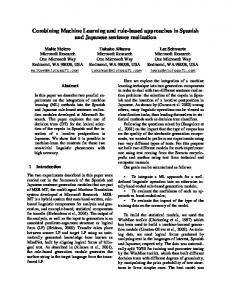
2.3. Model construction Our combined inter and intra-value research relies on the proposal of a structural model that supports three types of hypotheses; the first two correspond respectively to the intra, and inter-variable perspective of value research, and the third one is a particular contribution of this research, that seeks to explain loyalty not just through the classical chain of effects “service qualityvalue-satisfaction”, but also through direct and indirect effects of value dimensions (quality, play and aesthetics) on customer loyalty. Firstly, within the intra-variable approach, according to the literature on value multidimensionality (e.g. Gallarza et al., 2011; Holbrook, 1999; Sánchez-Fernández and Iniesta-Bonillo, 2006, 2007) the four self-oriented value scales were selected from Holbrook (1999), namely the first four cells in Fig. 1 (efficiency, service quality as excellence, play and aesthetics), which are more parsimonious and closer to a consumer behaviour approach (Oliver, 1999; Smith, 1999); contrary to other works in tourism settings (e.g. Gallarza and Gil-Saura, 2006; Nasution and Mavondo, 2008; Sparks et al., 2008), social values were not considered and the focus is on self-oriented values instead. As for methodology, this study is based on previous empirical works (e.g. Gallarza and Gil-Saura, 2006; Sánchez-Fernández ˜ et al., 2013) that have also used the dimenet al., 2009; Polo Pena sions of value as exogenous variables of a structural model, being direct and positive antecedents of perceived value. In this sense, regarding service quality, and following early works (e.g. Zeithaml, 1988), we posit the quality–value link, which is also common in previous works in hospitality settings (e.g. Chen and Tsai, 2007; Hutchinson et al., 2009). Efficiency, as a separate dimension, is less common although some other works also add it as a cognitive antecedent of perceived value (e.g. Gallarza and Gil-Saura, 2006; Sánchez-Fernández and Iniesta-Bonillo, 2009). We thus propose the following hypotheses: H1 . Perceptions of efficiency directly and positively influence perceived value. H2 . Perceptions of service quality directly and positively influence perceived value. Regarding the intrinsic dimensions, for the “play” dimension, we follow Babin and Kim (2001) or Sparks et al. (2008) which consider “fun” as a driver of tourism consumption, or more holistically “emotional response”, in Petrick (2002: 128) expressing feelings of “joy, delight and happiness”. Aesthetics is also an important driver of value perceptions in tourism settings (Gallarza and Gil-Saura, 2006) as sense perception stimulations are important for an experiential approach to tourism consumption (Yuan and
H1
H2
Value
H3
H5
Satisfaction
Play H6 H4
Aesthetics
H9
Loyalty
Fig. 1. The proposed model.
M.G. Gallarza et al. / International Journal of Hospitality Management 47 (2015) 140–150
Wu, 2008). Experiencing pleasure by both a playful and aesthetical consumption is considered as conducting to better value perceptions. The hypotheses supporting these proposals are as follows: H3 . Perceptions of play dimension directly and positively influence perceived value. H4 . Perceptions of aesthetics directly and positively influence perceived value. Secondly, within the inter-variable approach, we focussed our interest in the quality–value–satisfaction–loyalty chain that emerged as a trend from the literature review on services (see Fig. 1 in Gallarza et al., 2011: 187). Therefore, we also propose this chain of constructs in our model, in accordance with many existing works from services literature (e.g. Babin and Kim, 2001; Brady et al., 2005; Cronin et al., 2000; Duman and Mattila, 2005; Gallarza and Gil-Saura, 2006). As the link between service quality and value has already been considered, two additional hypotheses are then postulated: H5 . Perceived value directly and positively influences customer satisfaction. H6 . Customer satisfaction directly and positively influences customer loyalty. Thirdly, as particular knowledge generated in this paper, additional links between dimensions of value and loyalty as an endogenous construct are proposed. Within the plethora of studies addressing relationships between service quality, value, satisfaction and loyalty, we do follow the ones that considered a direct relationship between service quality and loyalty: for instance the “comprehensive model” from Cronin et al. (2000) and Brady et al. (2005), and also in tourism and hospitality settings, proposals form Hutchinson et al. (2009) and Chen and Tsai (2007). As a contribution to previous works, in addition to the classical quality–loyalty link, the model presented in this study broadens this view and considers more value dimensions as antecedents of loyalty (play and aesthetics, intrinsic and affective values), considered thus as direct and positive antecedents of loyalty. Efficiency, as an extrinsic and cognitive construct, in this model is not linked to loyalty, a more affective and emotional variable. Besides, no direct links between value dimensions and satisfaction are proposed, because the inter-variable approach followed in this study supports a key chain between value, satisfaction, and loyalty. Thus, as a final set of relationships, we propose the following hypotheses: H7 . Perceptions of the service quality dimension directly and positively influence loyalty. H8 . Perceptions of the play dimension directly and positively influence loyalty. H9 . Perceptions of the aesthetics dimension directly and positively influence loyalty. Fig. 1 depicts the structure of direct and indirect relations proposed in this study, where exogenous constructs support the inter-variable approach, and exogenous constructs illustrate the inter-variable approach to value research. The figure is completed by the third group of hypotheses, which suggests that three of the four value dimensions are also direct antecedents of customer loyalty. 3. Method We consider that a hospitality-based experience is ideal for exploring an intra-variable approach to value, as tourism services are by definition multidimensional (Al-Sabbahy et al., 2004;
143
Gallarza and Gil-Saura, 2006; Sánchez et al., 2006; Sparks et al., 2008). Relevant previous works have proposed multidimensional scales of value tested within tourism-related experiences (e.g. Al-Sabbahy et al., 2004; Petrick, 2002; Sánchez et al., 2006). Furthermore, important cross-sectional studies on the inter-variable approach have considered tourism or leisure among the service industries tested (e.g. Brady et al., 2005; Cronin et al., 2000; MartínRuiz et al., 2008; McDougall and Levesque, 2000). Indeed, the methodological relations of value, satisfaction and loyalty are a highly common area of research in the tourism marketing literature (Gallarza et al., 2011). 3.1. Questionnaire construction An ad-hoc questionnaire was built using a double-stage methodology (see the Appendix). First, for the intra-variable approach, we gathered qualitative information through four focus groups of consumers with different profiles to explore in general the possibility of experiencing self-oriented values (efficiency, quality, aesthetics, and play) during a hotel stay. Thus, from the statements proposed in the focus groups, information was collected to draft these value dimensions and translate them into different indicators. Second, for the inter-variable approach, the information was completed with an additional literature review on the scaling of some constructs with a long tradition: service quality was generalised from the well-known work by Cronin et al. (2000); the value scale was taken from Gallarza and Gil-Saura (2006), which previously used that of Cronin et al. (2000), with an extra item for the overall value perception; satisfaction was assessed with a monoitem measure as in Kattara et al. (2008); and, finally, loyalty, as a multidimensional construct, was measured with Zeithaml et al. (1996)’s scale (just the two first dimensions, i.e. intention to recommend and intention to return) (see the Appendix). All the indicators were positively expressed on a 5-point Likert scale. The final questionnaire included a final set of questions regarding the sample profile and the type of hotels researched. The questionnaire was originally designed in English but as different nationalities could appear in a sampling process with tourists, three different questionnaires were prepared (English, German, and Italian). Among the various possible methods of translation (i.e. direct, back, de-centred and parallel according to Pizam and Ellis, 1999: 336), back translation was chosen, as in other works on value in cross-cultural settings (e.g. Brady et al., 2005) or in tourism-related settings (e.g. Seddighi et al., 2001). Translation of the original English questionnaire by bilingual speakers for each language was thus produced, followed by a translation back to the original language by other bilingual speakers, checking therefore linguistic and functional aspects to gain equivalence. This method of backtranslation was used for quality assurance, as the target of this research is an international audience. The questionnaire was pretested on 18 tourists from the three different nationalities to assure the comprehensibility of the questions. No concerns were reported in these pilot tests, so the four final questionnaires were considered as definitive. 3.2. The setting and the sample For the purpose of this study, the island of Sardinia (Italy) was chosen as the specific setting for our empirical study. Like other tourism islands, Sardinia depends heavily on the notion of sun, sea, and sand. It expresses enormous opportunities in socalled sustainable tourism, including experiential consumption: nature watching, heritage and archaeology, food and wine tourism, trekking, sport and event tourism, and other outdoor activities (Pulina et al., 2013).
144
M.G. Gallarza et al. / International Journal of Hospitality Management 47 (2015) 140–150
Table 2 Socio-demographic profile of the respondents.
4. Results and discussion of findings
Hotel category
%
Working sector
%
3 stars 4 stars 5 stars Gender Male Female Age 18–25 26–35 36–45 46–55 56–65 66 or above Education None Primary school Secondary school High school University degree Masters/PhD Occupation Employee Executive/manager Self-employed Retired Occasional worker Unemployed Student Other
9.2 72.9 17.9
Agriculture Industry/manufacturing Public sector Retail/services Reason for the stay Leisure Business Other Yearly number of hotel stays 1 2–4 More than 4 Country of residence Italy Switzerland UK Spain Germany France USA Ireland Sweden Belgium Norwegian Austria Holland Denmark Other
4.2 21.7 12.7 61.3
52.1 47.9 9.3 22.0 29.2 27.1 9.6 2.8 0.2 0.2 51.0 9.6 33.0 6.1 35.3 12.6 16.9 6.8 5.9 11.5 9.6 1.4
95.4 4.3 0.3 13.3 66.2 20.5 51.3 3.6 19.8 3.1 7.4 3.2 1.7 1.5 1.0 1.0 1.0 0.9 0.9 0.7 2.9 N = 585
According to Servizio della Statistica Regionale (2014), in 2012 there were 913 places of hotel accommodation in the region, of which 488 were three-star, 243 four-star, and 24 five-star hotels; the overall number of beds was 107,264. In 2012 the hotel sector counted a total of 1,627,745 arrivals (60.10% from Italy and 39.90% from foreign countries) and 7,683,900 overnight stays (58.18% from Italy and 41.82% from foreign countries). The final questionnaires were administered by personal interview in the reception area of three-, four- and five-star hotels on the island of Sardinia, in the month of October 2012, collecting a total of 585 valid questionnaires (convenience sample). As shown in Table 2, more male respondents (52.1%) than female respondents (42.6%) completed the survey and the majority can be considered to be moderate travellers (Del Chiappa, 2013), as 66.2% of them travel four or more times a year. Most respondents reported themselves to being employees (35.3%), working in the retail/service sector (61.3%), being in the 36–45 age group (29.2%), having a university degree (33%), and travelling for leisure purposes (95.4%). As regards the country of residence, the range of nationalities in the sample is large, more than half of them being domestic tourists from Italy (51.3%). followed by the UK (19.8%), and Germany (7.4%).
Methodologically, a variance-based method was chosen to estimate the structural model, that is PLS Path Modelling (Tenenhaus et al., 2005), rather than the more common covariance based method. In accordance with the literature (Fornell and Bookstein, 1982; Gefen et al., 2011; Reinartz et al., 2009), PLS method best suits first, the nature of our objective, second, the level of complexity of our model, and third the nature of some scales as one-dimensional. First, our research aim is explorative in nature: we adopt a joint intra and inter-variable approach to value research that looks for identifying in a hospitality experience both direct and indirect effects of the dimensions of value in the value–satisfaction–loyalty chain. No precise theory is expected to be confirmed, but rather the aim is to explain the richness of a set of relationships. Second, the structure of our model also suggests the use of PLS. Fig. 1 depicts a relatively complex model with seven latent variables (four exogenous and three endogenous) and nine inner relations. This model is among the so-called focused models and balanced models (more exogenous than endogenous latent variables but not more than twice). Focused and balanced models match the PLS path modelling prediction goal, while covariance based methods are more suitable for estimating unfocused models (those that have a number of endogenous latent variables that is at least the double than the number of exogenous ones) (Hair et al., 2012). Third, an additional motive to choose PLS Path Modelling is that we measure satisfaction with only one indicator and this may lead to model under-identification with covariance based methods (Fuchs and Diamantopoulos, 2009), which is not a problem for the PLS Path Modelling method. To estimate the model we use our MatLab implementation of the algorithm, based on Guinot et al. (2001) and Tenenhaus et al. (2005); specifically, the model estimation was processed in two steps: a measurement model first, and a structural model second. 4.1. The measurement model evaluation Prior to the estimation of the model, we test the scales’ psychometric properties: reliability, and discriminant and convergent validity (see Table 3). 4.1.1. Reliability of scales In Table 3, the Cronbach’ Alfa coefficient for each construct exceeds the 0.70 recommended threshold (Nunnally, 1978). Composite reliability, considered as a more accurate reliability measure because it does not assume equal item weighting (the tau equivalency assumption), is even higher (the minimum value is 0.88 for efficiency). After following a sequential depuration process according to Cronbach’s alpha, a total of four items were deleted (item 8 for efficiency and items 2, 5 and 6 for aesthetics). As mentioned
Table 3 Scales reliability and validity. Alpha
CrR
Intra-variable scales Effi
Squa
Play
Aest
0.83 0.97 0.87 0.93
0.88 0.97 0.90 0.95
Efficiency Service quality Play Aesthetics
0.71 0.55 0.50 0.48
0.89 0.38 0.47
0.81 0.49
0.93
Inter-variable scales Val Sat
Loy
0.95 n.a. 0.92
0.97 1.00 0.94
Value Satisfaction Loyalty
0.61 0.58 0.54
0.69 0.68 0.64
0.50 0.48 0.51
0.55 0.53 0.53
0.95 0.91 0.77
0.88
Effi, efficiency; squa, service quality; aest, aesthetics; val, value; sat, satisfaction; loy, loyalty. Bold figures in the diagonal are the square roots of the AVE’s (variance shared between each construct and their items).
1.00 0.76
M.G. Gallarza et al. / International Journal of Hospitality Management 47 (2015) 140–150
145
Table 4 Loadings and cross loadings.
earlier, these two scales were created ad-hoc after a qualitative stage, whereas the service quality, value and loyalty scales from which no indicators were to be eliminated, were extrapolated from the literature (Cronin et al., 2000). The play scale shows a particular behaviour in the sense that two underlying dimensions emerged in the depuration process; the researchers decided to keep all five indicators, as the gain in reliability was less than 0.05. Furthermore, the square root of each AVE (the values in bold in the diagonal of Table 3) exceeds the recommended threshold of 0.70 (Chin, 1998; Fornell and Larcker, 1981). The reliability of the proposed scales is therefore confirmed. 4.1.2. Discriminant validity The square root of the average variance extracted (AVE) in Table 3 indicates the strength of the relation between a construct and their associated items. Following Fornell and Larcker (1981), the seven constructs confirm discriminant validity, as the square root of the AVE of each construct is greater than the correlations between the construct and each of the other constructs. Discriminant validity is also assured if correlations between pairs of constructs are significantly below one (Sweeney and Soutar, 2001), which is also verified for all pairs, as shown in Table 3. The correlations between some value dimensions are relatively high (near 0.5 and above). The highest correlation is between efficiency (X1 ) and service quality (X2 ) (0.55), followed by the correlation between play (X3 ) and aesthetics (X4 ), which reaches 0.49. These results are in accordance with Holbrook’s conceptualization of value dimensions (see Table 1) as these pairs of value respectively share the extrinsic and intrinsic nature in his classification. Concerning correlations between the three endogenous constructs, these were also very high (between 0.76 and 0.91), but similar to those of other previous works on the inter-variable approach in tourism settings (e.g. Al-Sabbahy et al., 2004; Choi and Chu, 2001; Gallarza and Gil-Saura, 2006; Wu and Liang, 2009).
Effi
Squa
Play
Aest
Val
Sat
Loy
Effi1 Effi2 Effi3 Effi4 Effi5 Effi6 Effi7
0.62 0.70 0.76 0.66 0.74 0.75 0.71
0.38 0.32 0.46 0.30 0.41 0.40 0.46
0.23 0.33 0.33 0.40 0.35 0.38 0.44
0.27 0.29 0.30 0.35 0.41 0.39 0.36
0.34 0.38 0.51 0.38 0.47 0.43 0.45
0.33 0.36 0.52 0.35 0.43 0.41 0.44
0.31 0.38 0.44 0.32 0.42 0.36 0.41
Squa1 Squa2 Squa3 Squa4 Squa5 Squa6 Squa7 Squa8 Squa9
0.49 0.49 0.48 0.50 0.48 0.45 0.47 0.53 0.53
0.91 0.91 0.91 0.92 0.91 0.73 0.90 0.93 0.88
0.33 0.37 0.33 0.32 0.32 0.35 0.33 0.36 0.35
0.40 0.43 0.42 0.43 0.42 0.38 0.41 0.43 0.43
0.62 0.62 0.63 0.65 0.62 0.47 0.59 0.68 0.64
0.60 0.60 0.62 0.64 0.61 0.44 0.58 0.68 0.61
0.57 0.60 0.57 0.59 0.60 0.46 0.55 0.62 0.58
Play1 Play2 Play3 Play4 Play5
0.26 0.25 0.34 0.49 0.53
0.23 0.22 0.32 0.30 0.39
0.80 0.81 0.84 0.80 0.78
0.31 0.31 0.38 0.43 0.48
0.26 0.25 0.37 0.46 0.53
0.25 0.24 0.35 0.46 0.52
0.33 0.33 0.43 0.42 0.48
Aest1 Aest3 Aest4
0.43 0.43 0.48
0.44 0.41 0.47
0.47 0.42 0.50
0.93 0.94 0.93
0.52 0.49 0.52
0.49 0.48 0.50
0.51 0.49 0.49
Val1 Val2 Val3
0.56 0.57 0.60
0.64 0.63 0.71
0.45 0.49 0.48
0.52 0.52 0.53
0.95 0.94 0.97
0.88 0.83 0.88
0.73 0.74 0.74
Sat1
0.58
0.68
0.48
0.53
0.91
1.00
0.76
Loy1 Loy2 Loy3 Loy4 Loy5
0.56 0.52 0.51 0.43 0.27
0.65 0.63 0.60 0.50 0.38
0.46 0.49 0.48 0.45 0.32
0.48 0.51 0.51 0.45 0.34
0.76 0.75 0.76 0.60 0.44
0.75 0.74 0.74 0.60 0.43
0.89 0.95 0.95 0.85 0.72
Effi, efficiency; squa, service quality; aest, aesthetics; val, value; sat, satisfaction; loy, loyalty. The figures in bold emphasis are the loadings.
4.1.3. Convergent validity In order to verify convergent validity, we checked that the correlation of each indicator with its intended construct (the loading) was greater than that obtained with the rest of the constructs (the cross loadings) (see Table 4). Although there are some cross-loadings, all items load more highly on their own construct, confirming therefore the convergent validity of the scales.
criteria of Hair et al. (2011) and Hair et al. (2012): the explained variance for the endogenous constructs (the R2 coefficients), the predictive relevance (the Q2 coefficients) and the size of the effect of each construct incident on each endogenous construct, the f2 coefficients (as a measure of their relative importance in its explanation). The path coefficients and their associated statistical significativity are also reported. Fig. 2 and Table 5 show the structural model estimated. The path coefficients for the full model are positive and highly significant (pvalue