COMPARISON OF LINK-LEVEL ROBUSTNESS INDICATORS V.L. Knoop, M. Snelder, H.J. van Zuylen COMPARISON OF LINK-LEVEL ROBUSTNESS INDICATORS V.L. Knoop Delft University of Technology, TRAIL Research School, Faculty of Civil Engineering and Geosciences, Department of Transport and Planning, P.O. Box 5048, 2600 GA Delft, The Netherlands E-Mail:
[email protected] M.Snelder, TNO Mobility and Logistics, Delft University of Technology, TRAIL Research School. E-Mail:
[email protected] H.J. van Zuylen, Delft University of Technology, TRAIL director E-Mail:
[email protected]
ABSTRACT Much of the delay in transport networks is caused by incidents. Many indicators are developed to determine vulnerable parts of a network without simulating the network flows with an incident on each of the links. This paper lists indicators proposed in literature and cross compares them. Their values for all links on three networks of different sizes are computed. Among others, the order and the cross correlation of the indicators is compared. For one network the effects are also fully computed, running one simulation per blocked link. Different vulnerability indicators rank the links differently. None of the indicators produces a result similar to the full computation. We conclude that the listed indicators are complementary. INTRODUCTION Numerous situations can be thought of in which large parts of the road network are blocked due to an event on one single location. For example, an incident in the peak hour in which a truck is involved could cause severe congestion on many roads in the surroundings of the accident location. Of course this is not desirable. The term road network robustness refers to this. In literature different definitions of robustness can be found, but there is not yet a commonly accepted definition for robustness. The cause of disruptions is one of the most important differences. Sometimes only severe and non-recurrent disruptions are considered and sometimes also daily variations are taken into account. The terms robustness and vulnerability are often used alternately as is also done in this paper. They have a strong relation, but they are actually each others opposites. Vulnerability describes the weakness of a network and robustness describes the strength of a network. We define robustness in the following way: “Robustness is the ability of the network to maintain its functionality under conditions that deviate from the normal conditions.” The normal conditions, in this case, are conditions in which traffic operations are normal, without incidents or exceptional demands. In this paper we focus on incidents that block two lanes of a road. In literature multiple indicators for robustness and multiple methods for measuring robustness are proposed. The indicators mainly focus on spare capacity and alternative routes. However, robustness is more than just these two aspects. Interdependency, flexibility and
1
COMPARISON OF LINK-LEVEL ROBUSTNESS INDICATORS V.L. Knoop, M. Snelder, H.J. van Zuylen resilience also are drivers for robustness (Immers et al. 2004). The methods for measuring robustness can be divided into two groups. The first group contains the ‘full computation methods’ in which the capacity is reduced for each link separately. In order to find out which links in a network are the most vulnerable, a complete simulation could be made. That is, for each link the capacity could be reduced and an assignment, static or preferably dynamic, could be made. The effects of the capacity reduction on for instance the total travel time could be regarded as an indicator for the vulnerability of a link. This approach is for instance used by Knoop et al. (2007). The advantage of this approach is that it is a complete analysis. However, the computation time of this approach is very high which can be considered as a disadvantage. Several approaches were introduced in order to overcome this disadvantage. In this second group of approaches a first selection of links that are likely to be vulnerable is made based on certain criteria. For these links a more detailed analysis is made by reducing the capacity and by assessing the vulnerability of these links based on more detailed simulations. In the Netherlands, the ‘Robustness scanner’ (Tamminga et al. 2005) was the first method in which this approach was used. Also the University of Leuven (Tampère et al. 2007) and the Delft University of Technology (Li 2007) introduced their own selection criteria. These methods are still computationally intensive. This gives rise to the following questions. What is the quality of the selection criteria? Could the vulnerability and robustness of a network or parts of the network also be determined by applying only the selection criteria (without reducing the capacity for a selected link)? The objective of this paper is to assess the quality of different selection criteria for measuring road network robustness. In this paper we first present a description of the method that is used for comparing the selection criteria and an overview of the networks on which this comparison is made. The results are present in the section thereafter and finally the conclusions and recommendation for future work are presented. METHOD FOR COMPARING THE SELECTION CRITERIA This section describes the approach that is used for determining the quality of different selection criteria. From literature a list of selection is constructed. For three networks these selection criteria are computed based on one single assignment with a dynamic traffic assignment model. The results for the real-world network are compared to the results of a fully computed run with link blocking. Selection Criteria The different selection criteria are listed below. These selection criteria originate from (Tampère et al. 2007), (Tamminga et al. 2005) and (Li 2007). The presented list is not a complete list of all the criteria available in literature. The vulnerability index which was introduced in (MurrayTuite and Mahmassani 2004) can for example also be seen as a criterion. However, computing this index is not straightforward. The following symbols will be used in the remainder of the paper (Table 1) Table 1 List of Symbols Variable name
Description
2
COMPARISON OF LINK-LEVEL ROBUSTNESS INDICATORS V.L. Knoop, M. Snelder, H.J. van Zuylen Simulation level ∆t
Time step
Per link Intensity I Capacity C Remaining capacity at blocking Cb Free flow speed Vf Jam density kj Length L Number of lanes N For each of criteria listed, a higher value means that the predicted impact of the blocking of that link is bigger. C1: I /(1 − I ) . This shows the incident impact of the link C ⎛ ⎞ C2: Tb = L ⎜ N ⋅ K j − I ⎟ Tb is the time it takes before the tail of the queue reaches the I⎝ Vf ⎠ upstream end of the link, given that the link is not empty at the moment of an incident. As vulnerability measure 1/Tb is taken. C3: I /(1 − I ) × ϑ ( I − 2500 ) , in which ϑ is a step function. Links with a relatively high C incident impact restricted to links with a capacity lower than 2500 pae/hour: C4: High risk on the link. Select links with a high product of C1 and the incident chance Δt (Ui): U i = ∑ ( N iin (t j ) − N iuit (t j ) ) Ui approximates the flow on a link. Li j C5: C5 is the product of C2, the incident chance (Ui) and C1 score on upstream links. High risk on blocking back to important links. C6: C6 is the product of C3, incident chance (Ui), and C1 on upstream links. High risk on blocking back followed by a low recovery rate. C7: Compute for all nodes the sum of the C1 values of the links upstream of that node. Nodes with a high value are vulnerable. Assign this value to the downstream links of a node. High risk at crossings of vulnerable links. C8: volume to capacity ratio (I/C) C9: number of paths over that link C10: Number of cars that are blocked when an incident occurs on a link (I-Cb); in this paper, it is assumed that Cb equals 0.
Other criteria mentioned in literature (Tampère et al. 2007) and (Li 2007) include the risk on a grid lock and the quality on alternative routes. However, these criteria are not included in this paper: they cannot be computed automatically in an assignment without incidents. The criterion that all off-ramps could be vulnerable, is also not computed since that is only a step in a selection process. Finally, some criteria explicitly take the chances on an incident into account. This paper discusses the possible consequences of an incident, given that it happens.
3
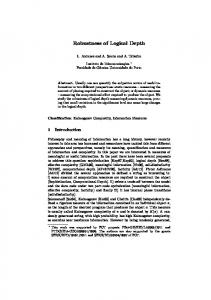
COMPARISON OF LINK-LEVEL ROBUSTNESS INDICATORS V.L. Knoop, M. Snelder, H.J. van Zuylen Networks For the comparison of the selection criteria, we used three different sized networks. We used a simple test network to show clearly the characteristics of the different indicators. The second test network is a bit more detailed and shows the effects of on and off ramps. The simulation of traffic in a real-world, medium-sized network shows how the effects work out in practice (third network). The characteristics of the three networks are presented in table 2. The first network studied is a test network with 11 directional links (Figure 1). It can be seen as a motorway that passes a city. There are connections to the city (links 7, 8, 9 and 10) and there is a local road that passes the city (link 11). All local connections have a maximum speed of 50 km/h, whereas the motorway has a maximum speed of 120 km/h. As congestion sets in, more drivers take the local road around the city.
Figure 1 Simple test network (Li 2007)
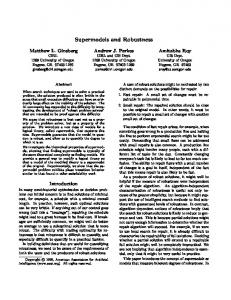
The second network is a test network that is based on the network of Delft in the Netherlands. The motorways around the city are included as well as the largest two roads through the city. All local roads are excluded. The on and off ramps are modelled in detail. Since the capacity and location of on and off ramps is likely to be of relevance for the robustness of a road network, this is an important addition compared to the first test network.
Figure 2 Network of Delft, the Netherlands (Li 2007)
The network around the city of Rotterdam (around 600,000 inhabitants, see also Figure 3) is the third network. The motorways around the city are modelled as well as the most important corridors through the city. The network is used for local traffic and for transit traffic. The period from 6.30 to 9.30 in the morning was simulated.
4
COMPARISON OF LINK-LEVEL ROBUSTNESS INDICATORS V.L. Knoop, M. Snelder, H.J. van Zuylen
Figure 3 The city of Rotterdam, the Netherlands Table 2 Network Characteristics
Links Nodes Centroids Paths
Simple 11 5 3 9
Delft network 174 90 12 478
Rotterdam network 454 239 44 2071
Assignment Assignments can be divided according to several criteria, like static or dynamic, user equilibrium or no equilibrium, stochastic or deterministic, path based or link based, single user class or multi user class, unimodal or multimodal and en-route route choice possibility or no en-route route choice possibility. For modelling robustness, especially the difference between static and dynamic assignments and the possibility for en-route assignment are important. It is generally accepted that dynamic assignments are required for correctly modelling robustness. Compared to static assignments, dynamic assignments are better at determining the exact location of congestion and at determining the development over time of congestion. This is important for correctly modelling the effects of variations in demand and capacity (e.g. incidents). The possibility of en-route route choice is important, because in practice a certain percentage of the travellers change their route when they are informed about congestion at a certain location. The importance of en-route route choice is advocated in the thesis of Minwei Li (Li 2007). Tampère et al. (2007) argue that en-route route choice can indeed be of added value, but that it is very difficult to correctly model the en-route route choice of travellers during incidents, because of the uncertainty that is inherent to human behaviour. Especially during incidents this uncertainty is important, because it is not known how many people have information about the incident and how they will respond to that information. Besides these two characteristics, Tampère et al. (2007) also claim that a correct modelling of the way in which congestion builds up (at least consistent with first order traffic flow theory) and a correct modelling of crossings is required for vulnerability analysis. We used the traffic assignment model INDY (Bliemer, 2005 and Bliemer, 2007). INDY is a dynamic path based multi-user class assignment model. The model finds an equilibrium
5
COMPARISON OF LINK-LEVEL ROBUSTNESS INDICATORS V.L. Knoop, M. Snelder, H.J. van Zuylen route set for three driver types: drivers which use a fixed path, drivers with deterministic route choice and drivers with stochastic route choice. In INDY congestion is modelled in line with the first order traffic flow theory. En-route route choice is not possible in INDY. The network assignments were carried out without any blocking of links. The package gives a good representation of the network flows without incidents. Obviously, when facing an incident, it is likely that drivers will deviate from their equilibrium paths. Therefore, for the full calculation a different, non-equilibrium traffic simulator was used. The macroscopic simulator DSMART (Zuurbier et al., 2006) includes en-route route choice and blocking back. The assessment of the vulnerability of each link was done by evaluating the impact of blocking single links using this simulator. In this case, blocking means that 2 lanes were blocked (or one if the link only contains one lane). The number of arrivals in the simulation period was used as performance indicator. More details can be found in (Knoop et al. 2007). Both situations are modelled using different simulation programs. It is preferable to use one program to describe the normal, non-incident situation as well as the situation with rerouting after an incident. Marple (Taale and Zuylen 2004) can model both. For this study, INDY is chosen as it has been tested extensively in practice. It only simulates equilibrium situations. For the en-route assignment model, we choose the model DSMART since we have experience with the program in earlier studies. The assignment on the two test networks was not calibrated. For the network of Rotterdam a calibration that was based on link counts on the motorways was carried out. RESULTS: CORRELATIONS AND ORDERING OF CRITERIA For all three networks, we compared the different criteria. We used three methods. First of all, the mutual cross-correlations were computed. This indicates how good the correlation between the numbers is. The underlying assumption is that the numbers might be linearly dependent. It is the best assumption one can make, but it might not be true. The sum of the correlation coefficients of one criterion with all other criteria, S, indicates whether that criterion shows the same trend as others. SCi = ∑ R(Ci, Cj ) = −1 + ∑ R(Ci, Cj ) . In this formula, i and j are the j ≠i
j
numbers of the criteria. In the second method, each of the criteria orders the links on a vulnerability scale. We compared the orders given by the different criteria. In particular, we analyzed if the links that are indicated as most vulnerable are the same. For that purpose, we computed the relative overlap between the top-n of most vulnerable links. The results are presented in table 3. Thirdly, for the network of Rotterdam, the combined selection power of the criteria was examined. Since the criteria are intended to complement each other, the minimum number of links that is to be selected by each criteria in order to get the complete top x of the full analysis was determined. If for instance link number 10 is the most vulnerable link according to the full analysis, then the position of link 10 is determined in the link ordering of the different criteria. Thereafter the minimum is determined. It could be that C3 is the criterion that gives link 10 the highest rank: position 3. From this, it would be concluded that at least 3 links are to be selected by each criteria. Since it is likely that there is an overlap in the selected links by each criterion, the number of uniquely selected links is also presented.
6
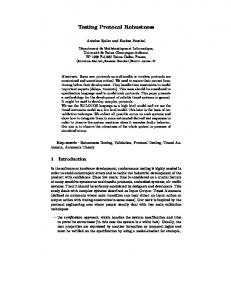
COMPARISON OF LINK-LEVEL ROBUSTNESS INDICATORS V.L. Knoop, M. Snelder, H.J. van Zuylen In the remainder of this section, we highlight some interesting findings for all three networks. Simple Network The indicators are chosen in such a way that bigger values indicate a higher vulnerability for the network. It is therefore remarkable that some of the correlation indices are negative, meaning that a best fit is a negative relationship. S is even negative for C3 and C6. For C3, it can be explained by the exclusion of the motorway links. When the motorway links are vulnerable according to the other criteria and (by exclusion) they are not any more according to C3, the correlation coefficient gets negative. C6 uses C3 as input, so it was expected that it would follow the trend of C3. As that counteracts the average, so will C6. The cross correlation of C3 and C6 is relatively high (0.81). It is also the only combination with the same top-1, top-2, top-3 and top-5 of vulnerable links. The correlation of the C1 and the C10 is the highest of all with an R of 0.99. It is, apart from C3 and C6, the only combination that produces the same top-5 (though not in the same order). Other related combinations are: C1-C4, C1-C5, C1-C9, C1-C10, C2-C8, C4-C9, C4-C10 and C9-C10. Delft Network The strong correlations are the same in the Delft network. The cross correlation values are in the same order of magnitude, but the accordance of the top-n values is lower. Due to the higher number of links, there is less chance of accidentally including the same links in the top-n (n is chosen as a percentage of the total number of links). Here, we find strong correlations in the following combinations: C1-C10 and C3-C6. The value for S varies from 1.2 (C9) to 4.4 (C1). Rotterdam Network In this real-world network, the same combinations of indicators are related as in the other networks. There is one relation that correlates more than in the other networks, C1-C5. The cross correlation value R is 0.85. For this network, we also computed the actual impact if a link is blocked. For all links, we compared the criteria C1 to C10 with the actual result. The correlation is shown in Error! Reference source not found.. None of the indicators can properly predict the consequences of a blocking. The highest R is 0.15. The combined selection power of the links is shown in Figure 4. The figure shows the number of links (y) that is to be selected by each criterion in order to get the complete top x of the actual impact analysis. It also shows the number of unique links that result from selecting y links by each criterion. Finally, the overlap is shown between the top x of links selected by the criteria (ordered by sum of rankings) and the top x of links based on the actual impacts. From the line ‘Number of links required to select per criteria’ it can be concluded that more than 250 links (55% of all links) need to be selected in order to include all links of the top x of most vulnerable links. This is already true of x = 1, which implies that the most vulnerable link is not in the top 250 of any of the criteria. The union of the selections by each criteria include nearly 100% of all the links (‘unique links’line). This implies that, at least for this case, pre-selecting links has hardly any added-value. The ‘overlap line’ shows 20%-35% of the top 5-150 of most vulnerable
7
COMPARISON OF LINK-LEVEL ROBUSTNESS INDICATORS V.L. Knoop, M. Snelder, H.J. van Zuylen links are included in the selection of the top 5-150 of the links with the highest sum of the rankings. This implies that is not just 1 link that is missing in criteria selection. Number of links
Overlap
450
100%
400
90%
350
80% 70%
300
60%
250 200
Number of links required to 50% select per criteria 40%
150
Unique links
30%
100
20% Overlap
50
10%
0
0% 0
50
100
150
200
250
300
350
400
450
Top x
Figure 4 Network of Delft, the Netherlands (Li 2007) Table 3 All correlation results
C1-C2 0.11 0.00 0.00 0.33 0.40 0.75 C1-C3 -0.36 0.00 0.00 0.00 0.00 0.75 C1-C4 0.92 0.00 0.50 0.67 0.80 0.75 C1-C5 0.71 0.00 0.50 0.67 0.80 0.88 C1-C6 -0.48 0.00 0.00 0.00 0.00 0.63 C1-C7 0.06 0.00 0.00 0.00 0.60 0.63 C1-C8 0.60 0.00 0.00 0.33 0.60 0.88 C1-C9 0.89 0.00 0.50 0.33 0.40 0.75 C1-C10 0.99 1.00 0.50 0.67 1.00 1.00 C2-C3 0.86 0.00 0.00 0.00 0.60 0.88 C2-C4 -0.13 0.00 0.00 0.33 0.20 0.63 C2-C5 -0.05 0.00 0.00 0.00 0.40 0.88 C2-C6 0.61 0.00 0.00 0.00 0.60 0.88 C2-C7 -0.22 0.00 0.50 0.33 0.40 0.75 C2-C8 0.85 1.00 0.50 0.67 0.80 0.88 C2-C9 0.08 0.00 0.00 0.00 0.60 0.63
Overlap top- 200
Overlap top- 100
Overlap top- 50
Overlap top- 25
Overlap top- 10
R
Overlap top- 100
Overlap top- 75
Rotterdam Overlap top- 50
Overlap top- 25
Overlap top- 10
Overlap top- 5
R
Delft Overlap top- 8
Overlap top- 5
Overlap top- 3
Overlap top- 2
Overlap top- 1
R
Simple network
0.27 0.00 0.00 0.04 0.20 0.40 0.57 0.22 0.00 0.04 0.06 0.14 0.41 0.16 0.00 0.00 0.00 0.12 0.32 0.53 -0.13 0.00 0.00 0.04 0.21 0.43 0.67 0.00 0.50 0.60 0.42 0.48 0.66 0.54 0.00 0.04 0.16 0.22 0.44 0.37 0.00 0.10 0.60 0.42 0.49 0.63 0.85 0.10 0.08 0.10 0.19 0.37 0.22 0.00 0.00 0.00 0.12 0.29 0.55 0.01 0.00 0.04 0.06 0.25 0.43 0.76 0.20 0.20 0.44 0.36 0.44 0.58 0.58 0.00 0.08 0.10 0.15 0.39 0.69 0.00 0.10 0.32 0.40 0.44 0.64 0.73 0.00 0.20 0.14 0.25 0.42 0.34 0.40 0.20 0.28 0.46 0.44 0.66 0.66 0.00 0.08 0.14 0.21 0.38 0.94 0.00 0.20 0.44 0.38 0.45 0.66 0.93 0.30 0.24 0.28 0.33 0.45 0.34 0.00 0.00 0.00 0.36 0.48 0.61 0.38 0.00 0.04 0.06 0.13 0.38 -0.04 0.00 0.00 0.08 0.26 0.43 0.51 -0.14 0.00 0.08 0.10 0.17 0.41 0.64 0.00 0.00 0.04 0.32 0.47 0.58 0.28 0.00 0.08 0.14 0.18 0.37 0.23 0.00 0.00 0.00 0.36 0.45 0.59 0.06 0.10 0.04 0.02 0.07 0.30 0.32 0.00 0.00 0.08 0.24 0.45 0.66 0.22 0.00 0.04 0.24 0.18 0.35 0.21 0.00 0.00 0.04 0.16 0.35 0.55 0.46 0.00 0.04 0.12 0.17 0.39 0.00 0.20 0.10 0.16 0.22 0.37 0.54 0.18 0.10 0.12 0.14 0.21 0.35
8
COMPARISON OF LINK-LEVEL ROBUSTNESS INDICATORS V.L. Knoop, M. Snelder, H.J. van Zuylen C2-C10 0.00 0.00 0.50 0.67 0.40 0.75 C3-C4 -0.53 0.00 0.00 0.00 0.00 0.75 C3-C5 -0.37 1.00 0.50 0.33 0.20 0.88 C3-C6 0.81 1.00 1.00 1.00 1.00 0.75 C3-C7 -0.24 1.00 0.50 0.33 0.40 0.63 C3-C8 0.50 0.00 0.00 0.00 0.40 0.75 C3-C9 -0.34 0.00 0.00 0.00 0.40 0.63 C3-C10 -0.46 0.00 0.00 0.00 0.00 0.75 C4-C5 0.75 0.00 0.50 0.33 0.60 0.75 C4-C6 -0.57 0.00 0.00 0.00 0.00 0.63 C4-C7 0.08 0.00 0.00 0.00 0.40 0.63 C4-C8 0.35 0.00 0.00 0.33 0.40 0.63 C4-C9 0.94 1.00 0.50 0.33 0.40 0.63 C4-C10 0.95 0.00 0.50 0.67 0.80 0.75 C5-C6 -0.38 1.00 0.50 0.33 0.20 0.75 C5-C7 0.61 1.00 0.50 0.33 0.60 0.63 C5-C8 0.32 0.00 0.00 0.00 0.40 0.75 C5-C9 0.67 0.00 0.00 0.33 0.40 0.63 C5-C10 0.73 0.00 0.50 0.33 0.80 0.88 C6-C7 0.02 1.00 0.50 0.33 0.40 0.75 C6-C8 0.28 0.00 0.00 0.00 0.40 0.75 C6-C9 -0.41 0.00 0.00 0.00 0.40 0.75 C6-C10 -0.54 0.00 0.00 0.00 0.00 0.63 C7-C8 -0.07 0.00 0.50 0.67 0.60 0.75 C7-C9 -0.06 0.00 0.00 0.00 0.40 0.75 C7-C10 0.09 0.00 0.50 0.33 0.60 0.63 C8-C9 0.49 0.00 0.00 0.00 0.60 0.75 C8-C10 0.51 0.00 0.50 0.67 0.60 0.88 C9-C10 0.92 0.00 0.00 0.00 0.40 0.75 C1-FC C2-FC C3-FC C4-FC C5-FC C6-FC C7-FC C8-FC C9-FC C10-FC
0.38 0.00 0.00 0.00 0.24 0.45 0.58 0.17 0.00 0.04 0.12 0.20 0.42 -0.11 0.00 0.00 0.00 0.10 0.41 0.58 -0.17 0.00 0.04 0.08 0.23 0.39 -0.07 0.00 0.00 0.00 0.18 0.40 0.55 -0.11 0.00 0.00 0.08 0.25 0.41 0.85 1.00 1.00 1.00 1.00 0.87 0.89 0.60 0.20 0.20 0.32 0.59 0.74 0.14 0.00 0.00 0.00 0.26 0.43 0.57 -0.09 0.00 0.00 0.14 0.25 0.43 0.67 0.00 0.00 0.00 0.12 0.28 0.47 0.31 0.00 0.00 0.06 0.15 0.33 -0.09 0.00 0.00 0.08 0.10 0.43 0.52 -0.19 0.00 0.00 0.06 0.20 0.41 -0.02 0.00 0.00 0.00 0.12 0.35 0.54 -0.22 0.00 0.00 0.04 0.26 0.43 0.29 0.00 0.10 0.44 0.38 0.45 0.60 0.49 0.10 0.16 0.16 0.22 0.40 -0.06 0.00 0.00 0.00 0.10 0.41 0.60 -0.04 0.00 0.04 0.12 0.18 0.38 0.52 0.00 0.20 0.48 0.38 0.47 0.62 0.29 0.00 0.12 0.12 0.18 0.38 0.28 0.00 0.00 0.28 0.28 0.39 0.58 0.14 0.00 0.08 0.10 0.20 0.42 0.24 0.00 0.10 0.20 0.44 0.49 0.61 0.29 0.00 0.04 0.16 0.20 0.41 0.67 0.40 0.40 0.56 0.46 0.49 0.66 0.61 0.00 0.08 0.22 0.25 0.41 -0.03 0.00 0.00 0.00 0.18 0.41 0.57 0.02 0.00 0.04 0.08 0.22 0.37 0.51 0.00 0.40 0.48 0.38 0.44 0.62 0.61 0.00 0.04 0.10 0.20 0.40 -0.04 0.20 0.30 0.40 0.34 0.44 0.64 0.57 0.00 0.08 0.16 0.24 0.46 0.05 0.00 0.10 0.20 0.32 0.43 0.58 0.57 0.00 0.04 0.18 0.18 0.40 0.56 0.20 0.40 0.52 0.38 0.47 0.64 0.80 0.10 0.08 0.10 0.26 0.40 0.21 0.00 0.00 0.00 0.26 0.43 0.58 0.06 0.00 0.00 0.12 0.27 0.43 0.59 0.00 0.00 0.00 0.12 0.36 0.48 0.24 0.10 0.08 0.08 0.11 0.32 0.03 0.00 0.00 0.08 0.10 0.41 0.53 -0.06 0.00 0.00 0.12 0.23 0.43 0.05 0.00 0.00 0.00 0.12 0.36 0.54 -0.05 0.00 0.00 0.06 0.26 0.41 0.54 0.20 0.20 0.32 0.32 0.49 0.65 0.53 0.00 0.04 0.04 0.18 0.40 0.14 0.20 0.10 0.20 0.34 0.47 0.59 0.38 0.00 0.12 0.14 0.19 0.44 0.75 0.20 0.50 0.52 0.36 0.45 0.65 0.56 0.00 0.04 0.06 0.17 0.39 0.22 0.00 0.00 0.16 0.32 0.47 0.60 0.44 0.00 0.08 0.12 0.28 0.42 0.49 0.00 0.20 0.40 0.36 0.48 0.59 0.61 0.00 0.00 0.10 0.18 0.38 0.32 0.00 0.20 0.20 0.40 0.49 0.62 0.74 0.00 0.04 0.08 0.14 0.38 0.15 0.00 0.00 0.04 0.12 0.39 -0.01 0.00 0.12 0.20 0.21 0.43 0.08 0.00 0.04 0.08 0.11 0.36 0.13 0.20 0.16 0.18 0.24 0.44 0.15 0.10 0.08 0.10 0.23 0.41 0.09 0.00 0.08 0.08 0.08 0.33 0.05 0.00 0.00 0.08 0.20 0.38 0.15 0.10 0.08 0.10 0.21 0.44 0.07 0.00 0.08 0.04 0.15 0.40 0.10 0.00 0.00 0.06 0.17 0.36
CONSLUSION AND RECOMENDATIONS This paper compares different criteria that exist to indicate the most vulnerable links in a network. We found that the different criteria indicate different links as most vulnerable. They
9
COMPARISON OF LINK-LEVEL ROBUSTNESS INDICATORS V.L. Knoop, M. Snelder, H.J. van Zuylen should therefore be seen as complementary. Excluding motorways gives a complete different list of vulnerable links. This implies that the motorways are usually (i.e., by the other indicators) indicated as vulnerable. The Incident Impact, I/(1-I/C), gives the best correlation with the other factors. When comparing it to the fully computed results, though, it is not better than the others. Actually, none of the indicators on its own give a good representation of the full consequences of the blocking of a link. It is also insufficient to take the top-level numbers and analyze them in depth, as the most top-rated vulnerable links differ. Furthermore, a combination of the criteria also didn’t result in a good predication of vulnerable list. The combined selection power of the criteria in the network appeared to be minimal. From this it can be concluded that the quality of these criteria is not good enough to properly identify the most vulnerable links in a network. With this conclusion, it should be kept in mind that we blocked two lanes, which implies that most of the links were fully blocked. It could be that the criteria are capable of selecting the most vulnerable links for partial blockings, which was also the original aim of the criteria that were selected from the paper of (Tampère et al. 2007) A future paper will discuss the quality of the selection criteria for identifying vulnerable links for partial blockings. Furthermore, an analysis will be made in order to find out if new criteria can be introduced that enable us to identify vulnerable links without doing a full computation. ACKNOWLEDGMENTS This research is supported by the Dutch research program Next Generation Infrastructures and by Transumo-ATMA REFERENCES Bliemer, M.J.C. (2007) Dynamic Queuing and Spillback in an Analytical Multiclass Dynamic Network Loading Model. To be published in Transportation Research Record.
Bliemer (2005), M.C.J. INDY 2.0 Model Specifications. Delft University of Technology working report, The Netherlands. Immers, L.H., J.E. Stada and I. Yperman (2004) Robustness and Resilience of Transportation networks; problem survey and examples. Paper presented at NECTAR Cluster Meeting on Reliability of Networks, Amsterdam, March 19-20. Knoop, V.L., S.P Hoogendoorn & H.J. van Zuylen (2007) Quantification of the impact of spillback modelling in assessing network reliability. Delft University of Technology, Faculty of Civil Engineering, Traffic & Planning, TRB 2007 Annual Meeting CD-Rom. Li, M. (2007), thesis upcoming. Murray-Tuite, P.M., Mahmassani, H.S. (2004) Methodology for Determining Vulnerable Links in a Transportation Network. Transportation Research Record 1882, pp 88-96.
10
COMPARISON OF LINK-LEVEL ROBUSTNESS INDICATORS V.L. Knoop, M. Snelder, H.J. van Zuylen Tamminga, G.F., J.C. Maton, R. Poorterman & J. Zee (2005) De Robuustheidscanner. Robuustheid van netwerken: een modelmatige verkenning. Rapport I&M-99366053-GT/mk Grontmij Nederland, i.o.v. Adviesdienst Verkeer & Vervoer. Tampère, M.J., J. Stada & L.H. Immers (2007) Methodology for Identifying Vulnerable Section in a National Road network. Katholieke Universiteit Leuven, Traffic & Infrastructure, TRB 2007 Annual Meeting CD-Rom. Zuurbier, F.S., et al. (2006) A generic approach to generating optimal controlled prescriptive route guidance in realistic traffic networks. Proceedings of the 85th annual meeting of the Transportation Research Board. 2006. Washington. Taale, H. and H. J. v. Zuylen (2004). An heuristic approach to dynamic traffic assignment. seminar Dynamic Traffic Assignment for Reliability Studies, Delft, Trail Research School.
11