1 2 3 4 5 6 7 8 9 10 11 12 13 14 15 16 17 18 19 20 21 22 23 24 25 26 27 28 29 30 31 32 33 34 35 36 37 38 39
Computational Sensitivity Investigation of Hydrogel Injection Characteristics for Myocardial Support Hua Wang1 Christopher B. Rodell2
Madonna E. Lee3 Neville N. Dusaj4 Joseph H. Gorman, III3 Jason A. Burdick2 Robert C. Gorman3 Jonathan F. Wenk1,5*
Department of Mechanical Engineering1 University of Kentucky, Lexington, KY; Department of Bioengineering2 University of Pennsylvania, Philadelphia, PA; Gorman Cardiovascular Research Group and Department of Surgery3 University of Pennsylvania, Philadelphia, PA; Departments of Chemistry and Physics4 University of Pennsylvania, Philadelphia, PA; Department of Surgery5 University of Kentucky, Lexington, KY;
Submitted to: Journal of Biomechanics Article type: Short Communication
*Corresponding Author: Jonathan F. Wenk, Ph.D. University of Kentucky Department of Mechanical Engineering 269 Ralph G. Anderson Building Lexington, KY 40506-0503 Phone: (859) 218-0658 Fax: (859) 257-3304 Email:
[email protected]
40 41 42 1
43
Abstract
44
Biomaterial injection is a potential new therapy for augmenting ventricular mechanics after
45
myocardial infarction (MI). Recent in vivo studies have demonstrated that hydrogel injections can
46
mitigate the adverse remodeling due to MI. More importantly, the material properties of these
47
injections influence the efficacy of the therapy. The goal of the current study is to explore the
48
interrelated effects of injection stiffness and injection volume on diastolic ventricular wall stress
49
and thickness. To achieve this, finite element models were constructed with different hydrogel
50
injection volumes (150 µL and 300 µL), where the modulus was assessed over a range of 0.1 kPa
51
to 100 kPa (based on experimental measurements). The results indicate that a larger injection
52
volume and higher stiffness reduce diastolic myofiber stress the most, by maintaining the wall
53
thickness during loading. Interestingly, the efficacy begins to taper after the hydrogel injection
54
stiffness reaches a value of 50kPa. This computational approach could be used in the future to
55
evaluate the optimal properties of the hydrogel.
56 57 58 59
Keywords: Finite Element Modeling, Biomaterial, Left Ventricular Remodeling
60 61 62 63 2
64
1. Introduction
65
According to the American Heart Association, cardiovascular disease is the leading cause of
66
death worldwide, accounting for more than 17.3 million deaths per year, and is projected to
67
increase to more than 23.6 million by 2030 (Mozaffarian et al., 2016). Roughly 785,000 people in
68
the United States have a myocardial infarction (MI) each year, which can eventually lead to chronic
69
heart failure due to adverse remodeling of the heart wall (Mozaffarian et al., 2016). As such, the
70
material properties of myocardium are an important determinant of global left ventricular (LV)
71
function in both health and disease. One potential treatment strategy being investigated is the use
72
of biocompatible injectable materials as a means of alleviating adverse remodeling. Several
73
formulations of injectable biomaterials have been studied in order to evaluate the impact on wall
74
thickness and global LV function (Dorsey et al., 2015; Ifkovits et al., 2010; Morita et al., 2011;
75
Tous et al., 2011). These in vivo studies have demonstrated that injectable hydrogel injections can
76
mitigate the adverse effects of MI (Dorsey et al., 2015; Rodell et al., 2016).
77
Interestingly, the stiffness of these injections can be tuned to minimize wall thinning and
78
ventricular dilation. Specifically, experimental studies with large animal models were conducted
79
to investigate different hydrogel injections with altered stiffness characteristics, namely, one with
80
a higher stiffness and another with a lower stiffness (Ifkovits et al., 2010; Rodell et al., 2016). The
81
results showed a better ability to limit infarct expansion and remodeling with the higher stiffness
82
hydrogel injection. Inspired by these studies, the current investigation combines experimental data
83
and finite element (FE) modeling to better understand how hydrogel injection stiffness and volume
84
influence myocardial wall stress and wall thickness. This was accomplished by using previously
85
measured MRI data from explanted ovine LVs, which were injected with an array of hydrogel, in
3
86
order to assess in vivo injection geometry. FE models were then constructed to represent various
87
combinations of injection volume within the LV wall, over a range of hydrogel elastic moduli.
88
2. Methods
89
2.1 Finite Element Model
90
In order to evaluate the effects of various hydrogels, FE models of the LV with two different
91
injection volumes (150 µL and 300 µL) were generated, as well as a control model with no
92
injections. The reference configuration of each model was chosen to represent early diastole, since
93
the stress in the LV is at a minimum. The LV FE meshes were produced using tri-linear hexahedral
94
brick elements (TrueGrid; XYZ Scientific, Inc., Livemore, CA). The size and shape of the
95
hydrogel injections (Figure 1, Table 1) were based on MRI reconstruction of injected explant tissue
96
from a previous study. For more detail related to that experimental data, please see the
97
Supplemental Material section in (Rodell et al., 2016). The geometry of the LV wall was based on
98
experimental measurements from ovine hearts (Rodell et al., 2016). For the control case, the
99
undeformed wall thickness was approximately 1.3cm, the inner diameter of the endocardial wall
100
near the equator was 4 cm, and the distance from base to apex was 6.4 cm.
101
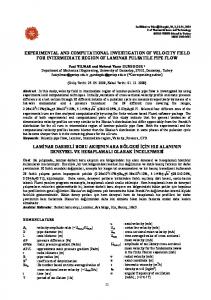
For the models with hydrogel injections, the control model was modified to include a 4 x 4
102
pattern of 16 injections within the myocardium and the spacing between injections was assumed
103
to be 1.5 cm from center to center (Figure 2a) (Rodell et al., 2016; Rodell et al., 2015; Ryan et al.,
104
2009). Since the injections remain as discrete plugs in the LV wall, rather than diffusing into the
105
tissue, the total volume of myocardium must be conserved. This was accomplished by increasing
106
the wall thickness in the injection region within each FE model. For the case of 300 µL injections,
107
the wall thickness was increased by 1.5 mm to account for the volume added to the wall (Figure
108
2b). For the case of 150 µL injections, the wall thickness was increased by 0.5 mm (Figure 2c). 4
109
The LV wall away from the injections, and the longitudinal dimensions, were unaltered relative to
110
the control case. The myofiber orientation was assigned to vary linearly from epicardium to
111
endocardium using the angle of -37 degrees to 83 degrees, respectively (McGarvey et al., 2015).
112
A pressure of 10 mmHg was assigned as a boundary condition on the endocardial surface in each
113
of the FE models, in order to simulate end-diastole.
114
2.2 Material response
115
The material response of the myocardium was represented using a nearly incompressible,
116
transversely isotropic, hyperelastic constitutive law, which was defined using the following strain
117
energy function (Guccione et al., 1991):
118
1
1
(1)
119
where
120
myofiber coordinate system (f = fiber direction, s = cross-fiber in-plane direction, n = transverse-
121
fiber direction) and J is the determinant of the deformation gradient. The diastolic material
122
parameters were assigned to be C=0.51 kPa,
123
while the bulk modulus was
124
frame after infarction, is was assumed that 30 minutes post-MI the myocardial properties around
125
the injections would be roughly unchanged (Holmes et al., 2005).
are the deviatoric components of the Green-Lagrange strain tensor relative to the
=22.84,
=3.45, and
=12 (Rodell et al., 2016),
= 1e103 kPa. Since the model was meant to mimic the initial time
126
The material response of the hydrogel injections was represented using a nearly
127
incompressible, isotropic, hyperelastic constitutive law, which was defined using the following
128
strain energy function:
129
tr
+
ln
(2) 5
130
where
131
natural log operator. The material parameters for Young’s modulus (E) were assigned in a range
132
between 0.1 kPa to 100 kPa, while the Poison ratio ( ) was assigned a value of 0.499. The range
133
for Young’s modulus was based on measurements by Rodell et al. (Rodell et al., 2016), where two
134
formulations with a modulus of 0.8 kPa and 40 kPa were injected into an ovine model of MI.
135
3. Results
is the deviatoric Green-Lagrange strain tensor, tr( ) is the trace operator, and ln( ) is the
136
End-diastolic myofiber stress was assessed along the transmural direction, in between
137
injections, for the different stiffness cases. Figure 3a shows that when the injection stiffness is 0.1
138
kPa the transmural distribution of stress is nearly unchanged compared to the untreated control.
139
For a hydrogel stiffness of 25 kPa, the 150 µL injection reduced the myofiber stress by roughly
140
18.9% at the epicardium, 0% at mid-myocardium, and 21.6% at endocardium compared to the
141
control (Figure 3b). However, the 300 µL injection reduced the myofiber stress by roughly 31%
142
at the epicardium, 10.6% at the mid-myocardium, and 34.7% at the endocardium compared to the
143
control (Figure 3b). For a hydrogel stiffness of 100 kPa, the 150 µL injection reduced the myofiber
144
stress by roughly 39.2% at the epicardium, 18.3% at mid-myocardium, and 38.7% at the
145
endocardium compared to the control (Figure 3c). However, the 300 µL injection reduced the
146
myofiber stress by roughly 56.8% at the epicardium, 36.5% at the mid-myocardium, and 55.2% at
147
the endocardium compared to the control (Figure 3c).
148
Additionally, the average myofiber stress in the myocardium surrounding the 150 µL and 300
149
µL injections, using different hydrogel stiffness values, is shown in Figure 4. When the injection
150
stiffness is increased, the myofiber stress was decreased. It should be noted that the influence of
151
stiffness begins to taper after 50 kPa. Figure 5 shows the average wall thickness as a function of
152
injection stiffness. When the injection stiffness increased, the wall thickness was increased. The 6
153
average wall thickness at end-diastole for the control was approximately 1cm, while the thickness
154
for the 150 µL injection with 25 kPa stiffness was 1.1cm and 300 µL was 1.2cm. For the case of
155
150 µL injection with 100 kPa stiffness, the thickness was 1.2cm, while 300 µL was 1.3cm. This
156
is primarily driven by the fact that the stiffer injections maintained their original shape during
157
deformation, which allows the LV wall to remain thick (Figure 6c and 6f). On the other hand, it
158
can be seen that the 0.1 kPa injections effectively collapse in the transmural direction as the LV
159
wall is loaded by the pressure on the endocardium (Figure 6a and 6d). Figure 6 also shows the
160
distribution of end-diastolic myofiber stress throughout the LV wall around the 150 µL injections
161
(Figure 6 a-c) and 300 µL injections (Figure 6 d-f), with stiffness values of 0.1 kPa, 25 kPa and
162
100 kPa, respectively. It is clear that the myofiber stress showed a greater reduction around the
163
hydrogel injection region when the volume was larger and the stiffness was higher.
164
Table 2 shows the end-diastolic volume (EDV) in the FE models, using various combinations
165
of injection volume and stiffness. For the case of 150 µL injections, it can be seen that the EDV
166
decreases, relative to the control case, by 0.6%, 2.0%, and 3.5%, using stiffness values of 0.1 kPa,
167
25 kPa and 100 kPa, respectively. For the case of 300 µL injections, it can be seen that the EDV
168
decreases by 2.5%, 4.8%, and 7.0%, using stiffness values of 0.1 kPa, 25 kPa and 100 kPa,
169
respectively. As noted above, the influence of injection stiffness on myofiber stress tapers after 50
170
kPa. By using stiffness values below this level, the decrease in EDV would be less than 5.0%.
171
4. Discussion
172
The goal of the current study was to assess the effect of different attributes that can be tuned
173
for hydrogel injections. More specifically, this work utilized a combination of previously measured
174
MRI data and FE modeling to investigate how injection stiffness and volume influence myocardial
175
wall stress and wall thickness. The modeling results show a clear reduction of myofiber stress 7
176
based on the higher hydrogel injection volume. Additionally, by tuning the stiffness of the
177
hydrogel, greater reductions in stress can be achieved. The current results indicated that stiffer
178
hydrogel injections could reduce myofiber stress further. These improvements appear to taper after
179
a stiffness of 50 kPa.
180
Previous studies have used FE modeling to assess the influence of biomaterial injections on
181
LV function and wall stress. Kichula et al. (Kichula et al., 2014) examined the effects of a single
182
hydrogel formulation, which diffused between the tissue, and a single injection volume on LV wall
183
stress. It was found that the injections increased the effective stiffness of the tissue and decreased
184
stress in the wall. Two other studies examined the effects of varying the volume of the injections
185
on wall stress and LV ejection fraction, but did not examine the effects of injection stiffness. Lee
186
et al. (Lee et al., 2014) used a patient-specific FE model to show that increasing the injection
187
volume decreased both the end-diastolic and end-systolic stress in the myocardium. Wise et al.
188
(Wise et al., 2016) used an animal-specific FE model of a rat heart to investigate a wide range of
189
injection volumes in a model of MI. Interestingly, it was found that the beneficial effects of the
190
injection began to diminish once the volume fraction of the injection exceeded 50% of the MI
191
region. It should be noted that the volume fraction of hydrogel injection to treated myocardium in
192
the current study was less than 15%. Also, the results of the current study were consistent with
193
these previous studies, in terms of decreasing myofiber stress with increased injection volume.
194
However, the current study showed the additional benefit of tuning the injection stiffness to reduce
195
stress.
196
In addition to FE modeling studies, several experimental studies with large animal models have
197
been conducted. Ifkovits et al. found that stiffer hydrogel injections led to a reduction in adverse
198
remodeling in the MI region, i.e., the MI region was smaller in animals treated with stiffer 8
199
hydrogels, compared with the control infarct group (Ifkovits et al., 2010). In work done by Plotkin
200
et al., it was shown that hydrogels with the highest stiffness exhibited the best rescue of heart
201
function (Plotkin et al., 2014), in terms of ejection fraction. Also, in another previous experimental
202
study, it was shown that the higher stiffness hydrogel injection improved the ejection fraction after
203
8 weeks but not the lower stiffness hydrogel injection; and LVEDV measured using the higher
204
stiffness hydrogel was smaller than the lower stiffness hydrogel (Rodell et al., 2016). All of these
205
experimental studies showed greater benefit with a higher stiffness hydrogel, in terms of better LV
206
geometry and function. This is consistent with the current FE modeling results, which indicate that
207
the higher stiffness hydrogel injections are more beneficial. Additionally, previous injectable
208
biomaterial studies have demonstrated that injections can increase LV wall thickness and the
209
effective stiffness of the infarct region (Ifkovits et al., 2010; Landa et al., 2008; Morita et al., 2011;
210
Mukherjee et al., 2008; Rane and Christman, 2011; Ryan et al., 2009). This is also consistent with
211
the current results, in which a higher injection stiffness led to increased wall thickness due to better
212
retention of injection shape.
213
One limitation of the current study is that it only focused on changes induced during the
214
diastolic phase, due to hydrogel injection. Further studies are needed to assess changes in stress
215
during systolic contraction. Additionally, the residual stresses that are developed during the
216
injection process were not taken into account in the model. Finally, the current work only looked
217
at the acute effects of the hydrogel injection post-MI. Future studies will include experimental data
218
from later time points after the ventricle has been treated.
219
In conclusion, the current work demonstrated that FE modeling can be used to predict how the
220
LV wall thickness and myofiber stress change as a function of different hydrogel characteristics.
221
This approach could be used as a tool for developing tunable hydrogel injections and predicting 9
222
stress reduction and heart function post-MI. In the future, this method will be used to examine
223
more optimal injectable biomaterial properties, which would be valuable clinical treatments for
224
myocardial infarction.
225 226 227
Conflict of interest statement
228
None of the authors have any commercial or other interest that are in conflict with the integrity of
229
this work.
230 231
Acknowledgments
232
This study was supported by National Institutes of Health grants R01 HL063954 (R. Gorman) and
233
R01 HL111090 (J. Burdick), as well as a grant from the National Science Foundation CMMI-
234
1538754 (J. Wenk).
235 236 237 238 239 240 241 242 243 244 10
245
Reference
246
Dorsey, S.M., McGarvey, J.R., Wang, H., Nikou, A., Arama, L., Koomalsingh, K.J., Kondo,
247
N., Gorman, J.H., Pilla, J.J., Gorman, R.C., 2015. MRI evaluation of injectable hyaluronic acid-
248
based hydrogel therapy to limit ventricular remodeling after myocardial infarction. Biomaterials
249
69, 65-75.
250 251
Guccione, J.M., McCulloch, A.D., Waldman, L.K., 1991. Passive material properties of intact ventricular myocardium determined from a cylindrical model. J Biomech Eng 113, 42-55.
252 253
Holmes, J.W., Borg, T.K., Covell, J.W., 2005. Structure and mechanics of healing myocardial infarcts. Annu Rev Biomed Eng 7, 223-253.
254
Ifkovits, J.L., Tous, E., Minakawa, M., Morita, M., Robb, J.D., Koomalsingh, K.J., Gorman,
255
J.H., Gorman, R.C., Burdick, J.A., 2010. Injectable hydrogel properties influence infarct expansion
256
and extent of postinfarction left ventricular remodeling in an ovine model. Proceedings of the
257
National Academy of Sciences 107, 11507-11512.
258
Kichula, E.T., Wang, H., Dorsey, S.M., Szczesny, S.E., Elliott, D.M., Burdick, J.A., Wenk,
259
J.F., 2014. Experimental and computational investigation of altered mechanical properties in
260
myocardium after hydrogel injection. Ann Biomed Eng 42, 1546-1556.
261
Landa, N., Miller, L., Feinberg, M.S., Holbova, R., Shachar, M., Freeman, I., Cohen, S., Leor,
262
J., 2008. Effect of injectable alginate implant on cardiac remodeling and function after recent and
263
old infarcts in rat. Circulation 117, 1388-1396.
264 265
Lee, L.C., Wall, S.T., Genet, M., Hinson, A., Guccione, J.M., 2014. Bioinjection treatment: effects of post-injection residual stress on left ventricular wall stress. J Biomech 47, 3115-3119.
266
McGarvey, J.R., Mojsejenko, D., Dorsey, S.M., Nikou, A., Burdick, J.A., Gorman, J.H.,
267
Jackson, B.M., Pilla, J.J., Gorman, R.C., Wenk, J.F., 2015. Temporal changes in infarct material
11
268
properties: an in vivo assessment using magnetic resonance imaging and finite element
269
simulations. The Annals of thoracic surgery 100, 582-589.
270
Morita, M., Eckert, C.E., Matsuzaki, K., Noma, M., Ryan, L.P., Burdick, J.A., Jackson, B.M.,
271
Gorman, J.H., 3rd, Sacks, M.S., Gorman, R.C., 2011. Modification of infarct material properties
272
limits adverse ventricular remodeling. Ann Thorac Surg 92, 617-624.
273
Mozaffarian, D., Benjamin, E.J., Go, A.S., Arnett, D.K., Blaha, M.J., Cushman, M., Das, S.R.,
274
de Ferranti, S., Després, J.-p., Fullerton, H.J., 2016. Executive summary: Heart Disease and Stroke
275
Statistics-2016 update: A report from the American Heart Association. Circulation 133, 447.
276
Mukherjee, R., Zavadzkas, J.A., Saunders, S.M., McLean, J.E., Jeffords, L.B., Beck, C.,
277
Stroud, R.E., Leone, A.M., Koval, C.N., Rivers, W.T., 2008. Targeted myocardial microinjections
278
of a biocomposite material reduces infarct expansion in pigs. The Annals of Thoracic Surgery 86,
279
1268-1276.
280
Plotkin, M., Vaibavi, S.R., Rufaihah, A.J., Nithya, V., Wang, J., Shachaf, Y., Kofidis, T.,
281
Seliktar, D., 2014. The effect of matrix stiffness of injectable hydrogels on the preservation of
282
cardiac function after a heart attack. Biomaterials 35, 1429-1438.
283 284
Rane, A.A., Christman, K.L., 2011. Biomaterials for the treatment of myocardial infarction: a 5-year update. J Am Coll Cardiol 58, 2615-2629.
285
Rodell, C.B., Lee, M.E., Wang, H., Takebayashi, S., Takayama, T., Kawamura, T., Arkles,
286
J.S., Dusaj, N.N., Dorsey, S.M., Witschey, W.R., 2016. Injectable shear-thinning hydrogels for
287
minimally invasive delivery to infarcted myocardium to limit left ventricular remodeling.
288
Circulation: Cardiovascular Interventions 9, e004058.
12
289
Rodell, C.B., MacArthur, J.W., Dorsey, S.M., Wade, R.J., Wang, L.L., Woo, Y.J., Burdick,
290
J.A., 2015. Shear-Thinning Supramolecular Hydrogels with Secondary Autonomous Covalent
291
Crosslinking to Modulate Viscoelastic Properties In Vivo. Adv Funct Mater 25, 636-644.
292
Ryan, L.P., Matsuzaki, K., Noma, M., Jackson, B.M., Eperjesi, T.J., Plappert, T.J., John-
293
Sutton, M.G.S., Gorman, J.H., Gorman, R.C., 2009. Dermal filler injection: a novel approach for
294
limiting infarct expansion. The Annals of thoracic surgery 87, 148-155.
295 296
Tous, E., Purcell, B., Ifkovits, J.L., Burdick, J.A., 2011. Injectable acellular hydrogels for cardiac repair. Journal of cardiovascular translational research 4, 528-542.
297
Wise, P., Davies, N.H., Sirry, M.S., Kortsmit, J., Dubuis, L., Chai, C.K., Baaijens, F.P., Franz,
298
T., 2016. Excessive volume of hydrogel injectates may compromise the efficacy for the treatment
299
of acute myocardial infarction. Int J Numer Method Biomed Eng 32.
300 301 302 303 304 305 306 307 308 309 310 311
13
312
Tables
313
150 µL
300 µL
a
5.50 mm
6.60 mm
b
3.15 mm
3.94 mm
c
2.40 mm
2.73 mm
314 315
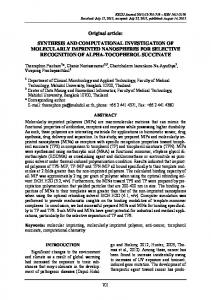
Table 1: Ellipsoidal dimensions of the 150 µL hydrogel injection and 300 µL hydrogel injection,
316
based on MRI data (Rodell et al., 2015).
317
150 µL
300 µL
0.1 kPa
109.4 mL
107.3 mL
25 kPa
107.9 mL
104.8 mL
100 kPa
106.3 mL
102.4 mL
318 319
Table 2: End-diastolic volume in the FE model for different combinations of injection stiffness
320
and volume. Note: The control end-diastolic volume is 110.1 mL.
321 322 323
14
324
Figure Captions
325
Figure 1: Hydrogel injections are well retained and can be approximated as an ellipsoid with
326
characteristic dimensions a, b, and c.
327
Figure 2: (a) FE model of an ovine LV with 16 150 µL hydrogel injections. (b) Short axis view
328
of the LV wall with 150 µL hydrogel injections. (c) Short axis view of the LV wall with 300 µL
329
hydrogel injections.
330
Figure 3: Transmural distribution of end-diastolic myofiber stress using a stiffness of (a) 0.1 kPa, (b) 25
331
kPa and (c) 100 kPa, comparing between the conrol and injection volumes of 150 µL and 300µL. Note:
332
The transmural direction along which the stress was assessed is shown as a thick black line, in
333
between injections, in Figure 6.
334
Figure 4: Average end-diastolic myofiber stress surrounding the injection as a function of
335
injection stiffness and volume.
336
Figure 5: Average end-diastolic myocardial wall thickness in the injection region as a function of
337
injection stiffness and volume.
338
Figure 6: The LV end-diastolic myofiber stress distribution around (a-c) 150 µL injections and
339
(d-f) 300 µL injections with stiffness values of 0.1 kPa, 25 kPa and 100 kPa, respectively.
340 341 342 343 344 345 15
346
Figures
347 348
16
Figure 1 Click here to download Figure: figure1.pptx
Figure 1
Figure 2 Click here to download Figure: figure2.pptx
Figure 2
(a)
(b)
(c)
Figure 3 Click here to download Figure: figure3.pptx
Figure 3
(a)
(b)
(c)
Figure 4 Click here to download Figure: figure4.pptx
Figure 4
Figure 5 Click here to download Figure: figure5.pptx
Figure 5
Figure 6 Click here to download Figure: figure6_mod.pptx
Figure 6
(a)
(c)
(b)
(d)
(e) 0.1 kPa
(f) 25 kPa
100 kPa