Sensors & Transducers Volume 128, Issue 5, May 2011
www.sensorsportal.com
ISSN 1726-5479
Editors-in-Chief: professor Sergey Y. Yurish, tel.: +34 696067716, e-mail:
[email protected] Editors for Western Europe Meijer, Gerard C.M., Delft University of Technology, The Netherlands Ferrari, Vittorio, Universitá di Brescia, Italy Editor South America Costa-Felix, Rodrigo, Inmetro, Brazil
Editors for North America Datskos, Panos G., Oak Ridge National Laboratory, USA Fabien, J. Josse, Marquette University, USA Katz, Evgeny, Clarkson University, USA Editor for Asia Ohyama, Shinji, Tokyo Institute of Technology, Japan
Editor for Eastern Europe Sachenko, Anatoly, Ternopil State Economic University, Ukraine
Editor for Asia-Pacific Mukhopadhyay, Subhas, Massey University, New Zealand
Editorial Advisory Board Abdul Rahim, Ruzairi, Universiti Teknologi, Malaysia Ahmad, Mohd Noor, Nothern University of Engineering, Malaysia Annamalai, Karthigeyan, National Institute of Advanced Industrial Science and Technology, Japan Arcega, Francisco, University of Zaragoza, Spain Arguel, Philippe, CNRS, France Ahn, Jae-Pyoung, Korea Institute of Science and Technology, Korea Arndt, Michael, Robert Bosch GmbH, Germany Ascoli, Giorgio, George Mason University, USA Atalay, Selcuk, Inonu University, Turkey Atghiaee, Ahmad, University of Tehran, Iran Augutis, Vygantas, Kaunas University of Technology, Lithuania Avachit, Patil Lalchand, North Maharashtra University, India Ayesh, Aladdin, De Montfort University, UK Azamimi, Azian binti Abdullah, Universiti Malaysia Perlis, Malaysia Bahreyni, Behraad, University of Manitoba, Canada Baliga, Shankar, B., General Monitors Transnational, USA Baoxian, Ye, Zhengzhou University, China Barford, Lee, Agilent Laboratories, USA Barlingay, Ravindra, RF Arrays Systems, India Basu, Sukumar, Jadavpur University, India Beck, Stephen, University of Sheffield, UK Ben Bouzid, Sihem, Institut National de Recherche Scientifique, Tunisia Benachaiba, Chellali, Universitaire de Bechar, Algeria Binnie, T. David, Napier University, UK Bischoff, Gerlinde, Inst. Analytical Chemistry, Germany Bodas, Dhananjay, IMTEK, Germany Borges Carval, Nuno, Universidade de Aveiro, Portugal Bousbia-Salah, Mounir, University of Annaba, Algeria Bouvet, Marcel, CNRS – UPMC, France Brudzewski, Kazimierz, Warsaw University of Technology, Poland Cai, Chenxin, Nanjing Normal University, China Cai, Qingyun, Hunan University, China Campanella, Luigi, University La Sapienza, Italy Carvalho, Vitor, Minho University, Portugal Cecelja, Franjo, Brunel University, London, UK Cerda Belmonte, Judith, Imperial College London, UK Chakrabarty, Chandan Kumar, Universiti Tenaga Nasional, Malaysia Chakravorty, Dipankar, Association for the Cultivation of Science, India Changhai, Ru, Harbin Engineering University, China Chaudhari, Gajanan, Shri Shivaji Science College, India Chavali, Murthy, N.I. Center for Higher Education, (N.I. University), India Chen, Jiming, Zhejiang University, China Chen, Rongshun, National Tsing Hua University, Taiwan Cheng, Kuo-Sheng, National Cheng Kung University, Taiwan Chiang, Jeffrey (Cheng-Ta), Industrial Technol. Research Institute, Taiwan Chiriac, Horia, National Institute of Research and Development, Romania Chowdhuri, Arijit, University of Delhi, India Chung, Wen-Yaw, Chung Yuan Christian University, Taiwan Corres, Jesus, Universidad Publica de Navarra, Spain Cortes, Camilo A., Universidad Nacional de Colombia, Colombia Courtois, Christian, Universite de Valenciennes, France Cusano, Andrea, University of Sannio, Italy D'Amico, Arnaldo, Università di Tor Vergata, Italy De Stefano, Luca, Institute for Microelectronics and Microsystem, Italy Deshmukh, Kiran, Shri Shivaji Mahavidyalaya, Barshi, India Dickert, Franz L., Vienna University, Austria Dieguez, Angel, University of Barcelona, Spain Dimitropoulos, Panos, University of Thessaly, Greece Ding, Jianning, Jiangsu Polytechnic University, China Djordjevich, Alexandar, City University of Hong Kong, Hong Kong Donato, Nicola, University of Messina, Italy
Donato, Patricio, Universidad de Mar del Plata, Argentina Dong, Feng, Tianjin University, China Drljaca, Predrag, Instersema Sensoric SA, Switzerland Dubey, Venketesh, Bournemouth University, UK Enderle, Stefan, Univ.of Ulm and KTB Mechatronics GmbH, Germany Erdem, Gursan K. Arzum, Ege University, Turkey Erkmen, Aydan M., Middle East Technical University, Turkey Estelle, Patrice, Insa Rennes, France Estrada, Horacio, University of North Carolina, USA Faiz, Adil, INSA Lyon, France Fericean, Sorin, Balluff GmbH, Germany Fernandes, Joana M., University of Porto, Portugal Francioso, Luca, CNR-IMM Institute for Microelectronics and Microsystems, Italy Francis, Laurent, University Catholique de Louvain, Belgium Fu, Weiling, South-Western Hospital, Chongqing, China Gaura, Elena, Coventry University, UK Geng, Yanfeng, China University of Petroleum, China Gole, James, Georgia Institute of Technology, USA Gong, Hao, National University of Singapore, Singapore Gonzalez de la Rosa, Juan Jose, University of Cadiz, Spain Granel, Annette, Goteborg University, Sweden Graff, Mason, The University of Texas at Arlington, USA Guan, Shan, Eastman Kodak, USA Guillet, Bruno, University of Caen, France Guo, Zhen, New Jersey Institute of Technology, USA Gupta, Narendra Kumar, Napier University, UK Hadjiloucas, Sillas, The University of Reading, UK Haider, Mohammad R., Sonoma State University, USA Hashsham, Syed, Michigan State University, USA Hasni, Abdelhafid, Bechar University, Algeria Hernandez, Alvaro, University of Alcala, Spain Hernandez, Wilmar, Universidad Politecnica de Madrid, Spain Homentcovschi, Dorel, SUNY Binghamton, USA Horstman, Tom, U.S. Automation Group, LLC, USA Hsiai, Tzung (John), University of Southern California, USA Huang, Jeng-Sheng, Chung Yuan Christian University, Taiwan Huang, Star, National Tsing Hua University, Taiwan Huang, Wei, PSG Design Center, USA Hui, David, University of New Orleans, USA Jaffrezic-Renault, Nicole, Ecole Centrale de Lyon, France Jaime Calvo-Galleg, Jaime, Universidad de Salamanca, Spain James, Daniel, Griffith University, Australia Janting, Jakob, DELTA Danish Electronics, Denmark Jiang, Liudi, University of Southampton, UK Jiang, Wei, University of Virginia, USA Jiao, Zheng, Shanghai University, China John, Joachim, IMEC, Belgium Kalach, Andrew, Voronezh Institute of Ministry of Interior, Russia Kang, Moonho, Sunmoon University, Korea South Kaniusas, Eugenijus, Vienna University of Technology, Austria Katake, Anup, Texas A&M University, USA Kausel, Wilfried, University of Music, Vienna, Austria Kavasoglu, Nese, Mugla University, Turkey Ke, Cathy, Tyndall National Institute, Ireland Khelfaoui, Rachid, Université de Bechar, Algeria Khan, Asif, Aligarh Muslim University, Aligarh, India Kim, Min Young, Kyungpook National University, Korea South Ko, Sang Choon, Electronics. and Telecom. Research Inst., Korea South Kotulska, Malgorzata, Wroclaw University of Technology, Poland Kratz, Henrik, Uppsala University, Sweden Kockar, Hakan, Balikesir University, Turkey Kong, Ing, RMIT University, Australia
Kumar, Arun, University of South Florida, USA Kumar, Subodh, National Physical Laboratory, India Kung, Chih-Hsien, Chang-Jung Christian University, Taiwan Lacnjevac, Caslav, University of Belgrade, Serbia Lay-Ekuakille, Aime, University of Lecce, Italy Lee, Jang Myung, Pusan National University, Korea South Lee, Jun Su, Amkor Technology, Inc. South Korea Lei, Hua, National Starch and Chemical Company, USA Li, Genxi, Nanjing University, China Li, Hui, Shanghai Jiaotong University, China Li, Xian-Fang, Central South University, China Li, Yuefa, Wayne State University, USA Liang, Yuanchang, University of Washington, USA Liawruangrath, Saisunee, Chiang Mai University, Thailand Liew, Kim Meow, City University of Hong Kong, Hong Kong Lin, Hermann, National Kaohsiung University, Taiwan Lin, Paul, Cleveland State University, USA Linderholm, Pontus, EPFL - Microsystems Laboratory, Switzerland Liu, Aihua, University of Oklahoma, USA Liu Changgeng, Louisiana State University, USA Liu, Cheng-Hsien, National Tsing Hua University, Taiwan Liu, Songqin, Southeast University, China Lodeiro, Carlos, University of Vigo, Spain Lorenzo, Maria Encarnacio, Universidad Autonoma de Madrid, Spain Lukaszewicz, Jerzy Pawel, Nicholas Copernicus University, Poland Ma, Zhanfang, Northeast Normal University, China Majstorovic, Vidosav, University of Belgrade, Serbia Marquez, Alfredo, Centro de Investigacion en Materiales Avanzados, Mexico Matay, Ladislav, Slovak Academy of Sciences, Slovakia Mathur, Prafull, National Physical Laboratory, India Maurya, D.K., Institute of Materials Research and Engineering, Singapore Mekid, Samir, University of Manchester, UK Melnyk, Ivan, Photon Control Inc., Canada Mendes, Paulo, University of Minho, Portugal Mennell, Julie, Northumbria University, UK Mi, Bin, Boston Scientific Corporation, USA Minas, Graca, University of Minho, Portugal Moghavvemi, Mahmoud, University of Malaya, Malaysia Mohammadi, Mohammad-Reza, University of Cambridge, UK Molina Flores, Esteban, Benemérita Universidad Autónoma de Puebla, Mexico Moradi, Majid, University of Kerman, Iran Morello, Rosario, University "Mediterranea" of Reggio Calabria, Italy Mounir, Ben Ali, University of Sousse, Tunisia Mulla, Imtiaz Sirajuddin, National Chemical Laboratory, Pune, India Nabok, Aleksey, Sheffield Hallam University, UK Neelamegam, Periasamy, Sastra Deemed University, India Neshkova, Milka, Bulgarian Academy of Sciences, Bulgaria Oberhammer, Joachim, Royal Institute of Technology, Sweden Ould Lahoucine, Cherif, University of Guelma, Algeria Pamidighanta, Sayanu, Bharat Electronics Limited (BEL), India Pan, Jisheng, Institute of Materials Research & Engineering, Singapore Park, Joon-Shik, Korea Electronics Technology Institute, Korea South Penza, Michele, ENEA C.R., Italy Pereira, Jose Miguel, Instituto Politecnico de Setebal, Portugal Petsev, Dimiter, University of New Mexico, USA Pogacnik, Lea, University of Ljubljana, Slovenia Post, Michael, National Research Council, Canada Prance, Robert, University of Sussex, UK Prasad, Ambika, Gulbarga University, India Prateepasen, Asa, Kingmoungut's University of Technology, Thailand Pullini, Daniele, Centro Ricerche FIAT, Italy Pumera, Martin, National Institute for Materials Science, Japan Radhakrishnan, S. National Chemical Laboratory, Pune, India Rajanna, K., Indian Institute of Science, India Ramadan, Qasem, Institute of Microelectronics, Singapore Rao, Basuthkar, Tata Inst. of Fundamental Research, India Raoof, Kosai, Joseph Fourier University of Grenoble, France Rastogi Shiva, K. University of Idaho, USA Reig, Candid, University of Valencia, Spain Restivo, Maria Teresa, University of Porto, Portugal Robert, Michel, University Henri Poincare, France Rezazadeh, Ghader, Urmia University, Iran Royo, Santiago, Universitat Politecnica de Catalunya, Spain Rodriguez, Angel, Universidad Politecnica de Cataluna, Spain Rothberg, Steve, Loughborough University, UK Sadana, Ajit, University of Mississippi, USA Sadeghian Marnani, Hamed, TU Delft, The Netherlands Sandacci, Serghei, Sensor Technology Ltd., UK Sapozhnikova, Ksenia, D.I.Mendeleyev Institute for Metrology, Russia Saxena, Vibha, Bhbha Atomic Research Centre, Mumbai, India Schneider, John K., Ultra-Scan Corporation, USA
Sengupta, Deepak, Advance Bio-Photonics, India Seif, Selemani, Alabama A & M University, USA Seifter, Achim, Los Alamos National Laboratory, USA Shah, Kriyang, La Trobe University, Australia Silva Girao, Pedro, Technical University of Lisbon, Portugal Singh, V. R., National Physical Laboratory, India Slomovitz, Daniel, UTE, Uruguay Smith, Martin, Open University, UK Soleymanpour, Ahmad, Damghan Basic Science University, Iran Somani, Prakash R., Centre for Materials for Electronics Technol., India Srinivas, Talabattula, Indian Institute of Science, Bangalore, India Srivastava, Arvind K., NanoSonix Inc., USA Stefan-van Staden, Raluca-Ioana, University of Pretoria, South Africa Sumriddetchka, Sarun, National Electronics and Computer Technology Center, Thailand Sun, Chengliang, Polytechnic University, Hong-Kong Sun, Dongming, Jilin University, China Sun, Junhua, Beijing University of Aeronautics and Astronautics, China Sun, Zhiqiang, Central South University, China Suri, C. Raman, Institute of Microbial Technology, India Sysoev, Victor, Saratov State Technical University, Russia Szewczyk, Roman, Industrial Research Inst. for Automation and Measurement, Poland Tan, Ooi Kiang, Nanyang Technological University, Singapore, Tang, Dianping, Southwest University, China Tang, Jaw-Luen, National Chung Cheng University, Taiwan Teker, Kasif, Frostburg State University, USA Thirunavukkarasu, I., Manipal University Karnataka, India Thumbavanam Pad, Kartik, Carnegie Mellon University, USA Tian, Gui Yun, University of Newcastle, UK Tsiantos, Vassilios, Technological Educational Institute of Kaval, Greece Tsigara, Anna, National Hellenic Research Foundation, Greece Twomey, Karen, University College Cork, Ireland Valente, Antonio, University, Vila Real, - U.T.A.D., Portugal Vanga, Raghav Rao, Summit Technology Services, Inc., USA Vaseashta, Ashok, Marshall University, USA Vazquez, Carmen, Carlos III University in Madrid, Spain Vieira, Manuela, Instituto Superior de Engenharia de Lisboa, Portugal Vigna, Benedetto, STMicroelectronics, Italy Vrba, Radimir, Brno University of Technology, Czech Republic Wandelt, Barbara, Technical University of Lodz, Poland Wang, Jiangping, Xi'an Shiyou University, China Wang, Kedong, Beihang University, China Wang, Liang, Pacific Northwest National Laboratory, USA Wang, Mi, University of Leeds, UK Wang, Shinn-Fwu, Ching Yun University, Taiwan Wang, Wei-Chih, University of Washington, USA Wang, Wensheng, University of Pennsylvania, USA Watson, Steven, Center for NanoSpace Technologies Inc., USA Weiping, Yan, Dalian University of Technology, China Wells, Stephen, Southern Company Services, USA Wolkenberg, Andrzej, Institute of Electron Technology, Poland Woods, R. Clive, Louisiana State University, USA Wu, DerHo, National Pingtung Univ. of Science and Technology, Taiwan Wu, Zhaoyang, Hunan University, China Xiu Tao, Ge, Chuzhou University, China Xu, Lisheng, The Chinese University of Hong Kong, Hong Kong Xu, Sen, Drexel University, USA Xu, Tao, University of California, Irvine, USA Yang, Dongfang, National Research Council, Canada Yang, Shuang-Hua, Loughborough University, UK Yang, Wuqiang, The University of Manchester, UK Yang, Xiaoling, University of Georgia, Athens, GA, USA Yaping Dan, Harvard University, USA Ymeti, Aurel, University of Twente, Netherland Yong Zhao, Northeastern University, China Yu, Haihu, Wuhan University of Technology, China Yuan, Yong, Massey University, New Zealand Yufera Garcia, Alberto, Seville University, Spain Zakaria, Zulkarnay, University Malaysia Perlis, Malaysia Zagnoni, Michele, University of Southampton, UK Zamani, Cyrus, Universitat de Barcelona, Spain Zeni, Luigi, Second University of Naples, Italy Zhang, Minglong, Shanghai University, China Zhang, Qintao, University of California at Berkeley, USA Zhang, Weiping, Shanghai Jiao Tong University, China Zhang, Wenming, Shanghai Jiao Tong University, China Zhang, Xueji, World Precision Instruments, Inc., USA Zhong, Haoxiang, Henan Normal University, China Zhu, Qing, Fujifilm Dimatix, Inc., USA Zorzano, Luis, Universidad de La Rioja, Spain Zourob, Mohammed, University of Cambridge, UK
Sensors & Transducers Journal (ISSN 1726-5479) is a peer review international journal published monthly online by International Frequency Sensor Association (IFSA). Available in electronic and on CD. Copyright © 2011 by International Frequency Sensor Association. All rights reserved.
Sensors & Transducers Journal
Contents Volume 128 Issue 5 May 2011
www.sensorsportal.com
ISSN 1726-5479
Research Articles Handbook of Laboratory Measurements and Instrumentation: Editorial Review Sergey Y. Yurish.................................................................................................................................
I
Designing Fuzzy Adaptive Nonlinear Filter for Land Vehicle Ultra-Tightly Coupled Integrated Navigation Sensor Fusion Chien-Hao Tseng, Dah-Jing Jwo .......................................................................................................
1
Condition Monitoring of a Process Filter Applying Wireless Vibration Analysis Pekka Koskela, Marko Paavola, Jukka Karjanlahti and Kauko Leiviskä............................................
17
Analysis of Radio Model Performance for Clustering Sensor Networks H. Bello-Salau, A. F. Salami, F. Anwar, Md. Rafiqul Islam ................................................................
27
Wireless Crankarm Dynamometer for Cycling Caetano Decian Lazzari, Alexandre Balbinot.....................................................................................
39
Prediction of the Surface Oxidation Process of AlCuFe Quasicrystals by Using Artificial Neural Network Techniques Moh'd Sami S. Ashhab, Abdulla N. Oimat and Nabeel Abo Shaban. ................................................
55
Online Remote Recording and Monitoring of Sensor Data Using DTMF Technology Niladri Sekhar Tripathy, Sagarika Pal ................................................................................................
66
Detection of VX Simulants Using Piezoresistive Microcantilever Sensors Timothy Porter, Richard Venedam, Kevin Kyle and Gus Williams.....................................................
73
Study of a Modified Displacement Transducer of a Piston in a Power Cylinder S. C. Bera and Madan Bhowmick.......................................................................................................
81
Development of an Eletromiograph and Load Cell for the Silent Period Generation and Measurement in Myoelectric Signals of the Masseter and Temporal Muscles Alexandre Balbinot, Jeferson Figueró Feijó .......................................................................................
89
New Method for Fabrication of Co3O4 Thin Film Sensors: Structural, Morphological and Optoelectronic Properties Vikas Patil, Shailesh Pawar, Manik Chougule, Bharat Raut, Ramesh Mulik, Shashwati Sen ...........
100
Langmuir-Schäfer Film of Calix[4]pyrrole Exhibiting Sensing Properties with Gas Anesthetic Agent Sevoflurane Salvatore Petralia ...............................................................................................................................
115
Authors are encouraged to submit article in MS Word (doc) and Acrobat (pdf) formats by e-mail:
[email protected] Please visit journal’s webpage with preparation instructions: http://www.sensorsportal.com/HTML/DIGEST/Submition.htm International Frequency Sensor Association (IFSA).
Sensors & Transducers Journal, Vol. 128, Issue 5, May 2011, pp. 17-26
Sensors & Transducers ISSN 1726-5479 © 2011 by IFSA http://www.sensorsportal.com
Condition Monitoring of a Process Filter Applying Wireless Vibration Analysis 1
Pekka KOSKELA, 2 Marko PAAVOLA, 2Jukka KARJANLAHTI and 2Kauko LEIVISKÄ 1
Network Technologies, VTT, Kaitoväylä 1, P.O. Box 1100, Finland Tel.: +358 40 751 390 2, fax: +358 20 722 2320 2 Control Engineering Laboratory, University of Oulu P.O. Box 4300, 90014 University of Oulu, Finland Tel.: +358 8 553 1011 E-mail:
[email protected],
[email protected]
Received: 15 April 2011 /Accepted: 20 May 2011 /Published: 28 May 2011
Abstract: This paper presents a novel wireless vibration-based method for monitoring the degree of feed filter clogging. In process industry, these filters are applied to prevent impurities entering the process. During operation, the filters gradually become clogged, decreasing the feed flow and, in the worst case, preventing it. The cleaning of the filter should therefore be carried out predictively in order to avoid equipment damage and unnecessary process downtime. The degree of clogging is estimated by first calculating the time domain indices from low frequency accelerometer samples and then taking the median of the processed values. Nine different statistical quantities are compared based on the estimation accuracy and criteria for operating in resource-constrained environments with particular focus on energy efficiency. The initial results show that the method is able to detect the degree of clogging, and the approach may be applicable to filter clogging monitoring. Copyright © 2011 IFSA. Keywords: Filter clogging, Pipeline vibration, Predictive maintenance, Energy efficiency.
1. Introduction Many pumping systems contain a feed filter that prevents impurities entering the process. During operation, the filter gradually clogs up, reducing the feed water flow. This directly affects the performance of the pump and decreases its lifetime. When clogging continues for long enough, the pump cannot maintain the feed flow, which finally stops the whole process, causing significant downtime costs and, in some cases, creates serious damage to the system. It is thus important to replace or clean the clogged filter at the right time. 17
Sensors & Transducers Journal, Vol. 128, Issue 5, May 2011, pp. 17-26
The replacement or cleaning of the filter could be done according to a predetermined schedule or an actual condition of the filter. The scheduled approach is simple but, because it is not based on a real condition, the service may be too early or, worse, too late. In the case of predictive maintenance, the actual mechanical condition is monitored and the time between repairs can therefore be maximized and the cost of unnecessary or accidental downtime minimized. The clogging of the filter can be monitored by following either the change in pressure or in flow velocity. The corresponding measurements can be divided into contact and non-contact measurements. In contact methods, like differential pressure measurements, a probe is installed through the pipe and, in some cases, the installed probe may prevent a free flow inside the pipe. The non-contact methods, like ultrasonic, magnetometers and the Doppler effect, are simple to install and do not introduce any potential breaking point to the system. The disadvantage of these systems is that they are often quite costly. In this paper, we propose a cheap and energy-efficient, non-contact method based on vibration monitoring of the pipeline. We also introduce a wireless monitoring approach with battery-powered nodes, which have several advantages over wired ones. These include flexibility, ease of installation in existing processes and applicability to places in which wiring is not possible (e.g., mobile and rotating devices). As a trade-off for battery-operation, the system is power-scarce and the frequency of battery changes depends directly on the energy efficiency of the system. The system is therefore designed to be as energy-efficient as possible, and the use of the node resources such as CPU power, bandwidth and memory has to be minimized. No previous papers have been published on the application of vibration analysis to the filter clogging problem. Nonetheless, there are several other condition-monitoring applications that use vibration analysis. Korkua et al., and Xue and Wallace [1, 2] apply WSN to monitor the condition of a threephase induction motor. In both applications, the raw vibration data are transmitted to the base station for further analysis. Owen et al. [3] present a self-powered sensor node for vibration analysis. It harvests kinetic energy for transmitting vibration data because the local Fast Fourier Transform (FFT) needs a field-programmable gate array (FPGA) processor. Due to the raw data transmission, the above methods are not very power-efficient [4, 5]. Wan et al. [6] present an alternative approach for data processing. In their application for process equipment fault diagnosing, sample data were processed locally before transmission. To save energy, they only send sample values that exceed pre-set threshold values. Wright et al. [7] also propose a local processing approach. They monitor machine conditions by calculating the RMS of the acceleration signal locally. When the data are processed locally before transmission, the energy saving is considerable and the low bandwidth does not become a problem. For these reasons, an approach in which vibration analysis is done at the node is chosen here. The rest of the paper is structured as follows. Section 2 presents the design of the clogging monitoring system. Section 3 describes the test environment and performed test. Section 4 shows and discusses the results and, finally, Section 5 presents the conclusions.
2. The Design of the Wireless Monitoring System 2.1. Design Goals and Requirements The aim is to design a low-cost, wireless monitoring system that consists of battery-powered sensing nodes and is able to detect the clogging degree of the feed water filter. Due to the battery-powered nodes, the driving requirement is energy efficiency. Several studies have shown that radio operations 18
Sensors & Transducers Journal, Vol. 128, Issue 5, May 2011, pp. 17-26
consume most of the energy and it is therefore not possible to transmit large amounts of data [4, 5]. Instead, the measurement data have to be preprocessed at the sensor node and only analyzed information transmitted as indices. Due to the demand for energy efficiency, the CPU power and memory are also restricted, which leads to data having to be processed in a single pass and each data record only being viewed once. More precisely, the requirements for the selected approach include:
a single pass of data; asynchronous operation low memory consumption (< RAM 10 kB); low computational complexity (MCU 8 MHz); limited arithmetic operations (subtraction, multiplication and division); energy efficiency (< 6000 mA battery, lifetime over year); reliable detection of filter clogging degree; low bandwidth use (< 250 kbps); on-line operation.
The requirements motivate the selection of efficient vibration analysis methods (see next section). The energy efficiency and computational load as well as the applicability of clogging degree detection are also evaluated experimentally (see Section 4).
2.2. Preselection of Vibration Analysis Methods Vibration analysis methods for condition monitoring can be divided roughly into time and frequency domain techniques and their mixing; wavelet analysis. From these approaches, frequency-based and wavelet-based approaches have been excluded, as they need a large amount of memory and computational power, and some of them are also synchronous (see Section 2.1). Thus, only the time domain techniques are studied. Some methods use a higher order and complex derivatives [8] and some need a reference signal for synchronization, making them power hungry. Hence, they are also excluded from further study. Finally, nine simple methods are selected for further inspection. The selected methods are divided into two groups: the first group (a) consists of peak-to-peak, RMS, standard deviation and average absolute deviation, whose formulas are closely related. The second group (b) includes kurtosis, skewness, the crest factor, impulse factor and shape factor, which all indicate spikiness of the vibration signal. The average absolute deviation, standard deviation, kurtosis and skewness cannot be implemented on the node as such because they need an estimation of the sample mean and standard deviation and thus storage for large samples of data. To use these methods, the estimation is therefore calculated incrementally, as presented by Gama and Rodriques in [4]. In the incremental methods, the number of samples and the sum of the sample values and squares of the sample values are stored in memory, making it possible to compute the quantities recursively.
2.3. Wireless Vibration Measurement System According to the design goals (see Section 2.1) for wireless monitoring, Tmote devices are selected as battery-powered sensor nodes. As they are battery-powered, these devices have low resources, i.e., an MCU microcontroller unit Texas Instruments MSP430 8 MHz [9] with Chipcon’s CC2402 radio [10]. The MCU has 10 kB of Random Access Memory (RAM) and 48 kB of flash memory. The radio is IEEE 802.15.4-compliant, yielding a data rate of 250 kbps in the 2.4 GHz ISM (Industrial, Scientific and Medical) band. The original operating system, TinyOS [11], is replaced with ContikiOS [12, 13]. One reason for the change is that ContikiOS has energy estimation software and uses native C as a 19
Sensors & Transducers Journal, Vol. 128, Issue 5, May 2011, pp. 17-26
programming language. The Tmote devices have a USB interface that can be connected to a PC. This connection is used for test control and monitoring purposes, such as comprehensive data logging. The accelerometer sensor is integrated into the Tmote I2C bus into the UART port, which is capable of a 125 Hz sampling rate. To take the available sampling rate into account, a low frequency MEMS acceleration sensor is selected. The accurate frequency range of the sensor is 0-40 Hz. In the comparison of the energy efficiency of different vibration analysis algorithms, the on-line energy estimation software of ContikiOS is used.
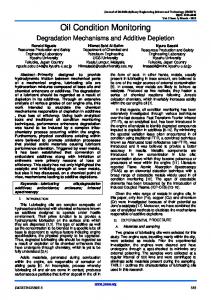
3. Test Environment and Campaign 3.1. Steam Boiler Environment In the test environment, a boiler produces steam for a chemical pulp process (see Fig. 1). A pump feeds water from a tank to the boiler, and the boiler heats the water. The pump operates periodically based on the boiler water level measurement. Below the lower limit, the pump comes into operation and fills the boiler to the upper limit. Before the feed water flows to the pump, a filter prevents the impurities from entering the process. The impurities gradually clog the filter, which needs to be maintained from time to time, based on practical experience. It has been observed that the absence of sufficient water in the supply pump will cause pressure pulsations, resulting in supply system vibrations. The overall vibration level of the pipeline increases when the flow of water decreases due to filter clogging. To detect the degree of clogging, an accelerometer is installed in the pipeline (Fig. 1).
X Y Z
Fig. 1. The steam boiler for the chemical pulp process and installation of the accelerometer.
20
Sensors & Transducers Journal, Vol. 128, Issue 5, May 2011, pp. 17-26
3.2. Test Campaign As the clogging of the pump filter is a slow phenomenon that may take up to a year, it is simulated by restricting the feed water flow using a hand-operated choke valve. The valve is located in the pipeline before the pump filter and it is controlled by a wheel (see Fig. 1). Full flow is achieved when the wheel is ten turns open, which is also the maximum limit for the valve. The lowest flow rate used is two turns open, which corresponds to severe clogging of the filter and consequently a critical fault condition. Steam is not produced during the tests to avoid damaging the equipment. The counter pressure of the steam prevailing in the boiler during normal operation is simulated using another choke valve. Initial tests were carried out to find the location and direction that were most sensitive to vibration. The greatest amplitude of the signal was detected in the centre of the vertical pipe in the direction of the z-axis (see Fig. 1). During the initial test, it was also noted that the pump had to be operated for a while (typically four 45 s test runs) in order to stabilize the test environment. The actual test campaign includes six sets of six valve positions: 10, 8, 6, 4, 3 and 2 turns open in random order. For each measurement, the duration of the pumping is 45 seconds and the time between the measurements varies between 3 and 4 minutes. The typical vibration measurement of a pumping cycle is presented in Fig. 2. Big vibrations are induced into the pipeline when the pump comes into use (beginning of the plot). Afterwards, the vibration becomes more regular. During the pre-analysis, it was noted that the measurement sequences at the end of the cycle were most applicable to detecting filter clogging with the selected methods. To improve energy efficiency, different indices with several sample sizes were compared to find the smallest required amount of data.
124
124
200
248
248
Samples
620
620 1240
100
1240
0 -100
45 seconds
Fig. 2. The location of samples applied in the analysis of a typical measured pumping cycle.
4. Results and Discussion 4.1. Clogging Detection The selected simple vibration analysis methods (see Section 2.2) are compared based on their ability to identify the degree of clogging, energy consumption and computational efficiency. In the preliminary analysis, it was noted that clogging detection was improved by preprocessing the data by moving the average in the sliding window. Window size nw = 2 is applied. The different indices are then calculated for the samples taken from the test runs, as presented in Fig. 2. The groups ‘ten turns open’ and ‘eight turns open’ as well as ‘six turns open’ and ‘four turns open’ cannot be statistically separated from each other and they are therefore combined. To obtain the same 21
Sensors & Transducers Journal, Vol. 128, Issue 5, May 2011, pp. 17-26
number of indices for each group, the statistically separable groups ‘three turns open’ and ‘two turns open’ are also joined. As a result, three groups, each describing a different degree of clogging, were formed (see Fig. 2). The obtained groups at different clogging degrees are analyzed, applying the box plots (Fig. 3). In the plots, the tops and bottoms of each box are the 25th and 75th percentiles of the samples, respectively. The line in the middle of the box is the sample median. Notches display the variability of the median between samples: the box plots whose notches do not overlap have different medians at the 95 % confidence level. The whiskers, i.e., the lines extending above and below each box, represent the extreme values of the sample. Outliers are marked with red crosses beyond the whisker length. The results of two methods capable of detecting clogging (peak-to-peak and RMS) as well as one that is incapable (skewness) are presented in Fig. 3.
Peak-to-peak, n= 124
Peak-to-peak, n= 620
0.4
1
0.8
I/Imax
I/Imax
I/Imax
0.6
0.6
0.2 1
2 3 Clogging degree
1
0.92 0.9 0.88 0.86 0.84 0.82
0.92
Skewness, n= 124
0.9 0.88 0.86 0.84
1
2 3 Clogging degree
2 3 Clogging degree RMS, n= 1240
I/Imax
I/Imax
0.8 1
2 3 Clogging degree RMS, n= 620
RMS, n= 124
0.9
0.8 0.6
1
1 I/Imax
Peak-to-peak, n= 1240
1
0.8
2 3 Clogging degree
1
Skewness, n= 620
2 3 Clogging degree
Skewness, n= 1240
0.4
0
0.5
0.2
I/Imax
I/Imax
I/Imax
0.1
0
-0.5
-0.2
-0.1 1
2 3 Clogging degree
0
1
2 3 Clogging degree
1
2 3 Clogging degree
Fig. 3. Box plots of clogging detection with index values calculated from vibration data. All the data values except the outliers are between the present limits of the whiskers and the box of the 25th and 75th percentile. The red line in the box is the median. Each column contains the same number of observations. Clogging degrees 1, 2 and 3 describe the states ‘no clogging’, ‘initializing clogging’ and ‘severe clogging’, respectively. I/Imax is defined as the ratio of an index value and the maximum index value obtained with the applied statistical quantity.
Only one of the applied indices, peak-to-peak, with a sample size ns = 1240, seems to be able to separate all three degrees of clogging, as the medians of the groups are different at the 95 % confidence level. As the method is able to detect the initializing clogging it can be applied to the predictive maintenance of the pump filter. The actual application could track the median of, for example, the last fifteen indices. 22
Sensors & Transducers Journal, Vol. 128, Issue 5, May 2011, pp. 17-26
A group of methods, RMS, standard deviation and kurtosis could be applied to differentiate the severe degree of clogging. As degrees 1 and 2 are statistically inseparable with these methods, however, early detection of clogging is not possible and the methods are therefore inapplicable in this case. Finally, the rest of the tested methods (average absolute deviation, skewness, crest factor, impulse factor and shape factor) could not be applied to tell the difference between clogging degrees.
4.2. Energy Consumption and Computational Load The energy use and computational efficiency of all the applied methods are compared next. The results of the comparison are presented in Fig. 4. The CPU energy consumption of the computationally less intensive methods (peak-to-peak, RMS, recursive standard deviation) is about one third of that of the methods that demand more processing power (recursive kurtosis, recursive skewness, shape factor, impulse factor). The computational load of recursive absolute deviation and the crest factor lies between these extremes. When the number of processed samples increases, the power consumption increases linearly. For example, calculating the kurtosis for a sample size of n = 1240 samples took 13.9 mJ and for n = 620 took 7.0 mJ. Computation time [ms]
1000 800
CPU energy consumption [mJ]
16 12
600 8 400 200 0
4 0
Fig. 4. Energy and computational efficiency of different vibration analysis methods (n = 1240).
A more detailed study of the distribution of power consumption between different functionalities in the sensor node was carried out (Fig. 5). In the study, one peak-to-peak value is calculated from a sample of n = 1240 collected during a 10-second duty cycle and transmitted to the gateway node. As presented in the figure, the main power consumption takes place in the MAC -operations (transmitting and listening), which are independent of the applied analysis method. Instead, their energy use could be reduced by improving the MAC protocol. It can also be speculated that if data were sent as raw data (n = 1240) without processing, the energy consumption would be at least 3000 mJ. In this case, the energy use of the other functionalities would be insignificant. To evaluate the effect of the applied efficient waveform indices on energy consumption, the duty cycles of the most and least computationally intensive methods (recursive kurtosis and peak-to-peak) were also compared. The node consumes 51.6 mJ of energy during a duty cycle with recursive kurtosis and 42.3 mJ with peak-to-peak. If the energy consumption in the idle state is also taken into account, the lifetime of the node varies, as presented in Fig. 6. 23
Sensors & Transducers Journal, Vol. 128, Issue 5, May 2011, pp. 17-26
Energy consumption [mJ]
Peak-to-peak Data transmitting
50
MAC -operations
40
Computing
30
CPU Idle
20
Acceleration sensor
10 Total
0
Fig. 5. Energy consumption of one index value calculation and transmission in a 10-second duty cycle with a peak-to-peak algorithm.
Peak-to-peak
Improvement
6
0,3
5
0,25
4
0,2
3
0,15
2
0,1
1
0,05
0 0
500
1000
1500
Improvement [year]
Lifetime [ year]
Kurtosis
0 2000
Measurements / day
Fig. 6. The lifetime of the node (blue and purple) and the improvement provided by the peak-to-peak method over kurtosis (green) against the duty cycle (measurements/day).
Fig. 6 indicates that the advantage gained by applying the peak-to-peak value follows a non-linear curve. With very low duty cycles, the energy consumption of the applied method becomes insignificant. Instead, the energy consumption in the idle state is important in this case. The lifetime improvement due to more efficient computation then increases until it reaches a maximum of approximately 170 measurements/day. After this point, the higher duty cycles rapidly reduce the lifetime of the node and the advantage gained from efficient computation. For example, if clogging detection is carried out twice in an hour applying the peak-to-peak value, the lifetime of the node will be about four years and the improvement compared with kurtosis two months (4 %). If, on the other hand, the detection is carried out every five minutes, the lifetime will be about 1.9 years and the advantage gained just under three months (12 %). The benefit of employing computationally efficient algorithms therefore also depends on the application’s duty cycle requirement in general. 24
Sensors & Transducers Journal, Vol. 128, Issue 5, May 2011, pp. 17-26
As mentioned above, the power consumption of the measurement system could be reduced by employing an energy efficient MAC protocol [5]. Assuming the energy consumption of the MAC operations is negligible, the biggest power drain during the duty cycle would be from the acceleration sensor, followed by computing and CPU idle (see Fig. 7). Therefore, to optimize the lifetime of the node further, a more energy-efficient acceleration sensor and CPU idle state power management could be applied. Also a smaller sample size and sampling frequency could be used, depending on the application requirements. Power cosumption of sensor node at ten seconds duty cycle (Method peak-to-peak; excluding MAC -operations)
Data transmitting; 17 % Acceleration sensor; 37 %
Computing; 25 %
CPU idle; 21 %
Fig. 7. Power consumption of the node excluding receiving and listening with the peak-to-peak method.
5. Conclusions In this paper, a wireless monitoring approach for feed filter clogging was proposed. The degree of filter clogging is monitored by calculating the time domain indices from low-frequency (40 Hz) accelerometer samples estimating their median. Nine simple vibration analysis methods were selected based on their applicability to resource-constrained wireless sensor nodes. The small memory of the device was the main restricting factor of the method evaluation phase. The selected indices were compared based on their ability to identify the degree of clogging, energy efficiency and computational load. Based on the results, four of the methods studied (recursive kurtosis, recursive standard deviation, peak-to-peak and RMS) were able to detect clogging, but of these only peak-to-peak was able to detect all the three clogging degrees. The performance was also best with peak-to-peak when energy efficiency and computation load were taken into account. A closer investigation into energy consumption revealed that the benefit of employing computationally efficient algorithms depends nonlinearly on the application’s duty cycle. With very low duty cycles, the energy consumption of the idle state dominates and the energy consumption of algorithms is insignificant. When the duty cycle starts to increase, the computation efficiency of the algorithm also has a role to reduce energy consumption. When the duty cycle increasing further, the radio transmission takes on a major role and dismisses the advantages of the algorithm. In this case study, the clogging was simulated using manually operated valves, and the slow sampling rate of the node restricted the selection of a higher frequency acceleration sensor. So before practical implementations more detailed tests could also be carried out with lower and higher frequency accelerometers in a real environment. 25
Sensors & Transducers Journal, Vol. 128, Issue 5, May 2011, pp. 17-26
In the process industry, feed filters are applied to prevent impurities from entering the process. During the operation, the filters gradually become clogged and need to be maintained. When applying predictive maintenance methods, such as the one proposed in this paper, the time between repairs can be maximized and the downtime costs minimized. The wireless sensor technology reduces installation costs and enables easy installation.
Acknowledgements The authors wish to thank Mika Ruusunen for his help and professional advice during study.
References [1]. S. Korkua, H. Jain, W.-J. Lee and C. Kwan, Wireless health monitoring system for vibration detection of induction motors, in Proceedings of the ‘2010 IEEE Industrial and Commercial Power Systems Technical Conference (I&CPS)’, Tallahassee, FL, USA, 9-13 May 2010, pp. 1-6. [2]. Xue, V. Sundarajan and W. P. Brithinee, The application of wireless sensor networks for condition monitoring in three-phase induction motor, in Proceedings of the ‘Electrical Insulation Conference and Electrical Manufacturing Expo, 2007’, Nashville, TN, USA, 22-24 October 2007, pp. 445-448. [3]. T. H. Owen, S. Kestermann, R. Torah and S. P. Beeby, Self Powered Wireless Sensors for Condition Monitoring Applications, Sensor Review, Vol. 29, Issue 1, 2009, pp. 38-43. [4]. J. Gama and M. M. Gaber, Learning from data streams, Springer, 2007. [5]. P. Koskela, M. Valta and T. Frantti, Energy efficient MAC for Wireless Sensor Networks, Sensors & Transducers, Vol. 121, Issue 10, 2010, pp. 133-143. [6]. Y. Wan, L. Li, J. He, X. Zhang and Q. Wang, Anshan: wireless sensor networks for equipment fault diagnosis in the process industry’, in Proceedings of the ‘5th Annual IEEE Communications Society Conference on Sensor, Mesh and Ad Hoc Communications and Networks, Secon’08’, San Fransisco, CA, USA, 16-20 June 2008, pp. 314-322. [7]. P. Wright, D. Dornfeld and N. Ota, Condition monitoring in end-milling using wireless sensor networks (WSNs), Transactions of North American Manufacturing Research Institution of SME, Vol. 36, 2008, pp. 177-183. [8]. S. Lahdelma, E. Juuso, Advanced Signal Processing and Fault Diagnosis in Condition Monitoring, Insight, Vol. 49, Issue 12, 2007, pp. 719-725. [9]. Texas instrument’s ultra low power MSP430-series microcontroller (http://www.ti.com/msp430). [10].Chipcon Corporation. IEEE 802.15.4 compliant low-cost transceiver (cc2420) (http://www.chipcon.com/files/CC2420 Data Sheet 1 3.pdf). [11].TinyOS (http://www.tinyos.net/). [12].ContikiOS (http://www.sics.se/contiki/). [13].B. G. A. Dunkels and T. Voigt, Contiki – a lightweight and flexible operating system for tiny networked sensors, in Proceedings of the 1st IEEE Workshop on Embedded Networked Sensors, 2004. ___________________
2011 Copyright ©, International Frequency Sensor Association (IFSA). All rights reserved. (http://www.sensorsportal.com)
26
Sensors & Transducers Journal
Guide for Contributors Aims and Scope Sensors & Transducers Journal (ISSN 1726-5479) provides an advanced forum for the science and technology of physical, chemical sensors and biosensors. It publishes state-of-the-art reviews, regular research and application specific papers, short notes, letters to Editor and sensors related books reviews as well as academic, practical and commercial information of interest to its readership. Because of it is a peer reviewed international journal, papers rapidly published in Sensors & Transducers Journal will receive a very high publicity. The journal is published monthly as twelve issues per year by International Frequency Sensor Association (IFSA). In additional, some special sponsored and conference issues published annually. Sensors & Transducers Journal is indexed and abstracted very quickly by Chemical Abstracts, IndexCopernicus Journals Master List, Open J-Gate, Google Scholar, etc. Since 2011 the journal is covered and indexed (including a Scopus, Embase, Engineering Village and Reaxys) in Elsevier products.
Topics Covered Contributions are invited on all aspects of research, development and application of the science and technology of sensors, transducers and sensor instrumentations. Topics include, but are not restricted to:
Physical, chemical and biosensors; Digital, frequency, period, duty-cycle, time interval, PWM, pulse number output sensors and transducers; Theory, principles, effects, design, standardization and modeling; Smart sensors and systems; Sensor instrumentation; Virtual instruments; Sensors interfaces, buses and networks; Signal processing; Frequency (period, duty-cycle)-to-digital converters, ADC; Technologies and materials; Nanosensors; Microsystems; Applications.
Submission of papers Articles should be written in English. Authors are invited to submit by e-mail
[email protected] 8-14 pages article (including abstract, illustrations (color or grayscale), photos and references) in both: MS Word (doc) and Acrobat (pdf) formats. Detailed preparation instructions, paper example and template of manuscript are available from the journal’s webpage: http://www.sensorsportal.com/HTML/DIGEST/Submition.htm Authors must follow the instructions strictly when submitting their manuscripts.
Advertising Information Advertising orders and enquires may be sent to
[email protected] Please download also our media kit: http://www.sensorsportal.com/DOWNLOADS/Media_Kit_2011.pdf