Curvature Feature Distribution based Classification of Indian Scripts from Document Images †
∗
Ritu Garg
Gurav Sharma
Multimedia Laboratory Indian Institute of Technology Delhi
[email protected]
Multimedia Laboratory Indian Institute of Technology Delhi
[email protected]
ABSTRACT We present a framework for classification of text document images based on their script. We deal with the domain of Indian scripts which has high inter script similarities. Indian scripts have characteristic curvature distributions which help in visual discrimination of scripts. We use edge direction based features to capture the distribution of curvature. We also use a recently proposed feature selection algorithm to obtain the most discriminating curvature features. We form hierarchy (automatically) based on statistical distances between the script models. Hierarchy allows us to group similar scripts at one level and then focus on the classification between the similar scripts at the next level leading to improvement in accuracy. We show experiments and results on a large set of about 3400 images.
Categories and Subject Descriptors I.7.0 [Computing Methodologies]: Document And Text Processing—General ; 1.5.4 [Computing Methodologies]: Pattern Recognition—Application
General Terms Text Document Image Classification System
Keywords Indic script image identification, statistical modeling
1.
INTRODUCTION
In this paper we present a framework to address the problem of script classification from document images. We create ∗GS was a Masters student at IIT Delhi. †RG is Project Scientist at Multimedia Lab, IIT Delhi. ‡SC is Schlumberger Chair Professor in Electrical Engg. Department at IIT Delhi.
Permission to make digital or hard copies of all or part of this work for personal or classroom use is granted without fee provided that copies are not made or distributed for profit or commercial advantage and that copies bear this notice and the full citation on the first page. To copy otherwise, to republish, to post on servers or to redistribute to lists, requires prior specific permission and/or a fee. Copyright 200X ACM X-XXXXX-XX-X/XX/XX ...$10.00.
Santanu Chaudhury
‡
Multimedia Laboratory Indian Institute of Technology Delhi
[email protected]
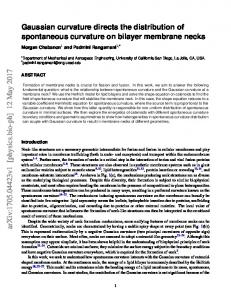
statistical models of each script class based on a set of training images. The features used are motivated by the requirement of capturing the curvature distributions of the scripts. A recently proposed feature selection algorithm gives us the most discriminating features and also helps in reducing the dimension of the feature space. Our algorithm is fast in practice with good accuracy. We also incorporate hierarchy in the model based on statistical distances between the models for scripts. This leads to the grouping of similar scripts (the similarity here is in terms of the statistical models, which we find to be visually acceptable in experiments) at one level and then allows us to focus on discriminating between them in the next level. Since the training for discrimination is more focused, at the lower level, on smaller number of scripts instead of all the scripts, it leads to better performance. Automatic script identification is an important step towards many high level tasks. It can be used for many tasks e.g. for managing large document image collections by sorting based on the scripts, as a preprocessing step in character recognition systems, for searching and retrieval of document image databases etc. The domain of Indian scripts has its own distinct characteristics. Indian scripts can be visually discriminated by observing the curliness of the script. While some of the scripts have Shiro-rekha (horizontal line at the top of the word) along with many dominant vertical strokes e.g. Fig. 1(a), some have predominantly curved symbols with very less straight lines e.g. Fig. 1(b). We also consider English as one of the script class, which has dominant straight lines with certain amount of curves making the overall curvature distribution different. We use this observation as a motivation to work with edge direction based features to capture the distribution of curvature in the scripts. The same argument extends to: not all curvature directions will be equally discriminating for classification. To obtain the most discriminating curvature directions, we employ a recently proposed information theoretic feature selection algorithm [10]. This feature selection algorithm not only exploits the dependence (captured using information theoretic mutual information based formulation) of individual feature values on the class label but also the dependence of observing multiple features together with the class labels. The paper is organized as follows. First we give a brief survey of the related art in Sec. 2. We then proceed to discuss our method in detail in the next Sec. 3, describing each part; features used in Sec. 3.1, feature selection algorithm used in Sec. 3.2, statistical model used for classification in Sec. 3.3 and the hierarchical framework in Sec. 3.4. We then show the experiments we conducted to validate our framework in
Figure 1: The 8 scripts considered for classification
Sec. 4. Finally we conclude the paper with a discussion in Sec. 5.
2.
RELATED ART
Script identification has been a topic of regular research. [8] proposed a method for classification among Asian (Han) and Latin (European and non European both) scripts. Han vs. Latin classification was done using the vertical position distributions of upward concavities. Han language classification was based on optical density estimation while European language classification relied on most frequently occurring word shape characteristic. [4] used the frequently occurring character shapes in each script. All textual symbols (character shapes) were clustered to form representative sets for each language. Classification of a new image was done by extracting textual symbols and comparing them to the database symbols to find best matching script. [11] proposed a method using Hough transform and density profiles. [9] proposed a texture based classification scheme using Gabor filter for generating the features. They used heavy preprocessing to make the script texture consistent. [2] used features from oriented local energies to perform script classification. Indian script recognition has been attempted by [6, 3, 5]. [3] extracted Gabor features from connected components. They used 12 Gabor feature values to classify 4 Indian scripts Devanagari, English, Telugu and Malayalam. [6] used a tree based classifier to classify 12 Indian scripts. The features were derived from horizontal profiles, topological and stroke based computations etc. [5] proposed a classification scheme using a hierarchical architecture. At the first stage log Gabor filter banks are used to classify script into subgroups. At the second stage they used script specific features to perform the final classification. The features used are derived from oriented local energy responses: relative response at adjacent orientation channels, ratio of energies for non-adjacent orientations along with horizontal profile for discriminating between specific scripts. Their method works at global image level and hence does not require any segmentation based preprocessing. They show good results on a collection of 10 Indian scripts.
3.
PROPOSED METHOD
We propose a probabilistic model where each class is represented as a distribution over edge direction features. The distributions used to model classes are Gaussian mixture models learned from the training data using Expectation Maximization (EM) algorithm. The feature used are based on the edge direction distributions in the full text block image. The feature dimension is reduced by the use of a recently proposed feature selection algorithm which exploits the dependences of the class labels on individual features and co-occurrences of the features. We incorporate hierarchy in the model which discriminates between groups of similar documents from other such groups at higher level and then specializes local classifier on similar classes at lower levels to improve classification. The method works on full text block in the image and does not require any segmentation at word or character level etc. We now describe each component of our method in the following sections.
3.1 Features The main difference that comes out on visual inspection of the different scripts in question is that of curvature in the scripts. While some of the scripts have appreciable horizontal and vertical straight lines, Fig. 1(a), others have a very curly construction with almost no straight lines, Fig. 1(b). This observation motivates the use of features which capture the statistical distribution of curvature in the script. Towards this goal we use Edge Direction Histogram (EDH) feature on a global image patch containing the script to obtain a characteristic signature of the script. Block based EDH features (i.e. EDH computed on the image divided into logical blocks) have traditionally been used in natural image based tasks e.g. [1]. The reasoning being that the relative distribution of edges in natural images is a strong cue for various tasks. However, in the present task we are not interested in relative edge distributions but want a global characterization of the curvature distribution. The way we obtain the edge direction features is as follows. We first scale the image, to save computation, so that its maximum dimension is at most 640 pixels. We convolve the document image with horizontal and vertical Sobel masks. We threshold these edge responses to obtain strong edges. We then compute the direction of the edge at threshold surviving pixel positions. Finally, we compute an edge
histograms with b bins to obtain b-dimensional feature vector for the current document. The obtained EDH features show good intra class similarity and inter class difference for the multi script document image dataset with significant amount of variation in fonts and scales of the text (Fig. 3.1).
3.2 Feature Selection We perform feature selection from the b-dimensional EDH vector obtained from the text image. The reason for feature selection are two fold. First is surely to reduce model and time complexity. Second is the observation that not all fine directions in the edge distribution will be equally discriminating. Some of the scripts can be straight away distinguished by the presence of horizontal and vertical straight lines (e.g. Hindi, Gurumukhi etc.). So, the feature selection process should give us the most discriminating features which would reduce complexity but maintain high classification rate. To perform feature selection we use a recently proposed method [10] for low complexity feature selection. [10] use the information theoretic optimality criteria of maximizing the mutual information given by, XZ pX,Y (x, i) I(X; Y ) = pX,Y (x, i) log dx (1) p X (x)pY (i) χ i between the random process X generating features x and the random process Y generating labels i. They decompose the mutual information (MI) into two components, I(X; Y ) = M (X; Y ) + C(X; Y ),
(2)
marginal mutual information (MMI) given by M (X; Y ) =
b X
I(Xk ; Y )
(3)
k=1
and the conjunctive component of mutual information (CCMI) given by C(X; Y ) =
b X
[I(Xk ; X1,k−1 , Y ) − I(Xk ; X1,k−1 )].
(4)
We use the approximate infomax algorithm, given in [10], of order 1 (i.e. up to only pairwise dependences) for performing feature selection among the b EDH features generated per image. We use the algorithm with a set of labeled images of each script class to learn N discriminant features from all the b original features. This provides us with features which are, by themselves and by virtue of their inter dependences, highly discriminant for the classification task.
3.3 Statistical Model We use Gaussian Mixture Model (GMM) to model each of the script classes. Since the feature selection process identifies highly discriminating features for the classification task, GMM model adequately captures the discriminatory information. It allows for a light weight parametric classifier, with small memory footprint (only means and variance covariance matrices need to be stored per class) and fast computation time (matrix multiplications and exponentiation). Each of the script class is taken to be a k component GMM i.e. p(x|Ci )
=
k X
wi
i=1
1 (2π)d/2 |Σi |1/2
1 exp − (x − µi )T Σ−1 i (x − µi ) 2
ff
(5)
where, µi and Σi are the means and variance-covariance matrices for each component of the GMM (collectively captured by class variable Ci ), wi are the weights of each Gaussian component and d is the (residual) dimension of the feature vector after feature selection. Since each class is a GMM model, we get n GMMs {pj |j = 1 . . . n} for all the n script classes under consideration. We learn the parameter of the GMMs off-line from a set of training images using the Expectation Maximization (EM) algorithm independently for each class. Finally, a new test image is classified to the class Ci that maximizes the probability p(x|Ci ) i.e. C ∗ = arg max p(x|Ci ) Ci
(6)
k=2
where Xi,j is set of features from index i through j and Xk is the kth feature. The first term measures the discriminant information conveyed by each feature and the second terms measures discriminant information due to dependence of features within themselves. They propose that this discrimination due to dependence between features may be exploited for feature selection. They derive the concept of decomposability order of a feature set and prove that the complexity of feature selection depends on the decomposability order and not on the cardinality of the feature set. Finally, they provide indirect validation to the hypothesis that usually occurring feature sets have low decomposability order. They show experimentally that the error of classifier decreases with increasing the decomposability order assumed while selecting features, but it levels off at relatively low values. One important conclusion with common feature sets was that they were all 1-decomposable, which essentially means that pairwise dependence of features is important in discrimination but beyond that multiple dependences among features increases complexity and results in small gains.
where, p(x|Ci ) is given by Eqn. (5).
3.4 Incorporating Hierarchy The set of Indian scripts have high inter class similarities in some of the scripts e.g. Hindi, Gujrati, Gurumukhi (North Indian languages) etc. have strong vertical and horizontal structures while Telugu, Kannada, Malayalam (South Indian languages) etc. have strong circular structures. This leads to confusion between these pairs of classes. This motivates the use of a hierarchical classifier which at a higher level discriminates between two sets which have relative high intra group and relatively low inter group similarities. Then at a lower level it focuses on the harder task of discriminating between similar scripts. Such hierarchy is thus expected to improve performance. We learn the hierarchy automatically from the training databases. Since, each script class in our framework is modeled as a GMM model, the distance between the models is used to infer script similarity. Kullback Leibler divergence has been shown to work well for image retrieval [7]. We work with Kullback Leibler (KL) divergence between two
Figure 2: Edge direction histogram features for a typical example image from each class
probability distributions given by Z p(x) dx. KL(p||q) = p(x) log q(x)
(7)
Since KL divergence between p and q is not the same as that between q and p, we use the symmetric version of KL given by, ˛ ˛Z Z 1˛ p(x) q(x) ˛˛ SKL(p, q) = ˛˛ p(x) log dx + q(x) log dx˛ . 2 q(x) p(x) (8) An analytic distance measure between GMMs was proposed by [7] which was fast but less accurate than SKL. Speed is important for retrieval tasks, however for current problem training is to be done off-line and hence we choose the best method. Since the SKL can not be computed in closed form for GMMs we resort to Monte-Carlo approximation and obtain SKLMC as [7],
SKLM C
˛ ˛X X ˛ log p(x) − log q(x) = ˛ ˛ x←p x←p ˛ ˛ X X ˛ log p(x)˛ log q(x) − + ˛ 1 2N
x←q
(9)
x←q
where, x ← p means x sampled from the distribution p. The SKLMC computed is used as a distance measure to obtain the hierarchy of the script classes. Upon obtaining the hierarchy we use all the accumulated training data of the different classes in children nodes to retrain a classifier at the node. We first perform feature selection based on the accumulated training data and then train GMM models for each child node. This specializes the selected features and the associated classifier for discriminating the two children nodes with whom the intra node similarity is high and inter node similarity is low.
4.
EXPERIMENTS
We tested our framework on a dataset of 8 Indian scripts Hindi, Gujrati, Gurumukhi, Telugu, Tamil, Malayalam, Kannada along with English (Fig. 1). The dataset had 400 to 450 images per class with around 3400 images in total. All the images are scanned images from different books having variations in fonts and scales. We perform multiple iterations of testing and training and report average of those. For each iteration we choose 100 images per class randomly for testing and use remaining for training. We report the average results of 10 such iterations. The figures given for illustration are for some representative iterations. The number of features obtained from feature selection was 12 and the number of components used in the GMM models was 4. Fig. 4 shows a typical confusion matrix for non hierarchical classifier case. The confusion between Hindi and Gurumukhi on one hand and Kannada, Malayalam, Telugu on the other can be seen clearly. The distance matrix (Fig. 4(a)) between classes obtained using SKLMC (Eqn. 9) and the Multidimensional Scaling based visualization (Fig. 4(b)) both show that the similarity between the models correctly justifies this confusion. Also the distances between models can be seen to be consistent with visual observation, wherein Hindi, Gurumukhi etc. having strong vertical and horizontal straight lines and Kannada, Telugu etc. being more circular are expected to be less within group and more across groups distant to each other. This block structure is clearly visible in the distance matrix. The MDS visualization also shows this trend. Fig. 4 shows the hierarchy obtained using the distance matrix obtained with SKMLS distance between script classes. We use this distance matrix to construct the hierarchical full tree classifier. However, the best accuracy (300 training images) of the full tree based classifier drops a little to 95.8 % when compared to the corresponding non hierarchical accuracy of 96.6 %. This may be explained as follows. As we go up the hierarchy the dissimilarity within group at each node increases and the model is not able to capture the distribution of multiple classes, which are not strongly similar,
taken together. This leads to the poor performance at discrimination at higher levels in the full tree. To counter this problem we stop building the hierarchy at a level where the distance increases above a threshold. This leads to multiple nodes classification (instead of binary) at the topmost level and the classifier takes the form of a forest of trees. When we use the incomplete hierarchy based forest of trees classifier the performance increases to 97.4 % when compared to the corresponding non hierarchical case with 96.6 % as expected. Tab. 2 summarizes the results for the non hierarchical, full hierarchy based and incomplete hierarchy/forest of trees based classifiers. The performance of the classifiers is shown for different number of training images. All the three classifiers improve with increasing the number of training images pobably due to the better fit of GMMs on the classes. The full tree based classifier is inferior to the non hierarchical classifier whereas the performance of the forest of trees based classifier is higher for the same number of training images. Fig. 1 gives the confusion matrix (column label is actual class and row label is assigned class) for the forest of trees based classifier when 100 images per class were used for testing and rest were used for training. The performance accross all the languages is uniformly good with the highest amount of confusion between Kannada and Telugu (2.6 % and 3.7 % respectively). The lowest accuracy for languages is of Kannada (94.4 %) while the highest is of English (99.8 %).
Table 2: Results obtained on the 8 class script dataset using various methods for different number of training images Method Non hierarchical Classifier
Full Tree Calssifier
Forest of trees Classifier
# train. img. 100 200 300 100 200 300 100 200 300
Accuracy 95.2 % 95.8 % 96.6 % 94.3 % 95.1 % 95.8 % 95.8 % 96.4 % 97.6 %
in [5] is a k-NN classifier, which in itself is expected to be computationally expensive, as it computes distances with every database vector, compared to our method which is essentially a few matrix multiplications and exponentiations for computing the GMM likelihoods.
Figure 4: A typical dendrogram showing the hierarchy obtained on the script clases
5. DISCUSSION AND CONCLUSION Figure 3: A typical confusion matrix from the linear classifier (best viewed in color) The method is fast in practice requiring about 240 ms for 640 × 480 images on MATLAB on a 2.26Ghz processor. However, the majority of the time is spent in extracting the features (about 230 ms) and only relatively small amount of time is spent in evaluating the classifier (about 10 ms). So, the time gain with the hierarchical classifier is not appreciable (about 4 to 5 ms). When compared to the method given in [5] our method is expected to be much faster for the following reasons. The majority of the time taken by our method while testing is in feature extraction which is essentially convolution with horizontal and vertical Sobel masks. The method in [5] uses log Gabor filters at eight orientations, leading to 4 times more convolution operations (possibly with larger mask than 3×3 Sobel). Moreover, the method achieving best performance
We proposed a method for classification of document images based on their scripts for Indian languages. The method works at a text block level and does not require any word or character level segmentation. The features used came out of the observation that Indian scripts can be efficiently discriminated using the distribution of curvature in the scripts. We further use a feature selection method to mine out the most discriminating curvature features for the task. Based on the strong similarities between some scripts we construct a hierarchical forest of tree classifier. The hierarchical classifier improves performance by discriminating between groups of similar languages at higher levels and then focusing on discriminating similar languages within the groups. The results obtained on a large dataset of 8 Indian scripts validate our framework.
6. ACKNOWLEDGMENTS The multilingual document image database was taken from a ongoing project entitled “Development of Robust Docu-
Table 1: Confusion matrix (column label is actual class and row label is assigned class) for the forest of tree based classifier (average of 10 runs)
Hindi Gurumukhi Gujrati Kannada Telugu Malayalam Tamil English
Hindi 99.6 0.4 0 0 0 0 0 0
Gurum. 2.9 96.6 0.2 0 0 0 0.3 0
Gujrati 1.0 0.1 98.9 0 0 0 0 0
Kannada 0 0 0 94.4 3.7 1.8 0 0.1
Telugu 0 0 0 2.6 96.3 1.1 0 0
Malaya. 0 0 0 1.1 1.5 97.3 0.1 0
Tamil 0.3 1.0 0 0.1 0.2 0 97.7 0.7
English 0.1 0 0 0 0 0 0.1 99.8
Figure 5: (a) The Symmetric Kullback Leibler (SKL) distance matrix between the models for each script. (b) The distances between models visualized with Multidimensional Scaling (MDS) in 2D.
ment Analysis and Recognition System for Printed Indian Scripts” funded by the grant RP01894 from Ministry of Communication and Information Technology, Govt. Of India.
7.
REFERENCES
[1] A. V. Anil, A. Jain, and H. J. Zhang. On image classification: City images vs. landscapes. Pattern Recognition, 31:1921–1935, 1998. [2] W. Chan and G. G. Coghill. Text analysis using local energy. Pattern Recognition, 34(12):2523–2532, 2001. [3] S. Chaudhury and R. Seth. Trainable script identification strategies for Indian languages. ICDAR, pages 657–660, 1999. [4] J. Hochberg, L. Kerns, P. Kelly, and T. Thomas. Automatic script identification from images using cluster-based templates. TPAMI, 19(2):176–181, 1997. [5] G. D. Joshi, S. Garg, and J. Sivaswamy. Script identification from indian documents. DAS, pages 255–267, 2006. [6] U. Pal, S. Sinha, and B. B. Chaudhuri. Multi-script line identification from Indian document. ICDAR, 2:880–884, 2003. [7] G. Sfikas, C. Constantinopoulos, A. Likas, and N. Galatsanos. An analytic distance metric for gaussian mixture models with application in image retrieval. ICANN, LNCS 3697, pages 835–840, 2005.
[8] A. Spitz. Determination of the script and language content of document images. TPAMI, 19(3):235–245, 1997. [9] T. N. Tan. Rotation invariant texture features and their use in automatic script identification. TPAMI, 20(7):751–756, 1998. [10] M. Vasconcelos and N. Vasconcelos. Natural image statistics and low-complexity feature selection. PAMI, 31(2):228–244, 2009. [11] S. L. Wood, X. Yao, K. Krishnamurthi, and L. Dang. Language identification for printed text independent of segmentation. Intl. Conf. Image Processing, 3:428–431, 1995.