connected to the collector a monitor. Because BGP routers only propagate the best path to each destination network, one may not be able to collect the complete ...
Cyclops: The AS-level Connectivity Observatory Ying-Ju Chi, Ricardo Oliveira, and Lixia Zhang University of California, Los Angeles {yjchi,rveloso,lixia}@cs.ucla.edu
ABSTRACT
of raw data which is time-consuming to navigate. What’s needed is an interactive visualization tool that enables one to easily extract out specific information one is interested, and to present the information in a most comprehensive view. To this end we have developed Cyclops, an interactive toolset to display AS topology connectivity and its changes. Starting with a general assumption that users’ interest can be expressed as the connectivity surrounding a specific AS, Cyclops is an AS-centric visualization tool: at any given time, it displays the connectivity of a specific AS x, which we call the eye of the Cyclops, together with its adjacent ASes. Given the large AS topology size, Cyclops limits the amount of information to be displayed at each time through focusing on one AS at a time. To provide flexibility of usage, Cyclops offers users three different ways to access the AS topology: 1)raw data, 2) web interface, and 3)visualizer. Cyclops raw data is available from http://cyclops.cs.ucla.edu, which can be downloaded by ISPs and processed locally for various connectivity analysis and fault detection purposes. The web interface offers a quick snapshot of the Cyclops eye’s connectivity by providing an order list of all the inferred AS links attached to the AS in focus, together with a number of measurement parameters for each link, such as the link’s life time and the number of routes over the link (when applicable). One can sort the neighbor ASes by different parameters, for instance by the link’s life time to view the newest neighbor ASes as observed in BGP routing system to either verify a newly added neighbor or detect a faulty link. Finally, the interactive visualizer provides a graphic view of an AS’s topological connectivity and changes over a given observation period. Through the use of different graphical notations to denote new or dead nodes and links, AS degrees, AS types, link ages, and number of routes carried over the links, the visualizer provides a comprehensive view of an AS’s connectivity and its changes over time, and allows navigation through neighbor ASes. As we will show in a few case studies later in the paper, the visualizer has proven to be very useful to understand AS topological changes. The rest of the paper is organized as follows. Section 2 provides a brief background on AS level connectivity inference through BGP routing system. Section 3 presents the design of Cyclops, including a detailed description of its three output interfaces: the raw data, the web interface, and the visualizer. In section 4 we show several case studies to illustrate the usefulness of Cyclops. We discuss related work in Section 5, and conclude the paper in section 6 together with a discussion on future work.
In this paper we present Cyclops, a system that collects and displays information of AS-level connectivity extracted from looking glasses, route-servers and BGP tables and updates of hundreds of routers across the Internet. From an operational standpoint, Cyclops provides ISPs a view of how their connectivity is perceived from the outside, enabling a comparison between their observed connectivity and their intended connectivity. ISPs can use the tool to detect and diagnose BGP misconfigurations, route leakages or hijacks based on false AS path. From a research standpoint, Cyclops is able to provide a quick snapshot of the AS-level connectivity of each network, and provides mechanisms to infer the root cause of BGP (de)peerings, which is an important input to the study of AS-level topology models and inter-domain routing protocols. Categories and Subject Descriptors: C.2.3 [Network Operations]: Network monitoring General Terms: Measurement, Security. Keywords: Internet AS topology, BGP misconfigurations, BGP prefix hijacking, Network fault detection
1.
INTRODUCTION
The Internet is a vast distributed system where autonomous systems (ASes) interconnect among each other to enable communication between millions of end hosts around the globe. As of May 2008 more than 28,000 ASes were observed in the Internet routing infrastructure. Understanding the dynamics and evolution trend of this AS-level topology is an important research topic as it will help advance our understanding of the interplay between networking technology, the resulting topology, and the economic forces behind them. We started an AS-level topology collection effort in January 2004 by inferring AS connectivity from BGP routing data collected from multiple sources [24]; interested readers may see [2] for more details. This topology collection effort has enabled us to observe the Internet topology growth [22] as well as to qualify the completeness of the collected topology as compared to the actual AS connectivity [21]. More recently, when we shared the inferred AS connectivity information with network operators, some operators detected network misconfigurations by comparing their expected AS connectivity with our inferred connectivity, showing us the potential of applying our inferred topology connectivity to fault detection in the global routing system. However, our topology database contains a large amount
ACM SIGCOMM Computer Communication Review
7
Volume 38, Number 5, October 2008
4
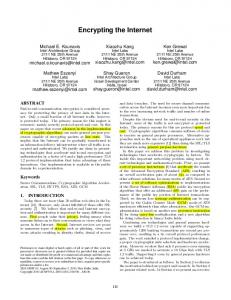
a destination prefix, a router typically has a preference order of choosing routes from customers first, then peers and finally providers. In Figure 1, assuming AS-1 is a customer of AS-2, AS-2 and AS-3 are customers of AS-4, and AS-2 and AS-3 are peers, then AS-3 selects the peer route from AS-2 rather than the provider route announced by AS-4.
P:2 1
2 P:4 2 1
3
P:2 1
2.1
P:1
Monitor P:3 2 1
Collector
P Provider Peer
Customer Peer
1
Figure 1: The Internet Topology and BGP monitoring.
2.
BACKGROUND
The Internet consists of a large number of networks called Autonomous Systems (ASes), each with an allocated unique AS number. An AS may contain one or multiple destination networks, each represented by an IP prefix. For example, AS 52 (UCLA’s AS number) announces 5 IP prefixes, and one of them, 131.179.0.0/16, represents the network of UCLA Computer Science Department. ASes exchange destination network reachability information using the Border Gateway Protocol (BGP). A BGP update contains the AS path used to reach a destination prefix, i.e. a list of AS numbers of all the networks traversed. Figure 1 is a simplified example to illustrates BGP update propagation. AS-1 owns a prefix P and announces it to neighbor AS-2. When receiving the update, AS-2 adds its own AS number to the path and further propagates the update to its neighbors. Note that a BGP router may receive multiple paths to each destination, but it only propagates the best path to neighbor ASes. For example AS-3 in Figure 1 will receive two paths to prefix P and select {P:2 1} as its primary path and propagates it to a BGP collector box;we call the router in AS-3 which is connected to the collector a monitor. Because BGP routers only propagate the best path to each destination network, one may not be able to collect the complete AS connectivity from BGP updates. In studying Internet AS-level topology, one views the Internet as an AS-level graph, where each node represents an AS and each link represents a traffic exchange agreement between two ASes; this agreement is realized by the establishment of one or multiple BGP sessions between the two neighbor ASes, perhaps over multiple physical links at multiple dispersed geographical locations. Generally speaking, ASes can be classified into two classes: transits and stubs. A transit AS provides Internet access to other ASes in addition to it own customers, while a stub AS is a source or destination of data traffic and does not provide transit connectivity to any other ASes. The AS-links can be broadly classified in two types: customerprovider and peer-to-peer. In a customer-provider relation, the customer pays the provider for the Internet access, whereas in a peer-peer relation ASes exchange traffic with each other without payment. Therefore, when given multiple routes to
ACM SIGCOMM Computer Communication Review
8
Monitoring and Data Collection
RouteView [6] and RIPE [5] represent two major BGP monitoring projects today. They manage a set of collectors, which establish BGP sessions with operational routers, called monitors, to receive the updates and periodically dump a snapshot of each monitor’s routing table. The total number of monitors have been increasing over time. At the time of this writing there are several hundreds of such monitors, although only about 120 or so monitors provide a complete BGP routing table; the rest provides only a partial table. The topology database http://irl.cs.ucla.edu/topology/, which is described in [24], includes data collected from route servers, looking glasses [3], and routing registry databases in addition to the data from all the RouteViews and RIPE collectors1 . We term the AS-level connectivity extracted from this data set as Public-View. Cyclops uses the Public-View data collected from January 2004 to present. It is well known that the inferred AS topology is rather incomplete, and that it remains a research challenge to quantify the degree of this incompleteness [21]. Cyclops’ ability to visualize AS connectivity and its changes is confined by the limitation of the dataset. Nevertheless as we illustrate later in the paper, Cyclops provides visual display of topological changes based on the available data set, a valuable function that is unavailable previously, and offers itself as a powerful detection mechanism for routing hijacks.
2.2
Topology Inference and Fault Detection
For each specific AS-x, there is a list of neighbor ASes with whom x has traffic exchange agreements; we term this list the ground truth of AS-x’s connectivity. In general we do not know the ground truth of x, and we infer x’s neighbor ASes from the AS paths carried in BGP updates. At any given time, differences may exist between the list of inferred AS neighbors and that from the ground truth. These difference can stem from several reasons. First, the limited number of vantage points used in the Public-View limits its completeness in revealing all AS-x’s neighbors [21]; i.e. some neighbors in x’s ground truth may be invisible in Public-View. However by accumulating the observation of x’s neighbors over time, one can significantly reduce the differences [22]. At the same time, accumulating the observed x’s connectivity over time can also introduce stale links that are no longer exist, hence contributing to the difference between inferred connectivity and ground truth. Furthermore, false links caused by BGP misconfigurations, or even intentional route hijacks, also contribute to the difference between the inferred AS-x’s connectivity and its ground truth. The first two causes of the differences, namely invisible or stale AS links in the inferred topology, result from limitations of the measurement infrastructure and have been mitigated to a certain degree recently [21, 22]. The third 1 We currently do not use AS topological data derived from traceroute measurements due to the issues in converting router paths to AS paths, as extensively reported in previous work [10, 18, 13, 22].
Volume 38, Number 5, October 2008
cause is the results of faults or malicious attacks, which can affect data delivery to AS-x or to other ASes. A specific example of a route hijack happens when AS-y wants to hijack traffic to a prefix p owned by AS-x. AS-y may announce prefix p to a neighbor AS-z. However AS-z can detect such hijacks by verifying the origin mapping (p, x) against the Internet Routing Registry. A more subtle hijack by AS-y is to announce a route to p with a false AS link y − x in the AS path. Cyclops provides an effective means to detect both types of route hijack by allowing whoever knowing the ground truth of AS-x to compare it against AS-x’s inferred connectivity. False links in the inferred AS connectivity can also be due to BGP misconfigurations. For instance, if a customer ASw starts advertising its provider or peer routes to its BGP neighbors, i.e. the case of a route leakage, Cyclops will suddenly observe new AS links attached to AS-w. In fact, operators have indeed detected misconfigurations using our inferred AS connectivity data.
3.
conflict by providing the user a web interface in addition to the visualizer. Cyclops’ web interface enables one to easily find out the information needed by allowing the user to sort an AS’s neighbor list by a number of different measurement parameters, as described in Section 3.4. It is most likely that other usages of the AS connectivity information exist that we have not recognized, or will arise once the availability of this information is widely spread. To meet the unknown and future need, we also provide our AS connectivity information in the raw data format, so that any interested parties can download and process the data locally to meet their own needs. In fact we have heard from a number of colleagues who have used our data in various research projects.
3.2
CYCLOPS DESIGN
In this section we first discuss the design goals of Cyclops, then present an overview of Cyclops design, followed by a description of each of Cyclops’ three output modules, raw data, web interface, and the visualizer.
3.1
Design goals
Cyclops is designed to meet the need for AS topological connectivity information for various different purposes. In particular, the design has the following goals in mind: • Being able to quickly locate high activity periods in AS topology changes. • Providing a comprehensive visual inspection of AS connectivity and changes. • Enabling navigation through the AS connectivity to examine topological event correlations. • Being able to scale the display to allow the examination of individual AS’s connectivity changes in detail. The first goal is achieved through the development of an activity window, which is described in Section 3.5.2. The activity window uses bar graphs to display a condensed presentation of AS connectivity changes over a specified time period, allowing one to spot periods with high connectivity changes in one glance. The second goal is realized through the judicious use of various graphical notations to denote new or dead nodes and links, AS degrees, AS types, link ages, and number of routes carried over the links in Cyclops’ visualizer. The AS connectivity navigation is accomplished in the visualizer as well; one can move the focus, the Cyclops’s eye, from one AS to any other neighbor AS and so one and so forth. The last goal on scalable display is more challenge. On the one hand, one would like to be able to present in detail all the connectivity of a given AS. On the other hand, large ASes can have thousands of neighbor nodes, which makes the visual presentation of the connectivity to all the neighbors both infeasible and less useful, because the specific information a user is interested in would be embedded in the large amount of other information. We resolved this
ACM SIGCOMM Computer Communication Review
An overview of Cyclops
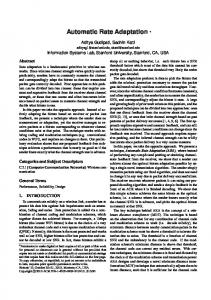
Figure 2 summarizes the Cyclops implementation. Daily collected BGP data from the Public-View first goes through a pre-processing stage where AS links and timestamps are extracted. More precisely, for each AS link in an AS path, we record the first and last times the link was seen, and whether the link was seen in the beginning, middle or end of the AS path. In addition, we save the last seen BGP update message that contained that link. In the pre-processing stage, we also glean AS paths to infer business relationships between ASes, i.e. provider-customer, or peer-to-peer, and this relationship information is then used to do AS classification. The specific method we use to do AS relationship inference is deceptively simple. We extract the AS links from the BGP routes collected from the Tier-1 ISP monitors over a window of time which should span several months. In the AS path a0 –a1 – ... –an , the link a0 –a1 can be either peer-peer or provider-customer (a0 refers to the Tier-1 AS the monitor resides in), but the remaining links in the AS path should be of type customer-provider according to no-valley policy. Furthermore, if a0 –a1 turns out to be a customer-provider link, it will be revealed in routes of another Tier-1 AS, therefore we will be able to accurately label it. The peer links are inferred by doing the diff between the entire set of links extracted from all the monitors and the set of customer-provider links, i.e. the peer links are all the links that are not propagated upstream to Tier-1s. In addition, we sort ASes into four classes based on the number of downstream customer ASes: stubs if they have 4 or less downstream ASes, small ISPs if they have between 5 and 50 downstreams, large ISPs if they have more than 50 downstreams, and finally Tier-1 ASes. To measure how much an AS link is used, we keep track of the number of BGP routes carried on each AS link. We call this number the link weight, a concept borrowed from our previous work [16]. To avoid measurement bias, the link weight measurement only uses data from the N ' 120 monitors in Public-View that provide full BGP tables and reside in different ASes. We denote wij (t) the number of routes of P j monitor j that use link i on day t, and wi (t) = N1 j wi (t) the average weight of link i over all the N monitors. We further compute an expected weight of each link over time using a TCP RTT measurement-like smoothed average: w ˆi (t) = 0.8w ˆi (t − 1) + 0.2wi (t), and keep track of the difference between the instantaneous link weight on day t and the expected weight of each link i: ∆wi (t) = wi (t) − w ˆi (t). A significant difference can be used to trigger alarms. Furthermore, we keep track of two different weights depending
9
Volume 38, Number 5, October 2008
Visualizer Topology & weight files
Web Interface
Cyclops DB
Pre-processing
AS relationship inference & AS classification
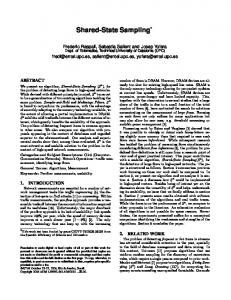
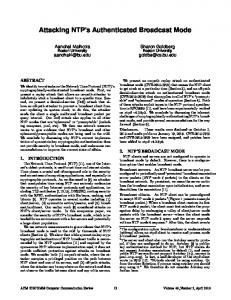
clops, a given AS-x, within a given time window. It also complements Cyclops visualizer in scaling the topology display by allowing one to view a complete list of all the neighbors of large ISP ASes whose neighbor counts may go as high as thousands which makes visualization infeasible. The inputs to the web interface include the eye of the Cyclops, AS-x, the time period [t0 , t1 ] of interest, and a choice between showing all neighbor ASes and showing the connectivity changes only. In connectivity mode, a snapshot of the neighbors of x at time t1 is displayed in the table. In change-only mode, all topology changes incident to x that occurred in the interval [t0 , t1 ] are displayed; the changes include both new AS links and disappeared AS links. As an example, Figure 3 shows the Cyclops web user interface, together with the connectivity listing for AS174 (Cogent, an ISP). The table includes information for each neighbor of AS174, such as ASN, AS name, AS type (stub, small ISP, large ISP, Tier-1), number of downstream ASes within ()’s, relationship with x (customer, provider, peer), node degree, link appearance and disappearance date, link lifetime, link weight, and last BGP message observed which contained the link2 . The ”Weight (to)” column shows the link weight in the direction of AS174 to neighbor AS; the ”Weight (from)” column shows the link weight seen in the direction from neighbor AS to AS174. To fill in the ”Weight (from)” column for a neighbor requires a monitor being hosted in that neighbor AS. The Avg. value is the expected weight as described in Section 3.2; the Diff. value is the percentage of difference between the link weight on the ”End Date” and the expected weight. The neighbor listing shown in Figure 3 is in the order of the node degree (the number of connections each neighbor AS has); one can click on any other parameter to order the neighbor list by the values of that specific parameter. For example, if one wants to know whether the AS is involved in any route hijack, one can sort the list by link lifetime and see the AS links with shortest lifetime on the top. The last BGP message informs the user who originated the BGP update message that caused the links to appear. Other columns in the table help users observe neighbors by degrees, relationship or AS types. Figure 4 shows AS-174 connectivity in change-only mode, where all topology changes incident to AS-174 that occurred in the time interval [t0 , t1 ] are displayed. In this specific case, 18 links changed during the period of [5/23/08, 5/29/08] (the table is truncated due to space limit). The first row shows a link that disappeared since 5/25/08 with a lifetime of 947 days; the eighth row shows a new link to AS10279 that was added on 5/27/08. Note that the ”Weight (from)” column shows no value, this is because there is no monitor inside any of those neighbor ASes.
Raw data
Alarm generation • weight • lifetime • PV-GT …
BGP data
Figure 2: Cyclops implementation block diagram on the position of the eye of the Cyclops in the AS link seen in the routes. wto represents the number of routes using the link x–y, where x is the eye of the cyclops and y one of its neighbors; wf rom represents the weight of the link y–x, towards the eye of the Cyclops x. Usually for stub networks, Cyclops only displays the values wf rom , since we would need a monitor at the stub to capture the other direction. Keeping both directions is important because it gives perspective on how the Cyclops eye slices routing through its neighbors, as well as how its neighbors point routes towards it. All the above mentioned information, the AS links, the last BGP update reporting each link, the link weights, as well as the AS relationships and classification, is imported to the main Cyclops database on a daily basis to provide input into the three outputs of Cyclops, raw data, web interface, and visualizer, which are described in the rest of this section.
3.3
The Raw Data Output
Cyclops’ raw data is basically a database dump which is readily available for download. It consists of a directory of text files, one per AS, that are updated daily and reflect the observed connectivity of each AS. This data can be used by anyone who is interested in studying Internet AS-level connectivity. One may download the data and perform customized processing to suit his specific purposes, e.g. measuring and modeling the growth and changes of the AS topology. The raw data can also be used by ISPs to compare the observed connectivity with their intended connectivity, and detect cases of route leakages/misconfigurations, as well as false links induced by route hijacks. In fact, we already have anecdotal evidence of the utility of this approach; one of the ISPs that used Cyclops raw data detected a few cases of misconfigurations by noticing suspicious AS neighbors in our database; information from the last BGP messages for each link helped nail down the specific configuration errors that led to the false AS connectivity. We believe that Cyclops has a great potential to provide input to building an effective fault detection system; we further explore this possibility in Section 6.
3.4
3.5
2 The value shown in the ”Last BGP Message” column is the prefix in that update, embedding a hyperlink to the message. 3 It uses the Fruchterman-Rheingold layout algorithm provided by the Jung API [17].
Cyclops Web Interface
Cyclops web interface is designed to provide users a quick snapshot of AS connectivity surrounding the eye of the Cy-
ACM SIGCOMM Computer Communication Review
Cyclops Visualizer
The Cyclops visualizer is a Java application designed to visualize AS connectivity and changes, as well as to enable the examination of change correlations that would otherwise be difficult to capture3 . As an example, if we observe that the link between AS-x and AS-y is removed at some point in time, and the links between x and a number of its other
10
Volume 38, Number 5, October 2008
Figure 3: A snapshot of Cyclops web interface: connectivity of AS174.
Figure 4: AS174 connectivity changes during the period of [5/23/08, 5/29/08].
ACM SIGCOMM Computer Communication Review
11
Volume 38, Number 5, October 2008
Figure 5: Snapshot of Cyclops visualizer. neighbor ASes are also removed at the same time, then we see that x is having a reduced connectivity to the rest of the Internet, and that x could be the major factor causing the link removals. Another feature of the visualizer is that its activity graph shows the aggregated topological change activity of the entire period starting from January 2004, providing an easy way for the user to visually inspect and detect anomalous events and drill down the details. The Cyclops visualizer consists of three main parts: topology graph, activity graph, and control panel. We describe each of these parts in the following sections.
3.5.1
Topology Graph
The main component of the visualizer is the topology graph centered at the Cyclops’ eye x, as shown in Figure 5. As in the web interface, the visualizer has a connectivity mode and a changes-only mode, defined by the start date t0 and end date t1 . When in connectivity mode, all neighbors of x at time t1 are represented in the graph, one node per AS (edges in the graph represent commercial agreements between ASes). In changes-only mode, only the link removal and additions that occur within the interval [t0 , t1 ] are shown. When in changes-only mode, we define new nodes(or ASes) and new links as those nodes/links appearing after the start date t0 and before the end date t1 . Similarly, the dead nodes/links are defined as nodes/links which were present at the start date t0 but disappeared before t1 . We use the color green to mark the birth of new nodes/links, red to denote the death of nodes/links, blue to indicate the eye of the Cyclops, and orange for all other nodes/links. Furthermore, to put the importance of each node/link in perspective, we use the following parameters: AS degree, AS type, age of links, and number of routes carried by each link. To visually differentiate large ISPs from small ones, we draw the node size proportionally to the connectivity degree of the AS. We also
ACM SIGCOMM Computer Communication Review
Figure 6: Detail of Cyclops visualizer.
use different vertex strokes to denote the AS type: thick circles for Tier-1 ASes, dotted circles for transit nodes, and solid circles for stubs. The edge thickness is either proportional to the age of the link (separating links that have been around for a long time from short-lived ones) or to the number of routes using that link (separating links that carry a heavy number of routes from the others). In addition, each link has a label that displays the lifetime in days, as well as the number of routes carried. For a dead link, the number of days since its death is also shown in parentheses in the label. For example, in Figure 6, AS 11537 connected to Tier-1 AS 3549 94 days ago (this is the age of the link). It also depeered with AS 11095 (which is now dead) 82 days ago and a stub AS 13998 147 days ago. The age of the link between 11537 and 13998 was 407 days, just when the link was removed. As noted by [22], changes in the observed topology may not correspond to changes in the real topology, e.g. a link
12
Volume 38, Number 5, October 2008
given time. The interface also includes several output filters, such as filtering only birth or death, separating transit nodes and stubs, and AS degree threshold. These filters reduce the amount of information in the graph, making it more readable.
3.6
The web interface and the visualizer have different features and their own advantages and disadvantages. A picture is worth a thousand words: the visualizer is designed to summarize primary information in the connectivity graph and provide a view of the big picture. The graphical interface makes easier the navigation across time and location and enables the identification of correlations between peerings and de-peerings. However, the visualizer does not scale well when the number of links goes above the 2-digits, as the graph becomes unreadable. The web interface overcomes this problem by providing a quick way of getting a textformat ordered list of neighbors and connectivity changes. Users can sort the list in multiple different ways according to what they are interested in capturing, e.g. short lifetimes, high degrees. Furthermore, by providing raw data access, Cyclops enables ISPs to run their own scripts to compare the PV with the ground truth, and signal alarms when appropriate.
Figure 7: Activity graph. x−y may temporarily be down for maintenance, even though the commercial agreement between x and y is still up. However, we have high confidence to say a link is dead if it disappears and does not reappear again for a sufficiently long time. In the topology graph, we use the transparency of each link to represent how likely it is that the link was actually removed from the topology. The less transparent the links is the less likely it corresponds to an actual topology change, i.e. the result of transient routing dynamics should be represented by more transparent links. The correlation between different changes is done by opening one node after the other. When a node is open, it becomes another eye, so all its neighbors are also displayed. Say we start with node x as the eye of the Cyclops, then we find an interesting depeering with a neighbor y. We might want to open y to verify if the depeering was part of a series of events initiated by y. In Section 4 we show how Cyclops can be used to do this.
3.5.2
4.
Activity Graph
4.1
Google route leakage
Our first case study involves Google, which is currently probably the largest content provider in the Internet. Figure 9 shows the activity graph for Google (AS 15169) from January 2004 to October 2007, which is a good starting point to discover anomalous events. We observe a big spike (both positive and negative) a bit after the half of the period, that represents several peerings and depeerings happening very close in time. We drill down in this period using the sliding time window and study the AS connectivity changes in detail. As shown in Figure 8(a), on July 18th 2006 Google established connections with 36 new neighbor ASes. However, according to Figure 8(b), on the next day all these new links were depeered, and therefore they have a lifetime of 0 days (which is shown in the link labels). We believe that on 18 July 2006 Google accidentally leaked a series of peer routes to its neighbors, however the problem was easily fixed. Route leakages usually result from BGP misconfigurations in routers, which start announce routes that should be filtered. Usually the end result is loss of reachability to those destinations. Note that this event could have also been detected just by sorting the lifetime column in the web interface, where the 0 lifetime entries would have cause some alarm.
Control Panel
The visualizer control panel provides multiple options to let users filter what they are interested in visualizing. As already mentioned, users can select between changes-only mode and connectivity mode. In the changes-only mode users can focus on examining connectivity changes in a specific time interval, and in connectivity mode users have a visual of the entire connectivity of the Cyclops’ eye at a
ACM SIGCOMM Computer Communication Review
CASE STUDIES
In this section we show how to use Cyclops in four different case studies. We extract these cases from anomalous events seen in Cyclops involving large ISPs and content providers. After discovering any anomalous event, we either contact directly the network operator or search the NANOG mailing list[4] for further verification.
The Cyclops activity bar shown in Figure 7 is designed so that users can have a summarized view of (de)peering activity over the entire observation period, enabling the detection of anomalous events. The green positive bars in the graph represent the number of new links over 7-day time slots, while the red bars on the alternate side of the time axis represent the number of disappeared links. The activity graph enables users to identify the time periods with anomalous number of changes, and further examine those periods in more detail. The smaller time window in the graph (represented in Figure 7 in a darker color) allows users to select a specific time interval to visualize in the topology graph. For instance, in Figure 7 there are four noticeable spikes of depeerings, which can be further investigated by sliding the smaller window to the appropriate event. Since the magnitude of the small bars in the activity graph may vary a lot, and to avoid one specific period overwhelming the others, we make the scale of the Y-axis adjustable. Therefore, when setting the scale, all the bars which exceed the given value will be set to the maximum length in the plot, and the length of other bars will be scaled linearly relative to the value. This can help users filter out outliers and obtain a clearer view of usual activity.
3.5.3
Comparison of visualizer and web interface
4.2
Yahoo outage
Our second case study also involves a route leakage, this time affecting Yahoo. Several sites, including Yahoo (AS
13
Volume 38, Number 5, October 2008
Figure 9: Google.
The activity plot for Figure 10: The topology change graph for AS 10310 (Yahoo) on 6 July 2007. Figure 11: The topology change graph for AS 9318 on 6 July 2007. 10310), were unreachable on July 6th 2007. Using the visualizer, we examine Yahoo’s connectivity around that time and check for anomalous events. Figure 10 shows that Yahoo added a new neighbor AS 9318 on that day, but the neighbor was removed within the same day. This is usually a sign of a misconfiguration. Since there is no other change in Yahoo’s connectivity, we open a second Cyclops’ eye at AS 9318 and start looking for connectivity changes. Figure 11 shows the changes involving AS 9318 on that day, and we note that all links appear and disappear within the same day. We believe AS 9318 accidentally propagated some routes coming from Yahoo to other neighbors, and therefore some points in the network stopped reaching Yahoo’s prefixes. This was further confirmed by an independent analysis posted in NANOG mailing list.
4.3
Cogent depeerings
Our third case study concerns a set of depeerings made by Cogent (AS 174), as described in detail in [23]. According to [23], during April 2007 Cogent depeered several small european ISPs. Figure 12 shows the depeerings of Cogent during March and April 2007 as captured in Cyclops visualizer. We observe that the depeering activity in April was much more intense than that in March. The edge thickness in this case is proportional to the link age, and from the graph we can observe that most of the links involved have a considerable age. We verified some ASes that were reported by [23] to have been depeered, and all of them were confirmed by Cyclops. In September 2007 there was another discussion thread on the NANOG mailing list about whether Cogent depeered with Limelight Networks, nLayer Communications, and WV Fiber. Several people tried to figure out what happened to Cogent by different methods, such as traceroute and looking at RouteView data, but they obtained different results. Figure 13 shows the changes in Cogent connectivity during September 2007 using Cyclops web interface. We can see that Cogent depeered with WV Fiber (AS 19151) on 17 September and Limelight (AS 22822) on 27 September, but it did not depeer with nLayer. These observations are consistent with the conclusion of the NANOG thread later on.
(a) 18 July 2006
(b) 19 July 2006 Figure 8: The topology change graph for Google on 18 and 19 July 2006.
4.4
Depeerings in Qwest
Our last case study uses the visualizer to correlate different depeering events. Figure 14 shows that Qwest (AS 209) had two significant depeerings with AS6395 and AS8075 in April 2007. In this figure, the thickness of edges is propotional to the number of routes carried by the links, and the
ACM SIGCOMM Computer Communication Review
14
Volume 38, Number 5, October 2008
Figure 14: Correlating different depeerings affecting Qwest and its neighbors in April 2007.
Figure 13: Cogent depeerings in September 2007. (a) Cogent depeerings in March 2007. edge labels indicate the link ages and the time since depeering in days. We added AS 8075 and AS 6395 as extra Cyclops’ eyes, which were the two most significant depeerings of Qwest at that time. The expanded views show that the depeering between Qwest and AS 6395 is part of a set of depeerings originated from AS 6395 some days before the observation time (values within the parentheses in the labels). On the other hand, the depeering between Qwest and AS 8075 seems to be part of a set of independent depeerings originated from AS 8075. From this analysis, we believe the two depeerings with Qwest were not originated from Qwest and are not related to each other. (b) Cogent depeerings in April 2007.
5.
Figure 12: The topology change graph for Cogent in March and April 2007.
ACM SIGCOMM Computer Communication Review
RELATED WORK
Most of the recent work in network visualization has focused on the analysis of BGP routing dynamics [7, 15]. These visualization tools have been used to detect and diagnose routing disruptions affecting a given destination prefix or group of prefixes. Different from these existing tools, Cyclops visualizer focuses on highlighting AS connectivity changes such as new peerings and depeerings, and provides means to correlate these events among different ASes. The Cooperative Association for Internet Data Analysis
15
Volume 38, Number 5, October 2008
7.
(CAIDA) has designed several visualization tools for the Internet topology [8]. One of them is Mapnet [11], which displays the infrastructure (PoP level) of multiple U.S. backbone providers over a geographic map. Otter [12] is another toolset which visualizes a wide variety of Internet data, such as multicast and unicast topology databases, core BGP routing tables, and SNMP data. HERMES [9] and VAST [20] also aim to visualize the AS level connectivity. HERMES allows users to explore and visualize the AS interconnections, information about ASes, and the BGP routing policies, while VAST is a 3-dimensional graphical tool that provides information about both the overall topological properties of the Internet as well as individual AS behavior. FixedOrbit [1] provides a web interface to obtain the listing of neighbors of a given AS. Although the above mentioned tools use various approaches to visualize the static Internet topology properties, none of them is able to display the changes in the connectivity. In contrast, Cyclops provides a view of the topology changes and the details of the BGP messages used to infer each change. The comparison between Public-View and ground truth enabled by Cyclops was partially explored by Lad et al. [14] when verifying the last hop AS. Cyclops provides a more comprehensive verification by including all the links in all the observed AS paths, as well as the BGP messages that can be used for troubleshooting.
6.
CONCLUSION AND FUTURE WORK
In this paper we presented Cyclops, a toolset that displays AS-level connectivity and changes as inferred from Public-View. From a research standpoint, Cyclops provides an interactive display of each AS’s connectivity and navigation mechanisms to examine the correlation of inter-AS link changes, which can serve as an important input to the study of AS-level topology models. From an operational standpoint, Cyclops provides ISPs a view of their AS connectivity as seen from the BGP routing system, enabling a comparison between the observed connectivity and the intended connectivity. ISPs can utilize the data provided by Cyclops to detect and diagnose BGP misconfigurations, route leakages or even route hijacks. To make Cyclops more useful, we have sketched out several steps. First, false detections require that AS connectivity observed from the BGP routing system be provided in real time. Due to the delays in data collection, our topology database is updated on a daily basis. Our very next step is to integrate Cyclops with BGPMon[19], a newly developed real time BGP data collection system which can provide Cyclops with real time BGP feeds. We also plan to explore the possibility to make Cyclops generate alarms for suspicious AS connectivity changes based on multiple criteria such as link lifetime and link weight differences. We envision a subscriber system, where each AS owner is notified with an alarm on a link with the AS as one end is triggered, e.g. if one or multiple new links involving the AS suddenly occur. We are also adding to Cyclops information about geographical location of PoPs where each AS has a presence, and information about which prefixes are announced at which PoP. Going beyond the concept of treating each AS as an atom is an essential step towards understanding the internal structure of each AS.
ACM SIGCOMM Computer Communication Review
REFERENCES
[1] Fixedorbit website. http://www.fixedorbit.com. [2] Irl internet Topology Collection. Available from: http://irl.cs.ucla.edu/topology/. [3] Looking Glass Site. http://www.nanog.org/lookingglass.html. [4] Nanog website. http://www.nanog.org. [5] RIPE Routing Information Service Project. http://www.ripe.net/. [6] RouteViews Routing Table Archive. http://www.routeviews.org/. [7] G. D. Battista, F. Mariani, M. Patrignani, , and M. Pizzonia. BGPlay: A system for visualizing the interdomain routing evolution. In Graph Drawing, volume 2912 of Lecture Notes Computer Science, pages 295–306, 2003. [8] CAIDA. CAIDA Visualization Tools. Available from: http://www.caida.org/tools/visualization/. [9] A. Carmignani, G. D. Battista, W. Didimo, F. Matera, and M. Pizzonia. Visualization of the High Level Structure of the Internet with Hermes, 2002. [10] H. Chang, S. Jamin, and W. Willinger. Inferring AS-level Internet topology from router-level path traces. In SPIE ITCom, 2001. [11] K. Claffy and B. Huffaker. Macroscopic Internet Visualization and Measurement. Available from: http://www.caida.org/tools/visualization/mapnet/. [12] B. Huffaker, E. Nemeth, and K. Claffy. Otter: A General-purpose Network Visualization Tool, in INET 1999. Available from: http://www.caida.org/tools/visualization/otter/. [13] Y. Hyun, A. Broido, and kc claffy. On third-party addresses in traceroute paths. In Proc. of Passive and Active Measurement Workshop (PAM), 2003. [14] M. Lad, D. Massey, D. Pei, Y. Wu, B. Zhang, and L. Zhang. PHAS: A prefix hijack alert system. In 15th USENIX Security Symposium, 2006. [15] M. Lad, D. Massey, and L. Zhang. Visualizing Internet Routing Changes. IEEE Transactions on Visualization and Computer Graphics, 2006. [16] M. Lad, R. Oliveira, D. Massey, and L. Zhang. Inferring the Origin of Routing Changes using Link Weights. In Proc. IEEE ICNP, 2007. [17] J. Madaadhain, D. Fisher, P. Smyth, S. White, and Y.-B. Boey. Analaysis and visualizaiton of network data using JUNG. In Journal of Statistical Software, to appear. [18] Z. M. Mao, J. Rexford, J. Wang, and R. H. Katz. Towards an accurate AS-level traceroute tool. In Proc. of ACM SIGCOMM, 2003. [19] D. Matthews, Y. Chen, H. Yan, and D. Massey. BGP Monitoring System. Available from: http://bgpmon.netsec.colostate.edu/. [20] J. Oberheide, M. Karir, and D. Blazakis. VAST: Visualizing Autonomous System Topology. In VizSEC ’06: Proceedings of the 3rd international workshop on Visualization for computer security, pages 71–80, New York, NY, USA, 2006. ACM Press. [21] R. Oliveira, D. Pei, W. Willinger, B. Zhang, and L. Zhang. In Search of the elusive Ground Truth: The Internet’s AS-level Connectivity Structure. In Proc. ACM Sigmetrics, 2008. [22] R. Oliveira, B. Zhang, and L. Zhang. Observing the Evolution of Internet AS Topology. In ACM SIGCOMM, 2007. [23] T. Underwood. Renesys Blog. Available from: http://www.renesys.com/blog/2007/04/rough_day_at_cogent_ part_1_cog.shtml. [24] B. Zhang, R. Liu, D. Massey, and L. Zhang. Collecting the Internet As-level Topology. SIGCOMM Comput. Commun. Rev., 35(1):53–61, 2005.
16
Volume 38, Number 5, October 2008