Volume 20
HYDROACOUSTICS
Data Compression and Clustering of One-Third-Octave Spectra by “Acoustical Colors” Rafał JÓZWIAK2, Ivor NISSEN1, Karol LISTEWNIK2 1
Bundeswehr Technical Center for Ships and Naval Weapons, Naval Technology and Research (WTD 71), Kiel, Germany,
[email protected] 2 Polish Naval Academy (PNA) Faculty of Navigation and Naval Weapons Gdynia, Poland
[email protected] [email protected]
This article presents a new approach for the data compression and clustering of one-third octave spectrum by using "acoustical colours". Using in-situ measurements by the IGLOO – sensor nodes it can show that this approach allows a clustering of the colors for a quick look classification. This is helpful using wireless acoustical transmissions with restricted transfer volume in underwater sensor networks without jamming their own measurements. Keywords: cumulative value, acoustical colors, hydroacoustic measurement, underwater communication 1. Introduction Wireless data transmission from the devices installed on objects, infrastructure and underwater vessels is limited by the characteristics of the marine environment [2]. Wireless transfers are usually done in a low bit rate, which is connected to the small bandwidth information of the acoustic channel. It is caused by the multipath signal transmission, the difference in the attenuation of given water layers, the location of acoustic source and acoustic receiver, underwater obstacles such as technical objects [3,4], surface objects [5,6] and biomass. Since the bit rate of transmitted information is significantly limited, it becomes almost impossible to transmit sonar or camera images because to compare a bit image transfer takes hours. The Polish Naval Academy and the Bundeswehr Technical Center for Ships and Naval Weapons, Naval Technology and Research have bottom measurement modules equipped with
85
Volume 20
HYDROACOUSTICS
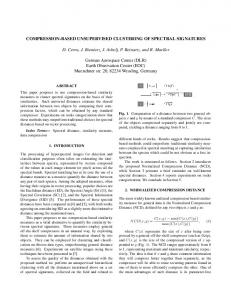
tetrahedral antenna which enables them to determine the movement trajectory of an object moving on and under the water [7,8,9]. The main information transmitted to the underwater sensor network in the acoustic channel is the location of the detected object and its acoustic features. The results of the research indicate that the basic information about the detected/tested object delivers one third - octave acoustics in the range of 3 Hz to 20 kHz. Research on the effectiveness of the acoustical colors method uses data transmitted underwater through the GUWAL protocol created by WTD 71. The purpose of this research was to limit the amount of bit transfer, enabling the classification of the detected and tracked objects through the use of the acoustic data compression algorithm “acoustical colors’’. 2. “Acoustical colors” method for compression of OTO spectra data Spectrum of One Third - Octave is one of the key parameters defining a given object from the acoustics perspective. However, its levels strongly depend on the distance of an object from the measurement module on the sea-bottom. Since bottom measurement modules use only passive sensors, it is difficult to determine the distance between an object and a measurement module despite very accurate sensor calibration [10]. Moreover, it is difficult to enter the adjustment to the OTO spectrum connected with the distance of the object and the measurement module. It will result in different levels of the OTO spectrum when the object crosses near or further from the measurement module. The solution to this problem is to normalize the OTO spectrum. As a result, the object’s distance from the measurement module has no impact on the value of SPL (Sound Pressure Level) of the normalized OTO spectrum, and the comparison of the two objects provides more explicit results [11]. However, in case of using more than one underwater measurement module, meaning the heterogeneous underwater module nets, it is necessary to transmit information about the detected objects through underwater communication. It is assumed that the underwater measurement modules prepare information about the detection of the same object. Normalized OTO spectrum in the range of 3 Hz to 20 Hz consists of 40 units, 8 bits each, which gives the value of 320 bits. The information signal is transmitted between communication modems in the form of parcels. There are four types of parcels: Data Request, String Message SMS, Data Replay, and Command and Control. One parcel has the length of 128 bits. The GUWAL protocol was formulated by WTD 71 for underwater communication between underwater communication modules. According to it, there are only 91 bits in a Data Replay parcel dedicated to receiving information from an adjacent module. Transmitting one normalized OTO spectrum requires the transmission of 4 parcels with the slow bit rate used in the underwater transmission which takes a lot of time and uses the energy of the underwater measurement module. In order to limit the amount of bits needed to transmit data that enables the identification of an object, the OTO spectrum compression for six parameters was proposed (R – red and index R, G – green and index G, B – blue and index B). R, G and B are the data that can be recorded in 8 bits. However R, B, and G index have the values between 1 and 40, thus they can be recorded in 6 bits, which is 3 · 8 + 3 · 6 = 42 bits and 87 % of compression. RGB data are “acoustical colors’’ which consist of 42 bits that can be transmitted in one parcel. Additionally, we have 49 bits left, which can be used to transmit other relevant information [1]. In order to evaluate RGB coefficients, we will use the cumulative distribution function [CDF], which is normalized by definition.
86
Volume 20
HYDROACOUSTICS
𝑃𝑃0 = 0
Where;
(1)
∑𝑗𝑗𝑖𝑖=1 𝑝𝑝𝑖𝑖 𝑃𝑃𝑗𝑗 = 𝑁𝑁 ∑𝑖𝑖=1 𝑝𝑝𝑖𝑖
(2)
Pj is the cumulated value for j-th element/index pi is the value of the OTO spectrum for i-th element/index
Fig. 1. GUWAL parcel types.
Normalizing the cumulated value by dividing each element of the pi sum from I=1 to j by adding OTO spectra values allows us to remove coefficient α dependent on the transmission losses TL, the function of the equipment directivity index DI and the distance of the detected object. ∑𝑗𝑗𝑖𝑖=1 𝑝𝑝𝑖𝑖 ∙ 𝛼𝛼 𝛼𝛼 ∙ ∑𝑗𝑗𝑖𝑖=1 𝑝𝑝𝑖𝑖 ∑𝑗𝑗𝑖𝑖=1 𝑝𝑝𝑖𝑖 𝑃𝑃𝑗𝑗 = 𝑁𝑁 = = 𝑁𝑁 ∑𝑖𝑖=1 𝑝𝑝𝑖𝑖 ∙ 𝛼𝛼 𝛼𝛼 ∙ ∑𝑁𝑁 ∑𝑖𝑖=1 𝑝𝑝𝑖𝑖 𝑖𝑖=1 𝑝𝑝𝑖𝑖
(3)
In this way the cumulative curve is neither dependent on the distance of the detected object from the measurement module, nor the type of the measuring system of the
87
Volume 20
HYDROACOUSTICS
measurement modules. This approach allows you to create a heterogeneous underwater module network. As a next step, three characteristic points (RGB coefficients) will be determined. Calculated RGB coefficients were marked on Fig 2 with the right colors.
Fig. 2. Cumulative value curve and selected RGB coefficients.
3. Results The article will present the acoustic data of four types of vessels, that were recorded in the Gulf of Gdansk during the international European Defense Agency SIRAMIS (Signature Response Analysis on Multi Influence Sensors) project. In phase one, normalized OTO spectrum was defined based on recorded timing. Fig. 3 and Fig. 4 illustrate the typical characteristics of the vessels.
Fig. 3. One-third-octave spectrum for ship “A”.
88
Volume 20
HYDROACOUSTICS
Fig. 4. One-third-octave spectrum for all ships.
Fig. 3 shows that for ten crossings the OTO spectrum has similar results. Only data 8 and 9 differ from the rest in higher frequency band. It is caused by the fact that during the measurement of the crossing of ship A, within a small distance another ship was also passing through. As a result, the OTO spectrum changed into higher frequency bands. In the next stage, cumulative curves and RGB coefficients were determined from OTO spectra according to formula (1,2).
Fig. 5. „Acoustical colors” for 4 different types of ships.
Fig. 5 presents the results of “acoustical colors” of four types of ships. We can observe that the cumulative curves look different for each ship. Furthermore, RGB coefficients form groups according to the type of the ship. It is easier to observe it on the 3D graph, where XYZ axes are the appropriate values of the coefficients R , (G-R) and (B-G).
89
Volume 20
HYDROACOUSTICS
Fig. 6. Plotting of R and (G-R) axes coefficients RGB.
Fig. 7. Plotting of R and (B-G) axes coefficients RGB.
Fig. 8. Plotting of (G-R) and (B-G) axes coefficients RGB.
90
Volume 20
HYDROACOUSTICS
Fig. 9. Graph 3D of R, (G-R) and (B-G).
Fig. 6-9 show clear group division according to the type of the ship. Ship C was passing with different speed (at 5, 8, and 11 knots). The groups are formed with regard to the ship’s speed. 4. Conclusions The results of this research proved that it is possible to classify four different types of ships based on one-third spectrum measurement. During the research, different types of ships were measured such as ship e.g. ,,A” – passenger, ship „B” – cargo, ship „C” – tug, and ship „D” – container ship. The research also shows that the compression of the value of 40 OTO spectra is possible for three RGB coefficients, which separate the measured ships. Additionally, RGB coefficients highlighted the difference of one ship that was moving with three different velocities. Further research should implement the „acoustical colors” algorithm in bottom measurement modules, which are the property of PNA and WTD 71. Moreover, joint research should be conducted on the Baltic Sea. Heterogeneous modules should share information about the detected object through underwater communication. This research will show whether it is possible to create a heterogeneous underwater module network. References [1] [2] [3] [4] [5]
I. Nissen, Underwater communication in heterogeneous networks with focus on Underwater Cooperation, Lectures Notes for PNA, Gdynia, 2017. I. Kochańska, I. Nissen, Limitations of WSSUS modeling of stationary underwater acoustic communication channel, Hydroacoustics, Vol. 19, 229-238, 2016. K. Listewnik, Sound silencing problem of underwater vehicles, Solid State Phenomena 196, 212-219, 2013. K. Listewnik, Some aspects of noise measurement of ships, Proceedings of 20th International Congress on Sound and Vibration 2013 (ICSV 20), pp. 4, Bangkok 2013. K. Listewnik, Influence of vibration of ship’s generating set on emitted acoustic energy, Hydroacoustics 9, 97-102, Gdansk 2006.
91
Volume 20
HYDROACOUSTICS
[6]
K. Listewnik, Underwater noise generated by merchants ships in coastal waters of the Gulf of Gdansk, Proceedings of 43rd International Congress on Noise Control Engineering, 4184-4190, Melbourne 2014. [7] I. Gloza, K. Buszman, R. Józwiak Tracking Underwater Noise Sources with the Use of a Passive Method, ACTA PHYSICA POLONICA A, Vol. 123, 1090-1093, 2013. [8] I. Gloza, R. Józwiak, P. Pawlik, W. Batko, Uncertainty Analysis Of The Determination Noise Source Direction Using The Tetrahedron Hydrophone Array, Hydroacoustics, Vol. 18, 59-68, 2015. [9] I. Gloza, K. Buszman, K. Listewnik, The passive module for underwater environment monitoring, 11th European Conference on Underwater Acoustics, 1787-1793, Edinburgh 2012. [10] K. Buszman, I. Gloza, R. Jozwiak, K. Listewnik, The calibration of hydroacoustic channel of mobile measurement module, Proceedings of the 2nd International Conference and Exhibition on Underwater Acoustics, 367-372, Rhodes 2014. [11] I. Gloza, R. Józwiak, K. Buszman The One–Third–Octave Spectrum As A Method Of Vessel Identification, Hydroacoustics, Vol. 17, 63-68, 2014.
92