Open Access
Open Access
Open Access
Earth Syst. Sci. Data, 4, 13–21, 2012 www.earth-syst-sci-data.net/4/13/2012/ doi:10.5194/essd-4-13-2012 © Author(s) 2012. CC Attribution 3.0 License.
Earth System
Science
Data
Social Geography
An 18-yr long (1993–2011) snow and meteorological dataset from a mid-altitude mountain site (Col de Porte, France, 1325 m alt.) for driving and evaluating snowpack models S. Morin1 , Y. Lejeune1 , B. Lesaffre1 , J.-M. Panel1 , D. Poncet1 , P. David1,† , and M. Sudul1,† 1
M´et´eo-France – CNRS, CNRM-GAME, URA1357, CEN, Grenoble, France † deceased
Correspondence to: S. Morin (
[email protected], col de
[email protected]) Received: 16 January 2012 – Published in Earth Syst. Sci. Data Discuss.: 6 February 2012 Revised: 31 May 2012 – Accepted: 9 June 2012 – Published: 6 July 2012
Abstract. A quality-controlled snow and meteorological dataset spanning the period 1 August 1993–31 July
2011 is presented, originating from the experimental station Col de Porte (1325 m altitude, Chartreuse range, France). Emphasis is placed on meteorological data relevant to the observation and modelling of the seasonal snowpack. In-situ driving data, at the hourly resolution, consist of measurements of air temperature, relative humidity, windspeed, incoming short-wave and long-wave radiation, precipitation rate partitioned between snow- and rainfall, with a focus on the snow-dominated season. Meteorological data for the three summer months (generally from 10 June to 20 September), when the continuity of the field record is not warranted, are taken from a local meteorological reanalysis (SAFRAN), in order to provide a continuous and consistent gapfree record. Data relevant to snowpack properties are provided at the daily (snow depth, snow water equivalent, runoff and albedo) and hourly (snow depth, albedo, runoff, surface temperature, soil temperature) time resolution. Internal snowpack information is provided from weekly manual snowpit observations (mostly consisting in penetration resistance, snow type, snow temperature and density profiles) and from a hourly record of temperature and height of vertically free “settling” disks. This dataset has been partially used in the past to assist in developing snowpack models and is presented here comprehensively for the purpose of multi-year model performance assessment. The data is placed on the PANGAEA repository (doi:10.1594/PANGAEA.774249) as well as on the public ftp server ftp://ftp-cnrm.meteo.fr/pub-cencdp/.
1
Introduction
The development of complex geophysical models requires adequate data for driving and evaluating their performance, i.e. observations to be compared to the model output. Meteorological conditions are the main driving data for land surface models, whose critical requirement, especially in high altitude or high latitude areas, is the ability to handle the inception, build-up and melt of the seasonal snowpack. In this case, evaluation data must include detailed information pertaining to the soil and the overlying snowpack. Such datasets are relatively scarce when meteorological data are required to Published by Copernicus Publications.
include all the needed components, including both solar and thermal incoming fluxes and an estimate of snow and rain precipitation at a timestep on the order of one hour. However, such datasets are absolutely necessary to develop and evaluate snowpack and hydrological models, which are then used for hydrological forecasting, avalanche risk prediction, or within land surface components of numerical weather prediction or climate models. The Col de Porte (CDP) site, located at 1325 m altitude (45.30◦ N, 5.77◦ E) in the Chartreuse mountain range, France, has been operated by M´et´eo-France, in collaboration with several academic and non-academic partners, since
14
S. Morin et al.: Col de Porte snow and meteorological data
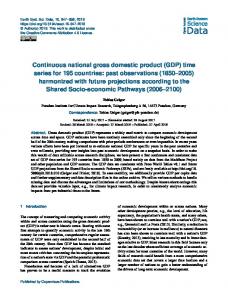
Figure 1. Overview of the experimental site at Col de Porte (1325 m altitude, Chartreuse mountain range, France). All sensors are located
within a radius of a few tens of meters. (1) Geonor precipitation gauge, (2) PG2000 heated and non-heated precipitation gauges, (3) windspeed measurements at the top of the 10 m meteorological mast, (4) lysimeters, (5) snow depth sensors and settling disks, (6) temperature and relative humidity sensors placed in the shelter, (7) radiation sensors placed on the rotating arm, (8) close-up on the 4 components radiation sensors, (9) building (cold room, data acquisition, lab space), (10) cosmic rays counter for SWE measurements, (11) former experimental area for the study of road/snow interactions, (12) automatic snow and weather station Nivose for testing purposes (generally used in remote mountain areas), (13) forest area impacted by the cut in 1999, (14) snow pit area. See text for further details on instruments.
1959. Hourly driving data and the corresponding evaluation data were collected during the snow season 1987–1988 during the early stages of the development of the Crocus snowpack model (Brun et al., 1989). Since the snow season 1993–1994, the full range of required meteorological driving data and the adequate evaluation data have been collected. The data have been instrumental in developing and evaluating snowpack models, including the initial SnowMIP effort (Etchevers et al., 2004). Here we provide background and up-to-date information on the data that has been collected between 1993 and 2011, resulting in a freely available, uninterrupted 18-yr long dataset. 2 2.1
Data description Site description
The CDP experimental site is located in a grassy meadow surrounded by a coniferous forest; all the measurements are Earth Syst. Sci. Data, 4, 13–21, 2012
located within an area of 50 × 50 m. Figure 1 provides an overview of the site environmental setting and the relative location of the instruments used. The height of the coniferous trees on the eastern side of the meadow lies between 10 and 20 m. Direct solar radiation can be blocked by surrounding mountains, trees or other obstacles. Solar masks at the location of the radiation sensors, are provided together with the dataset i.e. the zenith angle of light-blocking obstacles as a function of the azimuth. Besides natural growth of the trees and occasional cutting of some in the forest nearby on the eastern side of the meadow, the only significant change in the site characteristics occurred in the summer 1999, when all the trees forming a natural ridge on the northern side of the experimental plot were cut, resulting in a slight change in wind patterns at the site. However, the site experiences very low winds on average. The average hourly windspeed (at 10 m height) is
www.earth-syst-sci-data.net/4/13/2012/
S. Morin et al.: Col de Porte snow and meteorological data
15
Figure 2. Overview of the experimental site in the middle of the
Figure 3. Overview of the experimental site near the end of the
snow season (view towards the North). The numbering is similar to Fig. 1.
snow season (view towards the South). The numbering is similar to Fig. 1.
1.17 ± 1.10 m s−1 over the entire 1993–2011 period. It has slightly evolved from 1.08 ± 1.05 m s−1 from 1993 to 1999 to 1.23 ± 1.12 m s−1 from 1999 to 2011. The fraction of time when hourly windspeed is higher than 4 m s−1 has evolved from 2.08 % from 1993 to 1999 to 2.96 % from 1999 to 2011 (2.67 % over the entire 1993–2011 time period). As a consequence of the low wind conditions, snowdrift is very limited at the site. Due to the local topography, the wind is channelized along the north–south direction. Snow is present on the ground several months per year, but owing to the relatively low altitude of the site, surface melt or rain events can occur anytime in the season. In the absence of snow, the soil can undergo subsurface freezing; however, sustained soil freezing has only seldom been observed at −10 cm (one significant occurrence within the last 18 seasons, during the season 2001–2002). The soil texture can be reasonably characterized by the following proportions: 30 % clay, 60 % sand, 10 % silt. The soil is covered with grass, which is mowed in summer approximately every month depending on its growth rate. A building (ca. 50 m2 , 3 m height) hosts the data acquisition system, laboratory space and a cold-room used for experimental work on snow. Because the building is located at the edge of the forest and to the low winds and the position of the building aside the main wind direction, it has a minimum impact per se on the measured snow and meteorological conditions. Despite the low surface area of the experimental site and the generally low wind conditions, heterogeneities of the snowpack are very commonly observed in terms of depth, snow water equivalent (SWE) and internal physical properties (e.g. snowpack stratigraphy). Some of this heterogeneity stems from the presence of the sensors (e.g. thermal radiation emitted by the structure holding the instruments) but a
large fraction of this variability is natural. Such limitations are inherent to any geophysical observations, are particularly true regarding the snowpack at all spatial scales, and should be kept in mind when using the present dataset. Data are provided at the point scale attempting to limit to a minimum any two-dimensional effects, but the latter cannot completely be excluded when carrying out any analysis with the data. Figures 2 and 3 show an overview of the experimental site in the presence of snow in the middle and at the end of the snow season, respectively. This clearly shows that snow conditions are rather homogeneous during the snow season but become patchy and uneven towards its end, in direct relationship to the location of the sensors.
www.earth-syst-sci-data.net/4/13/2012/
2.2
Meteorological driving data
All the data presented here have undergone careful (mostly manual) quality assurance during the period of the year concerned with snow on the ground. This time period has stabilized over the years to the period between 20 September and 10 June. Outside this time interval, atmospheric data are replaced by the output of the SAFRAN meteorological analysis and downscaling model using ARPEGE meteorological fields and neighbouring observations (Durand et al., 1993). This discontinuity of the dataset is insignificant provided that the data are used with a focus on the winter (snow) season. However, such a gap-filling is needed to run a land surface model over several years continuously with a consistent physical state of the soil vertical column in summer. Figure 4 shows a summary of the partitioning between insitu and SAFRAN data for the years used in the present dataset. Within the snow season, data gaps were filled using duplicate sensors from the research plot or, alternatively, using data from neighbouring days consistent with the weather Earth Syst. Sci. Data, 4, 13–21, 2012
16
S. Morin et al.: Col de Porte snow and meteorological data
sensors. This and the hourly averaging procedure hampers a precise quantification of the associated uncertainty. 2.2.3
Figure 4. Summary of the partitioning between in-situ data (grey)
and the output of the meteorological downscaling tool SAFRAN (white) used to build the gap-free driving dataset.
conditions. Depending on the years and on the sensors, missing data represent at most a few % (less than 5 %) of the in-situ winter record. The last step of the quality-control procedure consists of using them to run the snowpack model Crocus (Brun et al., 1992; Vionnet et al., 2012), which allows to identify potential inconsistencies between the driving and evaluation data, such as issues in the quantification and the determination of the phase of the precipitation. Table 1 provides an overview of the hourly meteorological driving data, with the corresponding instrument type and height. 2.2.1
Air temperature and relative humidity
Air temperature (Pt100) and relative humidity (capacitive) sensors are placed in a WMO-standard meteorological shelter, which can be moved vertically to keep a relative constant height over snow. This adjustment is generally carried out on a weekly to semi-weekly basis, consistent with the frequency of visits to the site during the snow season. The uncertainty on temperature and relative humidity lies within 0.1 K and 5 %, respectively, consistent with common uncertainties on meteorological data. 2.2.2
Windspeed
Windspeed is measured using both heated and non-heated cup anemometers. They differ in terms of starting threshold, so that a combination of the two needs to be performed to provide a reliable assessment of windspeed. In practice, to circumvent starting threshold issues, the reported windspeed corresponds to the maximum between the different types of Earth Syst. Sci. Data, 4, 13–21, 2012
Incoming shortwave and longwave radiation
The shortwave and longwave radiation sensors are mounted on a rotating arm, which allows to automatically clean them every hour provided that the air temperature is below 5 ◦ C. The procedure consists of brushing the surface of the sensors, warming them up using an heated-air blower, followed by returning them to ambient temperature conditions using blowing air at ambient temperature. This procedure arises from several years of testing various approaches to prevent significant frost build-up and the accumulation of snow on the sensors. In addition, the sensors holder can be moved vertically to manually adjust to the snow depth and keeping an approximately constant distance between the sensors and the snow surface. For both shortwave and longwave radiation, identical sensors are used for upwards and downwards flux measurements. During snowfall, the shortwave incoming radiation measurements are not reliable due to snow build-up on the sensor during the measurement period. To circumvent this problem and provide gap-free records, the incoming radiation is computed from the reflected radiation measurement (not affected by snow deposition on the sensor) using albedo data from subsequent hours as soon as the snowfall has ceased. The total uncertainty affecting the radiation measurements is estimated to be on the order of 10 %. This value includes instrument uncertainties reported by the manufacturers as well as our own experience from running similar sensors in parallel for several days during the summer. 2.2.4
Precipitation
The master precipitation gauge at CDP is the GEONOR gauge. Complementary precipitation data are provided by the two PG2000, only one of both is heated as soon as the collector temperature drops below 5 ◦ C. Note that the heat rate is adjusted so that the temperature of the precipitation collector remains lower than 5 ◦ C to avoid evaporation as much as possible. Precipitation data are manually partitioned between rain and snow using all possible ancillary information, primarily air temperature but also the information from the heated/nonheated rain gauge, snow depth and albedo measurements. Relative humidity data are used to rule out spurious precipitation events, i.e. small but non-zero hourly recordings of the GEONOR gauge occurring while RH is lower than 70 %. The GEONOR gauge is corrected for windspeed and temperature following Forland et al. (1996), using a heated cup anemometer placed a short distance from the gauge (1 m horizontally, same height above ground), since the 1999– 2000 snow season. For completeness, we provide here the equations used for the correction factor (multiplying the raw precipitation rate). In the case of solid precipitation, the www.earth-syst-sci-data.net/4/13/2012/
S. Morin et al.: Col de Porte snow and meteorological data
17
Table 1. Overview of the sensors used to gather the hourly meteorological data, between 1993 and 2011 at Col de Porte, France. Variable
∗
Sensor
Period of operation
Height ∗
Unit
Integration method
... → 1996/1997 1997/1998 → ...
1.5 m
K
Instantaneous
... → 1994/1995 1995/1996 → 2005/2006 2006/2007 → ...
1.5 m∗
%RH
Instantaneous
Laumonier – heated Chauvin Arnoux Tavid 87 – non-heated Laumonier – heated
1997/1998 → ... whole record 2000/2001 → ...
10 m 10 m 3.3 m
m s−1 m s−1 m s−1
Integrated (60 min) Integrated (60 min) Integrated (60 min)
Inc. shortwave radiation
Kipp & Zonen CM7 Kipp & Zonen CM14
... → 15/03/1996 15/03/1996 → ...
1.2 m∗
W m−2
Integrated (55 min)
Inc. longwave radiation
Eppley PIR Kipp & Zonen CG4
... → 2010/2011 2010/2011 → ...
1.2 m∗
W m−2
Integrated (55 min)
Precipitation
PG2000 heated (2000 cm2 ) PG2000 non-heated (2000 cm2 ) GEONOR (200 cm2 )
whole record whole record whole record
2.75 m 2.75 m 3m
kg m−2 s−1 kg m−2 s−1 kg m−2 s−1
Difference Difference Difference
Atmospheric pressure
Standard M´et´eo-France sensor
whole record
surface
Pa
Instantaneous
Air temperature
PT 100/3 wires PT 100/4 wires
Relative humidity
SPSI MU-C.1/MUTA.2 Vaisala HMP 35DE Vaisala HMP 45D
Windspeed
Height adjusted manually above snow surface (≈ weekly).
following equation is used as long as the windspeed is between 1.0 and 7.0 m s−1 : k = exp (β0 + β1 ug + β2 T + β3 ug T )
(1)
where β0 = −0.12159, β1 = 0.18546, β2 = 0.006918, β3 = −0.005254, ug is the windspeed at gauge height (in m s−1 ) and T is air temperature (in ◦ C). For windspeed values below 1.0 m s−1 , no correction is applied, and above 7.0 m s−1 the correction for a windspeed of 7.0 m s−1 is used. Similarly, the equation is used only when the temperature is above −12 ◦ C ; below this value, the correction factor at T = −12 ◦ C is used. In the case of liquid precipitation, the following equation is used: k = exp (α0 + c + α1 ug + α2 ln(I) + α3 ug ln(I))
(2)
where α0 = 0.007697, α1 = 0.034331, α2 = −0.00101, α3 = −0.012177, c = −0.05, ug is the windspeed at gauge height (in m s−1 ) and I is the precipitation rate (in kg m−2 h−1 ). In the case of mixed-phase precipitation, a mixed correction factor is obtained by averaging the two correction factors with a weighting coefficient according to the relative snow- and rainfall rate. Before the 1999–2000 snow season, the precipitation data were multiplied using a scaling factor adjusted for each year by minimizing the difference between the precipitation record and the observed amount of fresh snow recorded using a snow board; this factor remained on the order of 10 %, with year-to-year variations.
www.earth-syst-sci-data.net/4/13/2012/
2.2.5
Atmospheric pressure
Atmospheric pressure is measured inside the laboratory and its average value of 870 hPa is often used instead of its real variations which only show a standard deviation of 6 hPa for the entire 1993–2011 time period. 2.3
Evaluation data
Table 2 gives an overview of the hourly and daily evaluation data, along with the corresponding sensor and the time period covered in the dataset. 2.3.1
Snow depth
Snow depth is measured using ultra-sound depth rangers. The correction of the impact of air temperature on the velocity of sound in the atmosphere is carried out using air temperature measured at approximately half distance between the sensors and the ground surface. The data are further manually corrected to remove outliers in the dataset, mostly occurring during snowfall. Since the year 2010–2011, a laser ranger has been operating, which has proven less disturbed by ongoing snowfall. Data from the two instruments are now used together to provide the best possible continuous snow depth record. Ultra-sound depth rangers provide measurements accurate within 1 cm for a surface area of a few cm2 on the ground. In contrast, a laser ranger tends to provide more accurate results, but the footprint of the instrument is much smaller (ca. 1 cm2 ). The overall accuracy of the automated snow depth record is thus on the order of 1 cm.
Earth Syst. Sci. Data, 4, 13–21, 2012
18
S. Morin et al.: Col de Porte snow and meteorological data
In addition to these automated measurements, manual snow depth measurements are available at a weekly time resolution from the snowpit observations, complemented by two additional manual snow depth measurements. 2.3.2
Snow water equivalent
Snow water equivalent (SWE) monitoring is challenging although it is key to evaluate snowpack models. Several methods exist to attempt to monitor it automatically (snow pillow (e.g. Reba et al., 2011), sensors based on ground-emitted particles, etc.). At CDP, SWE has been measured since the season 2001–2002 using a ground-based cosmic rays counter operated by EDF-DTG (termed NRC; Kodama et al., 1979; Paquet and Laval, 2006). This instrument requires a sitespecific calibration, which is performed using manual measurements of SWE and shows little variation from year to year. The resulting uncertainty is on the order of 10 %. The key advantage of using this method is that the interface between the snowpack and the underlying ground is not disturbed; indeed, the instrument consists of a small box (horizontal footprint 1 × 0.2 m) whose top is at ground level, thereby minimizing the disturbance induced by the sensor. The manual SWE measurements are carried out on a weekly basis. Up to three measurements are taken (one at the snowpit sampling site, termed “Snowpit”, and two others besides the NRC instrument, termed “Snowpit South” and “Snowpit North”). 2.3.3
Snow albedo
Snow albedo is measured using the radiation sensors described in Sect. 2.2.3. Hourly albedo data are computed from the ratio between incoming and reflected shortwave radiation. However, data are discarded when the incoming radiation level is below 20 W m−2 and the reflected radiation is below 2 W m−2 . In addition, data obtained during snowfall are also discarded from the hourly record. Daily integrated albedo data are computed from the daily summation of all incoming fluxes divided by the summation of all reflected fluxes, using the thresholds described above. This provides a useful measure of the effective albedo of the snowpack, and removes effects from varying solar zenith angle and shading due to the surrounding forest. Data are reported if more than 5 h can be used to compute the albedo. 2.3.4
Snow surface temperature
Snow surface temperature (SST) is computed from the outgoing longwave flux measured using the sensors described in Sect. 2.2.3 and a narrow field of view infra-red sensor. The latter is placed on the same structure as the radiation sensors, but it does not undergo any particular cleaning or defrosting. The other difference is that this sensor records instantaneous measurements every hour, rather than hourly-integrated meaEarth Syst. Sci. Data, 4, 13–21, 2012
surements. For both sensors, the snow emissivity is set to 1 when computing the SST from the outgoing longwave radiation. The present dataset contains for each record the lower of the two measurements. Spurious exceedance of the melt point can be observed, in such case the record has to be interpreted in a more qualitative manner. 2.3.5
Internal snow temperature (“settling disks”)
Internal snow temperature is measured continuously from several plates, allowed to slide freely on a vertical wire, and placed at the top of the snowpack following each significant snowfall (i.e. the SWE of the snowfall is larger than approximately 40 kg m−2 ). In addition to the snow temperature measurements, the vertical position of the plates is recorded through a resistance measurement of the wire holding the plates. The electrical contact between the plates and the wire is secured using a metal spring; previous versions of this device were carried out using liquid mercury, and was replaced for obvious environmental reasons. The uncertainty on the temperature and height of the disks is within 0.1 K and 1 cm, respectively. 2.3.6
Snowmelt
Snowmelt rate (also referred to as runoff here) at the point scale is measured by weighting the water mass drained from each of the two lysimeters (1 and 5 m2 surface area) through pipes bringing it to the scales located in the basement of the laboratory. Note that inconsistencies between total precipitation and runoff at the scale of the season are possible owing to lateral transport in the snowpack, which depends on the snowpack type, e.g. the occurrence of melt-freeze crusts and the location of percolation channels. Several approaches have been employed over the years to try to avoid such issues, relying in particular on the use of vertical walls around the lysimeter collector space, with inconclusive results. Nevertheless, such data provide useful indications on the timing and magnitude of basal runoff. It is virtually impossible to provide an uncertainty assessment for runoff data; a good indication of the variance can be found by looking at the records from the two instruments. 2.3.7
Soil temperature
Soil temperature is measured at 10, 20 and 50 cm below the ground surface. The probes are placed in the ground a few meters from the automated snow depth measurements. The uncertainty is estimated to be 0.1 K for such measurements. 2.3.8
Basal heat flux
Basal heat flux is measured since the season 2010–2011 using three heat flux plates located in the immediate vicinity of the automated snow depth measurements, 1 cm below ground and at approximately 1 m distance from each other. The three www.earth-syst-sci-data.net/4/13/2012/
S. Morin et al.: Col de Porte snow and meteorological data
19
Table 2. Overview of the sensors used to gather the hourly and daily snow data used to evaluate snowpack models, between 1993 and 2011
at Col de Porte, France. Note that outgoing shortwave and longwave radiation is measured using instruments similar to the corresponding incoming radiation, described in Table 1. Note also that snow surface temperature can be derived from the outgoing longwave radiation sensor, in addition to the sensors presented here. Variable
Sensor
Snow depth
Ultra-sound depth gauge BEN Ultra-sound depth gauge FNX Ultra-sound depth gauge SR50A Laser ranger Snowpit (up to three values)
Height
Unit
Time resolution
Integration method
... → 1999/2000 2000/2001 → 2008/2009 2009/2010 → ... 2010/2011 → ... whole record
3m
m
hourly
Instantaneous
3m N.A.
m m
hourly ≈ weekly
Instantaneous N.A.
Cosmic rays sensor Cosmic rays sensora Snowpit (up to three values)
2001/2002 → ... 2008/2009 → ... whole record
0m
kg m−2
daily
24h integration
N.A.
kg m−2
≈ weekly
N.A.
Runoff
5 m2 lysimeter – scale 1 m2 lysimeter – tipping gauge 1 m2 lysimeter – scale
1994/1995 → ... ... → 1995/1996 1997–1998 → ...
0m 0m
kg m−2 s−1 kg m−2 s−1
hourly hourly
Difference Difference
Surface temperature
Testo term Pyroterm Heitronics KT15
whole record 2010/2011 → ...
1.2 mb 2.5 m
K K
hourly hourly
Instantaneous Instantaneous
Soil temperature
PT 100/3 wires PT 100/4 wires PT 100/3 wires PT 100/4 wires PT 100/3 wires PT 100/4 wires
... → 1996/1997 1997/1998 → ... ... → 1996/1997 1997/1998 → ... ... → 1996/1997 1997/1998 → ...
−0.1 m
K
hourly
Instantaneous
−0.2 m
K
hourly
Instantaneous
−0.5 m
K
hourly
Instantaneous
PT 100/3 wires PT 100/4 wires In-house positioning system Hukseflux HFP01
... → 1996/1997 1997/1998 → ... whole recordc since 2010/2011
variable
K
hourly
Instantaneous
variable 0
m W m−2
hourly hourly
Instantaneous Instantaneous
Snow water equivalent
Settling disks temp. Settling disks height Ground flux a b c
Period of operation
Sensor including a shielding for ground-originating neutrons (reduced data scatter). Height adjusted manually above snow surface (≈ weekly). Progressive migration from mercury to solid state electric contact.
resulting values are provided, which is useful to estimate the short-scale variability of this variable, hence an assessment of the degree of confidence which can be placed in such data. 2.3.9
Vertical profiles of the physical properties of snow
Snow stratigraphy observations have been carried out approximately weekly throughout the period considered. They consist of manual measurements of the vertical profile of penetration resistance (standard Ramm sonde), snow temperature, density, type, liquid water content, and grain size as determined by visual inspection of grains following Fierz et al. (2009). The 303 profiles are provided as separate files using the international CAAML format (http://www.caaml.org).
and evaluation data are provided as ascii and NetCDF files; the latter are formatted to be used as is in the land surface model ISBA within SURFEX, which allows coupling to several snowpack schemes (ES, Crocus; Vionnet et al., 2012). Figure 5 shows an overview of albedo, snow depth and SWE data for the entire CDP dataset described here. Summary plots of the present dataset are provided as Supplement to this article. The dataset presented here is available freely, either from PANGAEA (doi:10.1594/PANGAEA.774249) or on the anonymous ftp server ftp://ftp-cnrm.meteo.fr/pub-cencdp/. All inquiries regarding the dataset should be addressed at col de
[email protected]. 4
3
Conclusions
Data availability
The data from CDP have been widely used for snowpack development and evaluation, thereby meeting the needs of M´et´eo-France and external users nationally and internationally. However, until now, all known uses of the data have consisted in year-by-year model runs and evaluation. The new collated data set allows multi-year model runs. The driving www.earth-syst-sci-data.net/4/13/2012/
18 yr of quality-controlled driving and evaluation data from the meteorological research station Col de Porte, Chartreuse mountain, France, have been collated and consolidated. They are presented comprehensively and made freely available and accessible to the scientific community. It is anticipated that such a dataset will continue to prove useful for snow and hydrological model development and evaluation. Data for Earth Syst. Sci. Data, 4, 13–21, 2012
20
S. Morin et al.: Col de Porte snow and meteorological data
Figure 5. Overview of the snowpack albedo, depth and SWE for the entire record. Yearly graphs are provided as Supplement online material.
Earth Syst. Sci. Data, 4, 13–21, 2012
www.earth-syst-sci-data.net/4/13/2012/
S. Morin et al.: Col de Porte snow and meteorological data
upcoming years will be added to the data set on a yearly basis, following the quality-control procedure described above. CDP also hosts short-term experimental campaigns, some of which end up providing long-term records of previously unmeasured data. We hope that further instrumental developments will allow to improve the monitoring of the atmospheric, snow and soil column in the future, leading to further extension of the CDP snow and meteorological data base. Supplementary material related to this article is available online at: http://www.earth-syst-sci-data.net/4/ 13/2012/essd-4-13-2012-supplement.zip.
Acknowledgements. Many thanks are expressed to people
of CNRM-GAME/CEN who have assisted in the collection, collation and archive of this unique dataset. We thank in particular ´ Pougatch, J.-M. Willemet and M. Lacroix for data handling, E. and G. Giraud and Y. Durand for SAFRAN data. We also thank EDF-DTG for fruitful collaboration at CDP, in particular regarding automated SWE measurements and precipitation measurements. Colleagues and reviewers who provided suggestions and comments on earlier versions of this manuscript are gratefully acknowledged. Edited by: N. Verhoest
References Brun, E., Martin, E., Simon, V., Gendre, C., and Col´eou, C.: An energy and mass model of snow cover suitable for operational avalanche forecasting, J. Glaciol., 35, 333–342, 1989. Brun, E., David, P., Sudul, M., and Brunot, G.: A numerical model to simulate snow-cover stratigraphy for operational avalanche forecasting, J. Glaciol., 38, 13–22, 1992.
www.earth-syst-sci-data.net/4/13/2012/
21 Durand, Y., Brun, E., M´erindol, L., Guyomarc’h, G., Lesaffre, B., and Martin, E.: A meteorological estimation of relevant parameters for snow models, Ann. Glaciol., 18, 65–71, 1993. Etchevers, P., Martin, E., Brown, R., Fierz, C., Lejeune, Y., Bazile, E., Boone, A., Dai, Y.-J., Essery, R., Fernandez, A., Gusev, Y., Jordan, R., Koren, V., Kowalczyk, E., Nasonova, N. O., Pyles, R. D., Schlosser, A., Shmakin, A. B., Smirnova, T. G., Strasser, U., Verseghy, D., Yamazaki, T., and Yang, Z.-L.: Intercomparison of the surface energy budget simulated by several snow models (SNOWMIP project), Ann. Glaciol., 38, 150–158, doi:10.3189/172756404781814825, 2004. Fierz, C., Armstrong, R. L., Durand, Y., Etchevers, P., Greene, E., McClung, D. M., Nishimura, K., Satyawali, P. K., and Sokratov, S. A.: The international classification for seasonal snow on the ground, IHP-VII Technical Documents in Hydrology n 83, IACS Contribution n 1, 2009. Forland, E., Allerup, P., Dahlstr¨om, B., Elomaa, E. T., Per¨al¨a, J., Rissanen, P., Vedin, H., and Vejen, F.: Manual for operational correction of Nordic precipitation data, Tech. rep., Det Norske Meteorologiske Institutt., 1996. Kodama, M., Nakai, K., Kawasaki, S., and Wada, M.: An application of cosmic-ray neutron measurements to the determination of the snow-water equivalent, J. Hydrol., 41, 85–92, doi:10.1016/0022-1694(79)90107-0, 1979. Paquet, E. and Laval, M.-T.: Operation feedback and prospects of EDF Cosmic-Ray Snow Sensors, La Houille Blanche, 2, 113– 119, doi:10.1051/lhb:200602015, 2006. Reba, M. L., Marks, D., Seyfried, M., Winstral, A., Kumar, M., and Flerchinger, G.: A long-term data set for hydrologic modeling in a snow-dominated mountain catchment, Water Resour. Res., 47, W07702, doi:10.1029/2010WR010030, 2011. Vionnet, V., Brun, E., Morin, S., Boone, A., Faroux, S., Le Moigne, P., Martin, E., and Willemet, J.-M.: The detailed snowpack scheme Crocus and its implementation in SURFEX v7.2, Geosci. Model Dev., 5, 773–791, doi:10.5194/gmd-5-773-2012, 2012.
Earth Syst. Sci. Data, 4, 13–21, 2012