Database, Vol. 2012, Article ID bas055, doi:10.1093/database/bas055 .............................................................................................................................................................................................................................................................................................
Database Tool CancerMA: a web-based tool for automatic meta-analysis of public cancer microarray data Julia Feichtinger1,2,*, Ramsay J. McFarlane1,3,* and Lee D. Larcombe4 1
North West Cancer Research Fund Institute, Bangor University, Bangor, Gwynedd LL57 2UW, UK, 2Institute for Genomics and Bioinformatics, Graz University of Technology, Graz, Petersgasse 14, 8010, Austria, 3NISCHR Cancer Genetics Biomedical Research Unit, Bangor University, Bangor, Gwynedd LL57 2UW, UK and 4Cranfield Health, Cranfield University, Cranfield, Bedfordshire MK43 0AL, UK *Corresponding author: Tel: +44 1248 382360; Fax: +44 1248 370731; Email:
[email protected] Correspondence may also be addressed to Julia Feichtinger. Email:
[email protected] Citation details: Julia Feichtinger, Ramsay J. McFarlane and Lee D. Larcombe. CancerMA: a web-based tool for automatic meta-analysis of public cancer microarray data. Database (2012) Vol. 2012: article ID bas055; doi:10.1093/database/bas055. Submitted 8 September 2012; Revised 22 November 2012; Accepted 25 November 2012 .............................................................................................................................................................................................................................................................................................
The identification of novel candidate markers is a key challenge in the development of cancer therapies. This can be facilitated by putting accessible and automated approaches analysing the current wealth of ‘omic’-scale data in the hands of researchers who are directly addressing biological questions. Data integration techniques and standardized, automated, high-throughput analyses are needed to manage the data available as well as to help narrow down the excessive number of target gene possibilities presented by modern databases and system-level resources. Here we present CancerMA, an online, integrated bioinformatic pipeline for automated identification of novel candidate cancer markers/ targets; it operates by means of meta-analysing expression profiles of user-defined sets of biologically significant and related genes across a manually curated database of 80 publicly available cancer microarray datasets covering 13 cancer types. A simple-to-use web interface allows bioinformaticians and non-bioinformaticians alike to initiate new analyses as well as to view and retrieve the meta-analysis results. The functionality of CancerMA is shown by means of two validation datasets. Database URL: http://www.cancerma.org.uk .............................................................................................................................................................................................................................................................................................
Introduction Cancer is a multi-factorial disease that can arise from alterations in expression levels of oncogenes and tumour suppressor genes, details of which can be elucidated by means of expression data (1). In the last decade, a large amount of microarray data for gene expression profiles has become available in public repositories such as ArrayExpress (2) and Gene Expression Omnibus (GEO) (3), which provide the opportunity to retrieve, reanalyse and integrate the data (4). Retrieval and reanalysis of publicly available data allow the development of automated pipelines to ensure a broad spectrum of users can execute rapid, homogeneous and reproducible analyses across a large number of datasets, addressing novel and specific questions. Data integration techniques, so-called meta-analyses, aim to combine
the data available and integrate information from multiple independent but related microarray studies to identify significant genes [reviewed by Feichtinger et al. (5)]. Combining studies can enhance reliability and generalizability of the results (6) and can be used to obtain a more precise estimate of gene expression. In particular, the benefit of enhancing the statistical power can help to overcome the most profound limitation of microarray studies: testing tens of thousands of hypotheses, relying only on a relatively low number of samples (7, 8). For example, Arasappan et al. (9) found a refined expression signature for systemic lupus erythematosus, and Vierlinger et al. (10) reported the identification of a potential biomarker for papillary thyroid carcinoma by means of meta-analysis approaches.
.............................................................................................................................................................................................................................................................................................
ß The Author(s) 2012. Published by Oxford University Press. This is an Open Access article distributed under the terms of the Creative Commons Attribution Non-Commercial License (http:// creativecommons.org/licenses/by-nc/3.0/), which permits unrestricted non-commercial use, distribution, and reproduction in any medium, provided the original work is properly cited. Page 1 of 8 (page number not for citation purposes)
Database Tool
Database, Vol. 2012, Article ID bas055, doi:10.1093/database/bas055
.............................................................................................................................................................................................................................................................................................
Here we present CancerMA, an openly accessible integrated bioinformatic analytical pipeline with a user-friendly and intuitive web interface to automate the reanalysis of public cancer microarray datasets with user-defined sets of biologically significant and related genes. The underlying analytical approach was developed for a previous study to identify a cohort of novel cancer-specific marker genes (11) and was automated forming the core of the CancerMA tool. Further analyses and visualizations were added to aid the data interpretation. This tool allows bioinformaticians and non-bioinformaticians alike, to obtain refined and integrated differential expression for their genes of interest across a manually curated database of 80 datasets and 13 cancer types as well as to investigate the relationships between cancer types and to reveal commonalities among them. Furthermore, it can help to narrow down the excessive number of target gene possibilities presented by modern databases and system-level resources to a manageable number of putative candidates, which can be followed up in the laboratory and/or fed into an interaction network analysis. Thus, it puts a meta-analysis pipeline in the hands of those asking the biological questions. To validate our approach, we have analysed two experimentally derived datasets from the literature and could reproduce the published results.
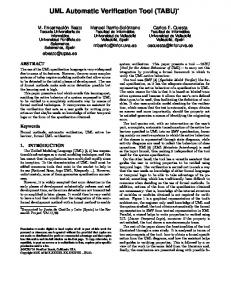
Methods and structure of CancerMA CancerMA consists of a web interface, a set of pipelined analyses and two relational databases, one holding the analysis data for each user and another one holding the gene annotation data. The general workflow is visualized in Figure 1.
Cancer dataset retrieval We searched for raw data of patient-derived, untreated cancer samples with corresponding normal samples deposited in the ArrayExpress (2) or the GEO (3) repository using the HG-U133 Plus 2 array from Affymetrix. After manual assessment, we divided the retrieved datasets according to the cancer type, subtype and stage. We omitted datasets with less than three control or cancer samples as well as datasets deriving from foetal tissues, tissues influenced by other diseases or cancer-associated tissues (e.g. tumour microenvironment). We could obtain 92 datasets from 50 experiments covering 13 distinct cancer types. To allow a meta-analysis, at least two datasets per cancer type were required. Subsequently, quality control using the ‘simpleaffy’ R package (12) was used to further assess the datasets. Based on the guidelines from Affymetrix/‘simpleaffy’ (available at: http://www.bioconductor.org/packages/re lease/bioc/vignettes/simpleaffy/inst/doc/QCandSimpleaffy.
Job submission Mapping of the usersupplied gene list
Web interface
80 Single analysis
Single microarray analysis Annotation Visualisation
Meta-analysis
Microarray meta-analysis Visualisation GO analysis
CancerMA databases
Web interface
Data presentation to the user
Figure 1. CancerMA workflow. The web interface box indicates the areas where the user provides input and/or can view the mapping or analysis results. The analysis is carried out automatically without any user input. The single analysis determines the differential expression for 80 cancer microarray datasets individually, whereas the meta-analysis combines the results form the individual analyses to a differential meta-expression profile.
pdf), datasets with scale factors with 3-fold of one another, an ActB 30 :mid ratio