Predicting and Explaining Automatic Testing Tool Effectiveness Brett Daniel University of Illinois at Urbana-Champaign
[email protected]
Abstract Automatic white-box test generation is a challenging problem. Many existing tools rely on complex code analyses and heuristics. As a result, structural features of an input program may impact tool effectiveness in ways that tool users and designers may not expect or understand. We develop a technique that uses structural program metrics to both predict and explain the test coverage achieved by three automatic test generation tools. We use coverage and structural metrics extracted from 11 software projects to train several decision-tree classifiers. These classifiers can predict high or low coverage with success rates of 82% to 94%. In addition, they show tool users and designers the program structures that impact tool effectiveness.
1. Introduction Automatic test generation is a recurring theme in computer science research [2,4,6,8,9,12,14–16,19,23– 25, 32, 35, 38, 41, 43, 45]. Also called test-input generation, it has many uses in software engineering practice, ranging from augmenting manual testing efforts to automatically generating test suites. Determining inputs that cause a program to execute a particular code path is generally undecidable, and constraint satisfaction algorithms used to solve branch conditions are known to be NP-complete in their general form [11, 29]. Nevertheless, researchers have proposed many heuristics and approximations to produce tests for realistic source code. These heuristics and approximations are often based on the intuition (sometimes experimentally supported) about the types of programs that the analysis is likely to encounter. The unfortunate side effect is that the accuracy or the performance of the analysis algorithms may be adversely affected by a combination of program features or design decisions.
Marat Boshernitsan Agitar Software Laboratories
[email protected]
Understanding the heuristics and the approximations used by a test generation tool would help both users and tool designers. Users would gain knowledge of why a tool did not perform in the way they expected, allowing them to adapt to the tool’s limitations. Tool designers would learn the tool’s limitations, allowing them to improve the tool’s effectiveness. Our experience shows, however, that explaining a tool’s internal heuristics is of little benefit to users or designers. The problem stems from the unexpected interactions between various heuristics that are difficult even for the tool designers to predict. In this paper, we propose an alternative. Rather than explaining a tool’s internal heuristics, we predict the coverage that a tool will achieve and show the program features that led to the prediction. Thus, the prediction provides an explanation for what program features impact a tool’s effectiveness. Why predict coverage when one can just run a test generation tool? First, prediction is significantly quicker than test generation. It takes less than a minute to predict coverage on every method in a moderatelysized program, while it can take hours to generate tests. Second, explanation without prediction is useless. That is, we should explain coverage correctly whether or not we already know the coverage. Third, our method of prediction provides a more direct explanation in terms of program structure than one could achieve by inspection. Finally, prediction is quantifiable by its success rate, while explanation by inspection is not. Our technique entails extracting structural program metrics from a corpus of source code with coverage produced by a given test generation tool. We then use machine learning techniques to train a decision-tree model to predict the coverage that the testing tool will achieve on any method for which the required metrics can be computed. The resulting decision tree assigns a discrete high or low coverage label to methods and provides a list of the metrics that led to the prediction.
Our key contributions are the following: • We present a novel technique by which one can use machine learning algorithms to predict automatic testing tool effectiveness from structural metrics. • We show that prediction using structural metrics provides an explanation of what program features impact tool coverage. • We evaluate predictive models using three automatic testing tools: Agitator [4] and Mockitator from Agitar Software1 and Randoop [35] from the Massachusetts Institute of Technology. We find that decision trees trained on 11 open-source Java projects can predict high or low coverage with 82% to 94% success rate. The rest of this paper is organized as follows. Section 2 presents a high-level overview of our general technique for predicting and explaining coverage in terms of program structure. Section 3 shows how the technique works on real code. Section 4 discusses our implementation of the general technique and demonstrates how a decision-tree classifier is constructed using an off-the-shelf machine learning library. Section 5 presents the subject tools and the training projects and evaluates the success rate of the classifiers. Finally, we discuss the related work in Section 6 and present future work and conclusion in Section 7.
Extract Metrics Training Code
Metrics
Train Model Generate Tests
Decision Tree
Coverage
(a) Process for tool designers to train a predictive model
Decision Tree User Code
Run Model Extract Metrics
Coverage Prediction and Explanation
Metrics
(b) Process for tool users to obtain prediction for their code
Figure 1. Overview of the process to predict and explain a testing tool’s effectiveness explanation, a user extracts the same classes of metrics from his or her body of code as were extracted from the training code. These metrics flow into the predictive model that renders a coverage prediction and explanation in terms of the metrics. In our case, the prediction is a discrete high or low coverage label, and the explanation is the set of metrics that the decision tree used.
2. Overview In this section we give a broad overview of the process we propose to predict and explain effectiveness of an automatic test generation tool on a unit of code. The process has two parts: training a predictive model and using the model. Figure 1(a) illustrates the training process. We begin with a large corpus of source code, which we refer to as the training code. We extract two data sets from the training code. First, we extract many metrics that characterize the structure of functional units such as methods or classes. Second, we run the automatic testing tool to produce a suite of tests. These tests exercise the training code and produce coverage numbers for the functional units. The coverage numbers and metrics flow into an off-the-shelf machine learning algorithm that trains a predictive model. In our case, the model is a decision tree. Figure 1(b) presents the process a tool user would follow to predict and explain coverage based on the structure of his or her code. To derive a prediction and 1 http://www.agitar.com
3. Example To illustrate the process described in Section 2, we focus on two methods from the java.util.HashMap class: the constructor that accepts an initial capacity and load factor, and the putAll method that copies all of the mappings from a given map. The method signatures are the following (we omit method bodies for space but invite the reader to examine the code in his or her JDK). public HashMap(int capacity, float loadFactor) public void putAll(Map m)
At first look, the two methods appear similar. They are publicly visible, accept a small number of arguments, have a similar number of lines, and have a nontrivial amount of control flow. A difference appears when we run Agitator, one of our test generation tools discussed in Section 5.1.1. Agitator achieves full coverage on the constructor but just 14% on putAll. Both the JDK and Agitator development teams would likely benefit from knowing why Agitator treats the two methods differently.
T
# params >0
In Abstract Class
High Coverage
F … T
F
T
T
Is Public
High Coverage
F … … T
Is Constructor F
T
# non-loop paths > 3
# referenc’d types > 4 F
Class has static init
F … … T F …
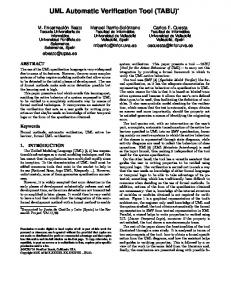
Figure 2. The first three levels of a decision tree trained using our 11 open-source projects To find out, we train a decision tree that uses the method’s structure to predict the coverage that Agitator would achieve. Figure 2 illustrates the first three levels of a decision tree trained on all of our training data except the two methods in question. An internal node contains a test against a structural metric, an edge represents the result of the test, and a leaf node represents a high or low coverage prediction. The ellipses represent deeper portions of the tree that we omit for space. A trace from the root to a leaf is the conjunction of the metric tests that led to a particular prediction. As expected, the decision tree predicts that the constructor would likely get high coverage, and putAll would likely get low coverage. For the constructor, the trace is the following: Is Constructor ∧ ¬ In Abstract Class ∧ Is Public =⇒ High Coverage
These conditions are unsurprising. They merely indicate that Agitator achieves high coverage on the majority of visible constructors located in concrete classes. Had the trace predicted low coverage, the metrics would likely direct an Agitator developer toward heuristics that could handle such methods. The trace for putAll is more interesting (and travels deeper into the tree than shown in the diagram): ¬ Is Constructor ∧ Number of Referenced Types > 4 ∧ Number of Non-Loop Paths > 3 ... ∧ Number of Visible Types > 0 ∧ Number of Branches > 4 =⇒ Low Coverage
It is unclear which of these metrics most likely correlates to low coverage. To narrow the trace to just one metric, we can find the condition nearest the leaf that when negated leads to a high coverage prediction, assuming all other metrics remain the same. This procedure works well since the metrics nearest the leaf are those that differentiate the given method from other similar methods. In putAll’s case, the “Number of Visible Types” metric counts the number of reference types in the method’s signature, including parameters and return type. Negating its condition on leads directly to a high coverage prediction. Since the method has return type void, the new condition implies that low coverage is related to the method’s parameters. In fact, the real reason Agitator gets low coverage is because it is unable to construct a Map object for the m argument with size greater than 0. These examples may seem to imply a direct causal relationship between metrics and coverage, but this is not the case in general. For example, one cannot argue that being a constructor causes high coverage while not being a constructor causes low. The decision tree traces merely indicate a likely correlation between a certain coverage and those methods in the training data for which metrics have certain values.
4. Implementation We feel the approach described in Section 2 is applicable to many kinds of coverage criteria, metrics, and machine learning algorithms. In this section we describe our use of statement and branch coverage; categorize the set of metrics that we use; and explain why we chose to use decision trees as our predictive model.
4.1. Coverage An important requirement of test suites is that they achieve high coverage. Coverage is the degree in which a suite of tests exercises certain program structures [36]. Higher coverage gives greater assurance that a test suite accurately characterizes a program’s behavior. In this paper we focus on statement and branch coverage. Full statement coverage ensures that all program logic was executed at least once, while full branch coverage ensures that all conditions and their negations are met at least once.
4.2. Structural Metrics The key to predicting coverage lies in the choice of program features to extract from source code. We call
these features structural metrics, and they range from familiar object-oriented metrics to metrics derived from control flow. All structural metrics are numeric or nominal values derived by traversing the program’s static parse tree and control flow graph. We explored 49 metrics derived from a method’s signature, body, or containing class. We found methodtargeted metrics can predict coverage much more accurately than metrics derived from larger program elements. The full list of metrics can be found at http:// mir.cs.uiuc.edu/predictcoverage/. Each metric falls into one of the following categories: • Dependency metrics derived from the types that the method references. Examples: number of types visible in the method’s signature, fraction of parameters declared as abstract types, number of types referenced in the method’s body • Field access metrics derived from reads or writes to fields. Examples: number of accesses to static fields, number of accesses to fields declared in ancestor classes • Method structure metrics derived from the method’s declaration. Examples: the method’s visibility, whether the method is a constructor, whether the method returns a value • Containing class metrics derived from the class in which the method is declared. Examples: whether the class has a visible constructor, whether the class has static state, whether the class is abstract • Control flow metrics derived from the method’s control-flow graph. Examples: basic block count, branching depth, longest path length, cyclomatic complexity Our list of metrics is certainly not exhaustive, nor does it include all possible metric categories. There has been a great deal of work describing and categorizing objectoriented metrics [26]. Cyclomatic complexity [30], one of our control flow metrics, is perhaps the most widely known. In addition, work from Jungmayr [20] inspired several of our dependency metrics, while early work from Rapps and Weyuker [39] and Hudepohl et al. [18] inspired some of our control flow and method structure metrics. One can calculate most of the metrics listed above by traversing the program’s static parse tree. We used Spoon2 , a Java processor and transformation framework, to build parse trees since it supports Java version 1.6 and provides an extensive and well-designed 2 http://spoon.gforge.inria.fr/
abstract syntax tree library. Control flow metrics require analysis of a method’s control flow graph. We created control flow graphs using a library native to AgitarOne. In both cases, extracting metrics amounts to counting occurrences of a particular feature in the tree or graph. Our initial selection of metrics was based on intuition about code features that may impact testing tool effectiveness. We found it useful to expand the list by adding metrics as needed. If the model predicted a method’s coverage incorrectly, we inspected the method to find unique features that we could encode as a metric. We did not need any knowledge of the testing tool’s analysis to add metrics that we felt differentiated a method from others. We could safely add many such metrics since the training algorithm (see Section 4.3) would ignore metrics that did not reveal any new information.
4.3. Predictive Models Predictive models fall into one of two general categories: regression models that predict continuous values and classification models that predict discrete values. Our first experiments focused on regression models, but we found these performed poorly since coverage is bounded by [0%, 100%]. Many closely-related nominal metrics or just one unusually large or small numeric metric could send the prediction out of this range, drastically increasing the prediction error. We then experimented with several classification models and found that decision trees best served our purposes for the following reasons: • One can easily understand a decision tree’s prediction. As Figure 2 shows, a tree’s internal nodes test metrics, and a prediction can be represented as a trace down the tree. Our example in Section 3 shows that one can determine the metric that most likely leads to a certain coverage prediction. • A decision tree is convertible to and from other classification models such as decision tables, rules, and certain probabilistic models, yet is a useful representation for an executable classifier. • A decision tree learning algorithm will ignore metrics that do not reveal new information. Thus, we can add many metrics and the tree will only contain those that the algorithm determines are useful. • There are many mature algorithms for creating decision trees. We used an off-the-shelf implementation of the C4.5 algorithm [37] implemented in the Weka toolkit [44]. We omit a description of the algorithm, since it is described in detail in [37].
public void testAddLast() throws Throwable { Collection c = ... ArrayDeque arrayDeque = new ArrayDeque(c); arrayDeque.addLast("testString"); ... assertFalse(arrayDeque.isEmpty()); assertEquals("testString", arrayDeque.peekFirst()); }
(a) Agitator test public void testAddLastWithAggressiveMocks() throws Throwable { ArrayDeque deque = Mockingbird.getProxyObject(ArrayDeque.class, true); Object[] objects = new Object[1]; Object obj = Mockingbird.getProxyObject(Object.class); setPrivateField(deque, "tail", new Integer(0)); setPrivateField(deque, "elements", objects); setPrivateField(deque, "head", new Integer(1)); Mockingbird.enterTestMode(ArrayDeque.class); deque.addLast(obj); assertNotNull(getPrivateField(deque, "elements")); assertFalse(deque.isEmpty()); }
(b) Mockitator test public void testclasses25() { ... int var25 = 0; ArrayDeque var26 = new ArrayDeque(var25); ... short var28 = 1; var26.addLast(var28); Object var30 = var26.peekLast(); Object var31 = var26.pop(); ... assertEquals(1, var30); assertEquals(1, var31); }
(c) Randoop test
Figure 3. Tests produced by the testing tools that exercise the addLast method of the java.util.ArrayDeque class The type of trees we chose required discrete rather than continuous coverage values. We experimented with several numbers of coverage divisions, but we found that a two-way division into high and low coverage yielded the best results. This was a natural choice since as Figure 6 shows, there are distinct “clusters” of values around 0% and 100% coverage. Section 5.3.1 discusses the best point at which to place the division between the two extremes.
5. Evaluation In this section we explain the analysis performed by the three testing tools, describe our training data, and evaluate prediction effectiveness.
5.1. Testing Tools Automatic test generation tools produce a suite of unit tests with minimal user intervention. These unit tests are regression tests in that they verify that program behavior remains unchanged as the code evolves [36]. Our experiments dealt with three automatic test generation tools: two packaged with Agitar Software’s AgitarOne product, and one developed at the Massachusetts Institute of Technology.
5.1.1. Test Generation with AgitarOne. AgitarOne is a comprehensive unit testing product for Java developed at Agitar Software. It combines tools for software agitation [4] (a technique for exploratory testing), regression test generation, reporting, and continuous integration. Test generation is supported in AgitarOne by two distinct test generation engines. Agitar’s Agitator is a dynamic test generation engine that uses runtime feedback and limited on-the-fly static analysis to generate input data for software agitation and for regression test generation. Agitar’s Mockitator (internal code-name) is a static test generation engine that creates regression tests based on static program analysis. For the purposes of our evaluation, we treated these two engines as independent and created separate classifiers for each one. The Agitator engine generates test inputs to achieve basic path coverage, while attempting to dynamically exercise every possible normal and exception-throwing outcome of every public method in each code unit. The Agitator engine uses a combination of static and dynamic analyses. The dynamic analysis uses runtime feedback to generate data values to direct execution along a particular code path. The static analysis uses heuristic-driven path analysis to collect and solve input value constraints to assist the dynamic analysis in generating new values. Cooperation of static and dynamic analyses in Agitator is similar to a more systematic hybrid approach suggested by other researchers [8, 41]. Boshernitsan et al. [4] describe the tool’s analyses and heuristics in greater detail. Figure 3(a) illustrates a test produced by Agitator. The Mockitator engine generates test inputs statically by constructing a chain of path conditions for each code path that needs to be covered. As a code path is traversed backward, the conditions are translated into a system of constraints to be incrementally processed by a propagating constraint solver based on constraint handling rules [13, 42]. This arrangement, previously proposed in testing literature (e.g., [10]), enables early rejection of infeasible paths. Mockitator benefits from the ability to “mock-out” (hence its name) the implementation of any Java class or any Java method, limiting the need to unwind unrelated method calls in the path. Mocking is standard technique for achieving unit-level isolation of code [28]. Mockitator employs mocking more aggressively than a human tester would by using a custom library that enables mocking through runtime instrumentation. As a result, Mockitator generates regression tests that tend to have very high coverage, but are admittedly more brittle than the more realistic tests generated by the Agitator engine. Figure 3(b) illustrates a test produced by Mockitator.
Figure 6. Coverage distribution across all projects for each of the test generation tools
Figure 5. Coverage achieved on each of the projects using the default settings for each of the test generation tools
In the AgitarOne product, the two engines are used in tandem, with Mockitator filling-in for the coverage paths undiscovered by Agitator. 5.1.2. Test Generation with Randoop. Randoop is a tool created by Pacheco et al. [35] that implements feedback-directed random test generation for objectoriented programs. Randoop incrementally constructs sequences of method calls that create and mutate objects. It constructs each sequence by randomly selecting an existing sequence and “extending” it with a call to a random public method. Following construction, it reflectively executes the sequence to produce results that feed back into later sequences. Figure 3(c) illustrates a test produced by Randoop. Randoop can operate in two testing modes. In “contract-violating” mode Randoop checks a set of method or object contracts upon each sequence execution. In “regression” mode Randoop presumes the code’s behavior to be correct and generates JUnit tests that capture that behavior. For the experiments in this paper, we used Randoop’s regression test generation.
5.2. Training Code As described in Section 2, training a model requires two inputs: metrics extracted from a large corpus of code and coverage derived from a regression test suite. Figure 4 lists the 11 open source applications
from which we extracted metrics and coverage. We have posted the entire data set at http://mir.cs. uiuc.edu/predictcoverage/. We ran the three test generation tools on our training projects to produce regression test suites. Figure 5 shows the coverage achieved by the generated test suites on the training projects. The final row illustrates the combined coverage across all projects. Agitator achieved 67%, Mockitator achieved 91%, and Randoop achieved 58%, but crashed when generating tests for ANTLR, Apache Commons Collections, and Jython. We notified Randoop’s designers about the crashes. Figure 6 illustrates the distribution of coverage across all projects for each of the test generation tools. 0% and 100% coverage occur on many more methods than all other coverage values combined. This natural clustering drove our decision to predict discrete high/low coverage values.
5.3. Model Evaluation We evaluated models using their success rate, measured as the ratio of correctly classified methods to the total number of methods [44]. We used several forms of validation and found that decision trees could predict high or low coverage with success rates of 82% to 94%. When evaluating classifiers, one must partition the data set into two disjoint subsets: one for training a model and the other for testing. Cross-validation repeats the train-test process for several divisions (and several models) and reports the average success rate. We used two methods of cross-validation. 10-fold cross-validation, a widely-accepted method for verifying machine learning classifiers [44], divides the data into 10 random subsets and performs cross-validation using 9 subsets for training and the remaining subset for testing. Leave-project-out (LPO) cross-validation, a method specific to our experiments, trains a model on
Project Name ANTLR 3.0.1 Apache Commons Collections 3.2 Apache Commons Primitives 1.0 ASM 3.1 java.util 1.6 javax.xml 1.6 JSAP 2.1 Jython 2.2.1 Metrics Extractor TestOrrery 0.1 TimeAndMoney 0.5.1 Total
Classes 177 424 231 156 205 208 77 920 71 40 46 2,555
Methods 2175 3703 1777 1243 1935 1088 462 7709 530 202 449 21,273
KLOC 70 64 35 37 39 49 11 110 6 3 3 425
Description A parser generator An extended collection library Collections and utilities optimized for primitive types A Java bytecode manipulation and analysis framework Java’s collection library Java’s XML library A command-line argument parser A Python interpreter Our program for extracting metrics from source code An imperative test data generation framework A time and money library
Figure 4. Training Projects
Figure 7. Success rate using the majority class (ZeroR), 10-fold cross-validation, and leaveproject-out (LPO) cross-validation
all projects except one which is left out for testing. This form of cross-validation simulated the success rate on new projects with differing coding styles. We compared these two success rates against the success rate of the ZeroR classifier that always predicts the most common classification. Its success rate provided a useful indication of a predictor’s worst performance, since a nonrandom prediction scheme should do better. In our case, the ZeroR success rate corresponded to the fraction of instances on the largest “side” of a high/low coverage division. Figure 7 compares the ZeroR classifier’s success rate against the success rates of the best decision tree classifiers measured by the two cross-validation schemes. In our experiments, 10-fold cross-validation yielded success rates of 85%, 94%, and 82% (16%, 3%, and 31% above ZeroR) for Agitator, Mockitator, and Randoop, respectively. LPO cross-validation yielded success rates of 76%, 89%, and 64%. These values were lower than 10-fold cross-validation, but we speculate that the addition of a larger number of projects would
narrow the difference, since any one project would have less impact on training. LPO cross-validation indicated that the decision-tree classifiers performed 7% and 13% better than ZeroR for Agitator and Randoop tests, but 2% worse for Mockitator tests. We speculate that the Mockitator classifier’s poor LPO success rate was due to Mockitator’s already high coverage (and correspondingly high ZeroR success rate) that magnified the loss of one training project. Again, we speculate that a larger number of projects would bring LPO cross-validation above ZeroR. LPO cross-validation also indicated how well a decision-tree classifier would predict coverage on individual projects. Figure 8 shows the success rate on each project when left out of the training set, relative to the overall ZeroR success rate. We found that the success rates for the Agitator (Figure 8(a)) and Randoop (Figure 8(c)) classifiers were higher than ZeroR’s success rate on most projects. This result indicates that a decision tree trained on one corpus of code can accurately predict coverage on another, previously unseen corpus of code. The success rate of the Mockitator classifier (Figure 8(b)) was less convincing, due, once again, to Mockitator’s already high ZeroR success rate. Finally, we are confident that the addition of more metrics tailored to each testing tool would improve success rates measured using all verification methods. 5.3.1. High/Low Coverage Division. The choice of where to place the division between high and low coverage affected the classifier’s success rate. It also varied by testing tool, since as Figures 5 and 6 show, each tool achieved a different amount of coverage. We wanted to find the division that produced classifiers with the highest success rate. Figure 9 shows the success rate for the three testing tools and six division points between 40% and 90%,
(a) Agitator
(b) Mockitator
(c) Randoop
Figure 8. Success rate on projects when left out of the training set, relative to each tool’s overall ZeroR success rate inclusive. The charts show that the best division for Agitator and Mockitator was between 40% and 50%, and Randoop was 90%. The best division did not correlate with the tool’s average coverage. Also, the classifiers got relatively high success rates regardless of the split, varying only within a range of only about 5%. 5.3.2. Decision Tree Size. We experimented with the machine learning parameters in an attempt to reduce the size of the tree (i.e. number of nodes) without decreasing success rate. Smaller trees are desirable for two reasons. First, they are easier to understand since the tree uses fewer metrics to reach a prediction. Second, smaller trees are less prone to “overfitting” in which the tree is too specific to the training data. We adjusted the tree size using two parameters: confidence factor, which determines the amount of pruning, and minimum leaf instances, which determines the number of instances in the training data required to form a leaf node. Figure 9 illustrates that there was an unsurprising positive correlation between tree size and the success rate measured using 10-fold cross-validation. More importantly, it illustrates that tree size varied greatly (between 171 and 1,077 nodes for the Agitator tree) without drastically affecting success rates. Thus, relatively small trees had a success rate nearly as good as much larger trees.
6. Related Work This work is most closely related to existing work in automatic test generation, program metrics, machine learning, and testability.
6.1. Test Generation Existing techniques for test generation can be broadly partitioned in two categories. Static approaches are based on some form of symbolic path analysis [2, 6, 9,12,23,38,43,45] combined with automated reasoning and constraint solving. In contrast, dynamic methods execute the system under tests with some (often random) input values and use runtime feedback to adjust input values for a subsequent executions [16, 24, 25, 32, 35]. More recently, researchers have also proposed a hybrid approach to that uses dynamic execution to improve precision of symbolic analysis [4,8,14,15,19,41].
6.2. Metrics and Machine Learning There is a long history of metrics in object-oriented programming. Many authors have provided catalogs of program metrics [3,18,26] or proposed new metrics [20, 30, 39]. We are unaware of other work that uses metrics to predict test coverage or explain effectiveness of tools that employ software analyses. Early work from Selby and Porter [40] used 74 metrics to train decision trees to predict development effort. Since then, research has continually focused on using metrics as a means of predicting software defects, often using machine learning techniques. Nagappan et al. [34] used complexity metrics to predict the likelihood of post-release code defects. They found that no single set of metrics can accurately predict defects on all projects. This finding echoes Menzies et al. [31] assertion that particular metrics are less important than the learning technique employed. Many have used machine learning in other aspects of software engineering such as fault localization [7,22], modeling program execution [5], predicting defect density [21, 33], and certifying build results [17].
6.3. Testability High coverage is one indicator of high testability. The other is the ease in which a human or test generation tool can produce tests that achieve high coverage. Several researchers have made strides toward quantifying testability [1,20,27,46], but since one can not easily quantify the ease or difficulty in producing tests, a general testability metric remains elusive. We conjecture that automatic test generation tools may provide a rough indication of testability, since they make it very easy to produce tests and give an easilyquantifiable measure of their effectiveness: coverage. Exploring the general concept of testability is outside the scope of this paper, but one may intuitively agree that if an automated tool gets low coverage on a unit of code, then a human may also find testing difficult.
7. Future Work and Conclusion Program structure impacts the effectiveness of automatic testing tools in unexpected ways. Both tool users and tool designers would benefit from knowing what program features are responsible for poor tool performance. We have shown that one can predict and explain tool effectiveness, measured in terms of coverage, using metrics derived from program structure. Even so, this paper does not address the question of how tool users and designers can use the knowledge that our technique provides. We will concentrate on the following questions in future work. How can users modify their code to improve tool effectiveness? We are foresee using our technique’s predictions to suggest refactorings that will improve both coverage and the design of the system under test. How can designers improve the tool’s analysis to overcome difficult program features? We expect that tool designers would welcome a list of program features that correlate with low coverage, and that such a list would lead toward novel analyses and heuristics. How can we improve the prediction’s success rate? We are exploring the use of project-specific and userdefined metrics that would improve the prediction success rate on projects that get particularly high or low coverage. We are also working on continuouslyevolving classifiers that re-train themselves as a user’s code changes. We expect that the answers to these questions may improve automatic testing tools and pave the way for a general notion of testability based on program structure.
Figure 9. The relationship between the high/low split point, tree size, and success rate across all tools and projects
Acknowledgements We thank CP Lim and Darko Marinov for several key suggestions during the early stages of this research. We also thank Carlos Pacheco for supporting our use of Randoop and for his comments on early drafts of this paper.
References [1] R. Bache and M. Mullerburg. Measures of testability as a basis for quality assurance. Software Engineering Journal, 5(2):86–92, Mar 1990. [2] D. Beyer, A. J. Chlipala, and R. Majumdar. Generating tests from counterexamples. In ICSE, 2004. [3] R. V. Binder. Design for testability in object-oriented systems. Commun. ACM, 37(9):87–101, 1994. [4] M. Boshernitsan, R. Doong, and A. Savoia. From Daikon to Agitator: lessons and challenges in building a commercial tool for developer testing. In ISSTA, 2006. [5] J. F. Bowring, J. M. Rehg, and M. J. Harrold. Active learning for automatic classification of software behavior. SIGSOFT Softw. Eng. Notes, 29(4):195–205, 2004. [6] R. S. Boyer, B. Elspas, and K. N. Levitt. A formal system for testing and debugging programs by symbolic execution. In ICRS, pages 234–245, 1975. [7] L. C. Briand, Y. Labiche, and X. Liu. Using machine learning to support debugging with tarantula. In ISSRE, pages 137–146, 2007.
[8] C. Cadar and D. R. Engler. Execution generated test cases: How to make systems code crash itself. In SPIN, volume 3639, pages 2–23. Springer, 2005. [9] L. A. Clarke. A system to generate test data and symbolically execute programs. IEEE Trans. Soft. Eng., 2(3):215–222, Sept. 1976. [10] L. A. Clarke and D. J. Richardson. Symbolic evaluation methods – implementations and applications. In Computer Program Testing, pages 65–102. 1981. [11] S. A. Cook. The complexity of theorem-proving procedures. In STOC, pages 151–158. ACM, 1971. [12] R. A. DeMillo and A. J. Offutt. Constraint-based automatic test-data generation. IEEE Trans. Soft. Eng., 17(9):900–910, Sept. 1991. [13] T. Fr¨uhwirth. Theory and practice of constraint handling rules. Journal of Logic Programming, 37(1-3), Oct. 1998. [14] P. Godefroid. Compositional dynamic test generation. In POPL, pages 47–54. ACM, 2007. [15] P. Godefroid, N. Klarlund, and K. Sen. DART: directed automated random testing. In PLDI. ACM, 2005. [16] N. Gupta, A. P. Mathur, and M. L. Soffa. Generating test data for branch coverage. In ASE, page 219. IEEE Computer Society, 2000. [17] A. E. Hassan and K. Zhang. Using decision trees to predict the certification result of a build. ASE, 0:189– 198, 2006. [18] J. Hudepohl, S. Aud, T. Khoshgoftaar, E. Allen, and J. Mayrand. Emerald: software metrics and models on the desktop. IEEE Software, 13(5):56–60, 1996. [19] K. Inkumsah and T. Xie. Evacon: a framework for integrating evolutionary and concolic testing for objectoriented programs. In ASE, pages 425–428, 2007. [20] S. Jungmayr. Improving testability of object-oriented systems. PhD thesis, FernUniversit¨at in Hagen, Dec. 2003. [21] T. M. Khoshgoftaar and E. B. Allen. Ordering faultprone software modules. Software Quality Control, 11(1):19–37, 2003. [22] S. Kim, T. Zimmermann, E. J. W. Jr., and A. Zeller. Predicting faults from cached history. In ICSE, 2007. [23] J. C. King. Symbolic execution and program testing. Commun. ACM, 19(7):385–394, 1976. [24] B. Korel. Automated software test data generation. IEEE Trans. Soft. Eng., 16(8):870, Aug. 1990. [25] B. Korel. Dynamic method of software test data generation. Softw. Test, Verif. Reliab, 2(4):203–213, 1992. [26] M. Lanza and R. Marinescu. Object-Oriented Metrics in Practice. Springer, 2006. [27] B. Lo and H. Shi. A preliminary testability model for object-oriented software. Software Engineering: Education and Practice, pages 330–337, 1998. [28] T. Mackinnon, S. Freeman, and P. Craig. EndoTesting: Unit testing with mock objects. In XP2000, May 2000. [29] A. Mackworth. Consistency in networks of relations. Artificial Intelligence, 8(1):99–118, 1977. [30] T. McCabe. A complexity measure. IEEE Trans. Soft. Eng., 2(4):308–320, 1976.
[31] T. Menzies, J. Greenwald, and A. Frank. Data mining static code attributes to learn defect predictors. IEEE Trans. Soft. Eng., 33(1):2–13, 2007. [32] W. Miller and D. L. Spooner. Automatic generation of floating-point test data. IEEE Trans. Soft. Eng., 2(3):223–226, Sept. 1976. [33] N. Nagappan and T. Ball. Use of relative code churn measures to predict system defect density. ICSE, 2005. [34] N. Nagappan, T. Ball, and A. Zeller. Mining metrics to predict component failures. In ICSE. ACM, 2006. [35] C. Pacheco, S. K. Lahiri, M. D. Ernst, and T. Ball. Feedback-directed random test generation. In ICSE, 2007. [36] M. Pezz`e and M. Young. Software Testing and Analysis: Process, Principles, and Techniques. Wiley, April 2007. [37] J. R. Quinlan. C4.5: Programs for Machine Learning. Morgan Kaufmann, 1993. [38] C. V. Ramamoorthy, S.-B. F. Ho, and W. T. Chen. On the automated generation of program test data. IEEE Trans. Soft. Eng., 2(4):293–300, Dec. 1976. [39] S. Rapps and E. J. Weyuker. Selecting software test data using data flow information. IEEE Trans. Soft. Eng., SE11:367 – 375, April 1985. [40] R. W. Selby and A. A. Porter. Learning from examples: Generation and evaluation of decision trees for software resource analysis. IEEE Trans. Soft. Eng., 14(12):1743– 1757, 1988. [41] K. Sen, D. Marinov, and G. Agha. Cute: a concolic unit testing engine for C. In ESEC/FSE. ACM, 2005. [42] P. Van Weert, T. Schrijvers, and B. Demoen. K.U.Leuven JCHR: a user-friendly, flexible and efficient CHR system for Java. In Proc. Workshop on Constraint Handling Rules, pages 47–62, 2005. [43] W. Visser, C. S. Pˇasˇareanu, and S. Khurshid. Test input generation with Java PathFinder. In ISSTA. ACM, 2004. [44] I. H. Witten and E. Frank. Data Mining: Practical Machine Learning Tools and Techniques. Morgan Kaufmann, San Francisco, 2nd edition, 2005. [45] T. Xie, D. Marinov, W. Schulte, and D. Notkin. Symstra: A framework for generating object-oriented unit tests using symbolic execution. In TACAS, volume 3440 of LNCS. Springer-Verlag, 2005. [46] P.-L. Yeh and J.-C. Lin. Software testability measurements derived from data flow analysis. CSMR, 1998.